BANK
SIZE
AND
EFFICIENCY
IN
DEVELOPING
COUNTRIES:
INTERMEDIATION APPROACH VERSUS VALUE ADDED APPROACH AND
IMPACT OF NON-TRADITIONAL ACTIVITIES
Sameh Charfeddine Karray
Faculty of Tunis Assistant professor in Finance, Institute of the High Commercial Studies of Sfax University of Sfax, Tunisia.
Jamel eddine Chichti
Faculty of Tunis Professor in the High institute of commerce of Tunis
ABSTRACT
Following the using a panel of 402 commercial banks from 15 developing countries over the period
between 2000-2003 period, we assess the effect of bank size on technical efficiency and its two
components: pure technical and scale efficiencies. We use in this study data envelopment approach
(DEA) under specifications that allow the examination of the impact on results of the choice to
measure banking activities with an intermediation or a value added approach, and of course a test
for the relevance of including non traditional activities. Results indicate that examined banks suffer
from serious problems of technical inefficiency involving a total average waste of resources that
exceeds 46% of their actually levels. This inefficiency is mainly due to pure technical inefficiency
for all size of banks except the largest banks for which we found high levels of scale inefficiency.
The conducted test results show that the models with and without non-traditional activities are
equivalent in terms of overall technical efficiency for banks of all size classes except for those of
the smallest size. However, it is proved by these tests that the choice of an intermediation or a
value added approach for measuring banking activity can significantly influence the generated
average levels of technical efficiency for all bank sizes, but scale efficiency estimates appeared to
be less sensitive to this choice.
Keywords:
Size, technical efficiency, bank performance, developing countries.INTRODUCTION
In the last two decades, a vast movement of concentration and restructuring of the banking sector has characterized almost all developed countries and many developing countries. In this field,
Asian Economic and Financial Review
merger operations of banks supported by economic policy makers and managers of banks have imposed a new scale of size-based banks. They constitute a specific response to the decrease in profitability charged by firms on traditional intermediation activities and the erosion of their charter values induced by deregulation and increased competition from both banking and non-banking institutions. Also, there is an obligation for banks to grow at the same rate as large companies they are funding. But more importantly, it is expected that through these acquisitions – mergers, banks will be able to achieve better cost structures benefiting from economies of scale and scope provided by their size and therefore improving the efficiency of their production. Better banking sector efficiency will have its impact on the economic well-being and social development of any country through improved profitability, greater amounts of intermediated funds, better prices and quality of services offered to clients and increased financial system's strength and stability.
Despite these opportunities theoretically related to the increasing of banks size and the shift towards more concentrated structures, the empirical literature does not seem to reach a consensus in the empirical validation attempts. Indeed, if we consider the benefits of size in terms of economies of scale, we note that the majority of studies have led to estimated cost functions with U-shaped profile. They are decreasing with size up to a certain value of total assets and unit costs rise beyond this level, indicating that medium-sized banks are more scale efficient than large and small banks
Empirical evidence provided in the present study focusing on efficiency of commercial banks in developing countries will allow particularly assessing the situation of banks from these countries in the new competitive environment imposed by national and international competition. Moreover, the decomposition of the overall efficiency of banks orientates corrective actions of banking managers to the most important sources of inefficiency. Finally, in examining the possible differences in production performance of banks according to their size, it is possible to determine the size of banks associated with better performance indices and therefore guide banks managers and policy makers towards the best strategies and policy restructuring.
The rest of the paper will be organized as follow. In the second section, we will present a review of related literature about the relationship between size and performance in banking and the treatment in efficiency studies of deposits and non traditional activities in the measure of banking activity. The third section of the document will be devoted to the description of the empirical methodology of the research. The results of its application on our data will be presented and their implications discussed in the fourth section. Finally, we will conclude in section five.
RELATED LITERATURE
Size and Efficiency in Banking
Literature aiming to generate empirical evidence on the potential impact and significance of size on measured efficiency of banks yields no consensus. The results are subtle and sometimes ambiguous about the direction of the possible effect. Intuitively, we can expect a positive relationship arising from the fact that larger banks are more able to develop technical, financial, human and material resources enhancing their efficiency. In a reverse direction, since agency, coordination and dysfunction problems, are more accentuated in greater firms, we can expect smaller banks to generate inefficiency scores lower than those of larger banks. A majority of studies have led to functions of estimated average cost with U-shaped profile. They are decreasing with size up to a certain value of total assets and unit costs rise beyond this level, indicating that it is the medium-sized banks that seem to have a more efficient scale than large and small banks (Berger et al., 1987; Noulas et al., 1990; Mester, 1992; Clark, 1996). But, we notice that more recent literature has identified some empirical evidence on the existence of economies of scale in banking. For example,
significant positive correlation between the size and pure technical efficiency of banks. The largest banks have appeared to be relatively more efficient in the study of Hasan and Marton (2003) on Hungarian banks. A positive relationship between the size and the overall efficiency of banks was also found for Australian banks by Sathye (2001). Also, he also has established that technical inefficiency is more important as source of overall inefficiency than allocative component. On Turkish banks, Isik and Hassan (2002) have arrived to similar results about the dominance of technical inefficiency, but the relationship between size and efficiency has emerged strongly negative.
According to Berger and Mester (1997), larger banks have shown a slightly higher efficiency than small ones, when they considered efficiency on the cost side. But in terms of profit efficiency, smaller banking firms appeared more efficient. All, these results indicate that when banks increase in size, they are more able to control their costs, but it becomes difficult for them to be efficient in creating income and generate profit. On Indian banks, Srivastava (1999) found higher average efficiencies for medium-sized banks, followed by large banks. Small banks appeared the less efficient, which show that relationship between size and efficiency isn't positively monotonic. In contrast, in the study of Allen and Rai (1996), the largest banks have been marked by higher levels of inefficiency for the majority of the 15 countries studied. Also, for a sample of banks from 11 European countries, Goldberg and Rai (1996) suggest that larger banks did not show higher efficiencies. However, no clear relationship between estimated efficiencies and size has been proved by Fukuyama (1993) and Altunbas et al. (2000) for Japanese banks, and by Lang and Welzel (1996) for German cooperative banks.
Measuring Bank Activity: Are Deposits Input or Output?
A major problem arising while measuring banks' activity is about the treatment o deposits. It was pointed out by Wykoff (1992) as follows: "When deposits are outputs, why are they so cheap? When they are inputs, why do people provide them to banks? "(p. 12)
However, other currents of thought (including value-added and user cost approaches) suggest that deposits should be considered as output since they constitute elements on which the customers bear opportunity costs and they participate in the value added creation. Indeed, according to the user cost approach, we can determine whether a financial product is an input or an output depending on its net contribution to banking income. If the financial performance of an asset exceeds the opportunity cost of funds, or alternatively if the financial cost of a liability is less than the opportunity cost, they are considered as outputs, in other cases, they are considered as inputs
(Hancock, 1985). In the value added approach, we identify the categories of bank balance sheet (assets and liabilities) as outputs by their contribution to the value or because they are associated with the consumption of real resources (Berger et al., 1987). Considering that banks provide two main categories of financial services: intermediation and credit services on one hand, and care, payment and cash on the other hand, in the value added approach, deposits are considered as input and output at the same time. Thus, under this approach, the major categories of deposit products (demand, savings and term deposits) and credits are considered as outputs because they are responsible for a significant proportion of the value added. Among the studies using this approach we find Carvallo and Kasman (2005), Sathye (2001), Dietsch and Lozano (2000) and Lozano et al.
(2002).
Non Traditional Activities of Banks
It should be noted that banks around the world have diversified away from traditional financial intermediation activities in the off-balance sheet and fees and commissions generating activities. Thus, it may be inappropriate to focus exclusively on traditional remunerative assets and neglect an important part of modern banking operations. Therefore, several recent studies have included additional output variables to capture the non-traditional activities and operations of banks. In the literature, two types of measures were used to capture these non-traditional activities one measure is in flow terms (the non-interest income), and other measures are expressed in terms of stocks (off-balance sheet items in nominal or weighted for risk values). Indeed, although the off (off-balance sheet items are not technically paying assets, they constitute a growing source of bank income (Hakimi et al., 2012) and should therefore be included in attempts to model the characteristics of bank costs in order not to have a total output that is under-determined (Jagtiani and Khanthavit, 1996; Altunbas
et al., 2000; Altunbas et al., 2001). Isik and Hassan (2003) showed that the exclusion of off-balance sheet elements from the production bank specifications led to a significant deterioration in efficiency scores and average productivity of the entire industry. According to these authors, the extent of bias is more pronounced among the banks most involved in nontraditional activities, for which the deteriorating levels of efficiency is more important.
require similar costs to gather information for initialization and for subsequent monitoring and control. Similarly, according to Isik and Hassan (2002), off-balance sheet items are comparable to credits in terms of risk and income. But, since the of off-balance sheet activities are generally four or five times greater than the balance sheet items, their inclusion in efficiency models in notional values can cause a bias. Therefore, in many studies such as those of Akhigbe and McNulty (2003),
Berger and De Young (1997), Cuesta and Orea (2002), De Young and Hasan (1998), Drake and Hall (2003), Hasan and Marton (2003), Lang and Welzel (1996), Resti (1997), Stiroh (2000) and
Vennet (2002), researchers used non-interest income (measured by total of revenues from net commissions and fees, and other non-interest operating revenues), as a variable approximating for non traditional bank operations. Moreover, Vennet (2002), Cuesta and Orea (2002) and Rogers (1998) highly recommend the inclusion of this variable as a non-traditional banking output and suggest that traditional specifications tend to underestimate the measured efficiency of banks.
METHODOLOGY
To measure the efficiency of commercial banks in our sample, we adopt Data Envelopment Approach. The main advantage of this method is that it does not require a priori knowledge of the functional form of the production function and the structure of error terms or inefficiency (Avkiran, 1999; Wheelock and Wilson, 1999; Sathye, 2001; Lozano et al., 2002; Isik and Hassan, 2003;
Obafemi, 2012). However, it has the disadvantage of not taking into account the existence of measurement errors or data.
DEA is a nonparametric technique for measuring efficiency that is extremely flexible in modeling the production technology of a sample in a multi-inputs and multi-outputs framework. It doesn't impose a functional form or an error structure on data and uses linear programming to construct a production frontier with a linear convex form. This frontier envelops the data so that no observed point is situated on the left or below it. Thus, the DEA frontier is the set of efficient observations ensuring that no unit or linear combination of production units can use less input to produce the same amount of outputs, or can generate more outputs without altering the quantities of used inputs. DEA oriented in input allows us to determine the inputs saving that can be achieved for each unit of the sample if it was as efficient as the firm of best practices (ie located on the frontier).
Data Envelopment Analysis Approach (DEA)
suggested by Banker et al. (1984). In the model of Charnes et al. (1978), with an inputs oriented view, the construction of an efficiency frontier from a set of observations leads to solving a sequence of linear programs. In fact, for each of the n firms (or observations), this program is:
z
Min
y
x
K
,)
,
(
(1) Subject toY
z
y
.
X
z
x
.
z= (z1 ,z2,...,zn )
(0,0,...,0)where y = (y1, y2, ..., yq) is the row vector of observed outputs produced by a particular firm, and x
= (x1, x2, ..., xp) is the row vector of inputs used by the firm. The (nq) matrix of observed inputs
for all firms is denoted Y. The (np) matrix of observed inputs for all firms is denoted by X. K (x, y) indicates the overall technical efficiency of the ith firm as measured by the obtained value of.. Here indicates the fraction by which a firm can contract its inputs while continuing to produce outputs in quantities of at least equal to current levels. must be less than or equal to unity, with a value of 1 indicating a firm located on the efficiency frontier and therefore is technically efficient. z is a vector of intensity weights attached to each of the n observations. Coelli et al. (2005) suggest that the production technology associated with the program (1) can define according to Färe et al.
(1994) a closed and convex set of production which admits constant returns to scale and strong disposability of inputs. The alteration of the constraint on the intensity vector z can permit to build production frontiers that satisfy various assumptions such as variable returns to scale found in the model of Banker et al. (1984). The following linear programming problem has to be solved in the case of variable returns to scale and leads to pure technical efficiency scores:
z
Min
y
x
T
,)
,
(
(2)Subject to
Y
z
y
.
X
z
x
.
1
1
n i iz
z= (z1 ,z2,...,zn )
(0,0,...,0)of linear programming problems with and without the constraint of constant returns to scale, and is written as follows:
)
,
(
)
,
(
)
,
(
y
x
T
y
x
K
y
x
S
(3)And so:
)
,
(
).
,
(
)
,
(
x
y
S
x
y
T
x
y
K
(4)The overall technical efficiency is therefore partly due to scale efficiency of and partly to pure technical efficiency. A value of S (x, y) equal to unity would indicate scale efficiency.
Data
The sample included in this study is composed of 402 commercial banks belonging to 15 developing countries over the period 2000-2003, making a total of 1608 bank-observations. All data used on individual banks are obtained from Bankscope, a financial database distributed by IBCA - Bureau Van Dijk. For this sample, all monetary values are expressed in U.S. dollars and were reduced to constant 2000 prices using the GDP deflator relative to each country as published in The International Financial Statistics. Our sample is divided according to the average total assets criterion in four size classes. In this subdivision, we have considered a representative number of observations for each of the four following size classes:
Class1: Very small banks: Banks with total average assets less than 300 million U.S. dollars.
Class 2: Small banks: Banks with total average assets between $ 300 millions and $ 1.3 billions of U.S. dollars;
Class 3: Medium sized Banks: Banks with total average assets between 1.3 billion and 5 billions of U.S. dollars;
Class 4: Large banks: Banks with total average assets greater than 5 billions of U.S. dollars.
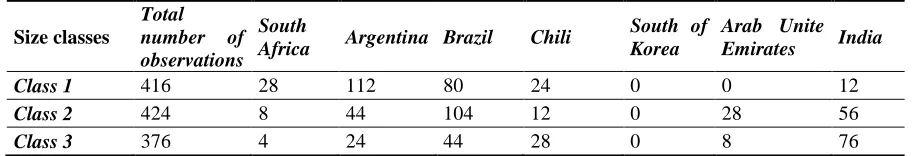
Table (1) provides a description of our sample's observations classified by country and size class. All size classes are almost equally represented in our sample, which eliminates any bias in the results from the dominance of one class by another.
Table-1. Observations by country and by size class
Size classes
Total number of observations
South
Africa Argentina Brazil Chili
South of Korea
Arab Unite Emirates India
Class 1 416 28 112 80 24 0 0 12
Class 2 424 8 44 104 12 0 28 56
Class 4 392 16 20 56 16 60 20 72
Total 1608 56 200 284 80 60 56 216
Size classes Indonesia Lebanon Malaysia Morocco Philippine Thailand Tunisia Turkey
Class 1 68 48 4 0 28 0 0 12
Class 2 40 40 28 0 28 8 20 8
Class 3 28 36 32 20 20 12 20 24
Class 4 8 4 40 8 4 36 0 32
Total 144 128 104 28 80 56 40 76
Source: Auteur
Selection of Input and Output Variables
Based on the analysis presented above and aiming to examine the sensibility of estimated efficiency scores to alternative methods of measuring banking activity, this study focuses on two major approaches: the intermediation approach and the value added approach.
Our first model (DEA-A Model) is based on the intermediation approach as proposed by Sealey and Lindley (1977). Banks are considered as funds intermediates between savers and investors. Banks produce intermediation services through the collection of deposits and other liabilities and their allocation to different interest producing assets such as loans, securities and other investments. In the DEA-A model, we use the outputs Y1: loans, Y2: other paying assets. The considered inputs are X1: work, X2: physical capital and X3: borrowed funds. To test the value added approach, we compare the results provided by this model with those of a second model considering deposits as a further output in addition to all previously selected outputs (DEA- B Model). So, we retain in the DEA-B model, in addition to the outputs already defined Y1 and Y2, the output Y3: deposits, and as inputs X1, X2 and X3.
Moreover, in order to take into account non-traditional banking activity, two alternative models are also tested. In these models, we include as additional output the variable Y4: non-interest income. It is added to the basic outputs (Y1: loans and Y2: other paying assets) in the intermediation approach (to have DEA-C model) and considering also the output Y3: deposits in the value-added approach (to have DEA-D model). Input and output variables involved in the tested models are described in the table (2). Their descriptive statistics are reported in table (3).
Table-2. Inputs and outputs variables
Variables Definitions
Inputs - X1 : Work
- X2 : Capital
- X3 : Borrowed funds
- Total of labor expenses
- Total of fixed assets
Outputs
- Y1 : Loans
- Y2 : Other paying assets
-Y3 : Deposits (in the value added approach)
- Y4 : Non-interest income
- Total of short term and medium-term loans
- Total of investments in securities and other revenue generating bank assets.
- Total of checking accounts and time and saving deposits
- Non-interest revenues provided from services charges oh loans and transactions, income from renting an fiduciary activities, commissions and other operating income
Table-3. Descriptive statistics of inputs and outputs variables (2000-2003)*
Y1 Y2 Y3 Y4 X1 X2 X3
2000-2003
Mean 2396143 1928360 3422196 1155615 65669 92779 3089256 Median 433505 412340 688313 557502 15208 16863 818776 Standard deviation 6681665 4230920 8033991 1359381 165080 212942 6179755 Year 2000
Mean 1785726 1543991 2663400 696865 59000 77047 2534480 Median 367562 378304 567051 723025 12199 15136 699288 Standard deviation 3916723 3298910 5657060 190441 156456 168768 4872757 Year 2001
Mean 2047621 1751789 2970924 3413105 60301 85605 2740014 Median 405053 398440 689685 3644046 13332 16463 802260 Standard deviation 5333904 3802246 6997684 581006 151302 191594 5299447 Year 2002
Mean 2541399 1915267 3561994 328066 62092 95210 3050154 Median 441752 404355 679527 283820 15706 16613 767943 Standard deviation 7467408 4023525 8626953 163565 143001 221717 5902402 Year 2003
Mean 3209827 2502392 4492466 184426 81283 113256 4032376 Median 563238 514663 934233 102977 19122 19885 1020406 Standard deviation 8841889 5449599 10065754 229888 202630 258149 8065537 * Values are expressed in thousands of U.S. dollars.
RESULTS
variables. More precisely, we examine the results provided by the intermediation approach versus those generated by the value-added approach and test for the impact of the introduction of banking non-traditional activity.
The Overall Technical Efficiency
The results about the overall technical efficiency estimates for our sample of developing countries banks are presented in the panel A of Table (4). Their observation can lead to the following key findings. First, on the 2000-2003 period, the overall technical efficiency of our sample banks generated by the built frontiers is comprised between 33% and 53,7% depending on size and selected model. A value of one indicates an efficient use of inputs, that is to say, the current inputs are at the minimum feasible level that lets to produce the actual outputs. So, the banks in our sample could produce the same level of outputs with approximately 46 to 67% fewer resources than those currently employed.
Moreover, we note that the introduction of non-traditional activities as additional output has no effect on measures of overall technical performance of banks in classes 3 and 4. This effect seems to be obvious for the small banks (class 1 and class 2 but in lesser magnitudes). Indeed, taking into account income from non-traditional activities in the outputs of banks in developing countries of our sample has increased the overall average technical efficiency over the period 2000-2003 for banks belonging to class 1 of 32 4%, with the intermediation approach and 28.2% with the value added approach. These increases were respectively of 18.4% and 1.7% for class 2 banks and are near to zero for larger banks. To test whether the differences observed by the introduction of non-traditional activities are significant, we proceeded to the non parametric individual statistical test of Wilcoxon (Table (5). The Wilcoxon test was recommended by Cooper et al. (2007)to statistically test the differences between two groups in terms of efficiency. According to the authors, the non-parametric statistics are appropriate in this case because "the theoretical distribution of efficiency scores with the DEA method is generally unknown" (P. 233).
Our results confirm the study of Isik and Hassan (2003), suggesting that the exclusion of non-traditional activities may result in distortions in efficiency measures especially against banks that are most active in this type of transactions. The same nonparametric test of Wilcoxon was conducted to test the significance of differences between the scores obtained with the intermediation approach and the value added approach successively without the additional output Y4 (for non-traditional activities) and with it (Table (5). This led us to compare the scores of DEA-A model to those of the DEDEA-A-B model (in the absence of Y4) and scores of DEDEA-A-C model to scores of DEA-D model (in the presence of Y4). The test results indicate that the differences are significant for all size classes at a confidence level of 1%. The improvement of overall technical efficiency levels for all categories of banks is then considered significant, when deposits are introduced into the banking outputs as suggested by the value added approach. Indeed, the passage from an intermediation approach to a value-added approach has increased the average overall technical efficiency over the entire period for classes 1 to 4, respectively of 14.8%, 16.4%, 19% and 14.5%, in the absence of Y4. In the presence of Y4, this increase is respectively of 11.2%, 16.1%, 18.7% and 14.5% for these classes. Thus, we can say that although the choice of one approach of measuring banking activity may alter the estimated levels of technical efficiency, it doesn't seem that this choice would favor one class size compared to another or deepen the gaps already identified in their performance levels.
Table-5. Tests of the impact of differences in treatment methods on efficiency estimates* Models using intermediation
versus models using value added approaches
Models with versus models without the introduction of non-traditional activities output (Y4)
Without Y4
(A/B) With Y4 (C/D)
Intermediation approach (A/C)
Value added approach (B/D) Class 1
ETG 3,179 (0,002) 3,067 (0,002) 7,185 (0,000) 6,672 (0,000)
ETP 3,06 (0,002) 0,339 (0,019) 3,994 (0,000) 3,433 (0,001)
EECH 0,740 (0,459) 1,251 (0,211) 10,759 (0,000) 12,118 (0,000) Class 2
ETG 5,517 (0,000) 5,505 (0,000) 0,883 (0,377) 0,733 (0,463)
ETP 5,224 (0,000) 3,205 (0,001) 4,114 (0,000) 2,444 (0,14)
EECH 0,581 (0,561) 5,033 (0,000) 7,433 (0,000) 2,753 (0,006) Class 3
ETG 5,978 (0,000) 5,964) (0,000) 0,046 (0,963) 0,026 (0,979)
EECH 1,006 (0,314) 4,692 (0,000) 9,424 (0,000) 6,440 (0,000) Class 4
ETG 5,110 (0,000) 5,106 (0,000) 0,005 (0,996) 0,005 (0,996)
ETP 3,024 (0,003) 2,084 (0,037) 3,853 (0,000) 2,993 (0,003)
EECH 2,374 (0,018) 4,379 (0,000) 4,878 (0,000) 3,595 (0,000) Source : Author's calculations
* ETG, ETP and EECH indicate overall technical, pure technical and scale efficiencies, respectively.
It is provided for each test the value of the wilcoxon statistic and its significance level (between parentheses).
The Pure Technical and Scale Efficiencies
The results for the two components of overall technical efficiency, namely pure technical efficiency and scale efficiency are allocated respectively in panels B and C of Table (4). First, we can observe for all study years that pure technical inefficiency is the major source of overall technical inefficiency for all size classes of banks except for the largest ones.
significant for scale efficiency of banks belonging to class 1 (with and without the output Y4) and also for other size classes when the output Y4 is excluded. Inversely, the improvement that affects pure technical efficiency scores when moving from an intermediation approach to a value-added approach is significant for all size classes if we accept a significance level of the 5%. At a level of 1%, both approaches involve average levels of pure technical efficiency which are statistically equivalent for banks belonging to the two extreme classes (1 and 4) in the presence of Y4 in the outputs. Thus, it seems that in models neglecting the non-traditional activities, it is the scale efficiency that is the less sensitive to the choice of the measuring banking activity approach. However, when these activities are considered among the outputs, this choice can have a significant impact on the derived levels of technical efficiency for all banks sizes and those of scale efficiency of all banks except the smallest ones.
On the other hand, the largest banks show in all considered combinations of inputs and outputs pure technical efficiency average levels that are largely higher than banks of smaller sizes. Indeed, with DEA-C model and under the assumption of variable returns to scale, a bank from class 4, seems to have on the study period an average performance level that exceeds with 22 4% the class 1 bank average level. This gap is of 20.2% and 18.9% compared to banks from classes 2 and 3, respectively. Similarly, with DEA-D model and on the entire period, the differences between the average scores of pure technical efficiency of the class 4 banks and those of classes 1, 2 and 3 are of 22.1%, 19.3 % and 16.9%, respectively. Thus, it appears that the pure technical efficiency is monotonically increasing with the size of banks in developing countries, whatever the chosen model chosen and the adopted method of measuring banking activity.
inefficiency has resulted in very low levels of overall technical efficiency levels. It should be also noted that models without the output Y4 have resulted for class 3 banks in scale efficiency scores that approximate an average of 90%, while for class 1 banks, they are to around 76%. When Y4 is considered in the outputs, the average level of bank performance of class 1 finds an increase that exceeds the 16%. Then, the class 1 will be classified in terms of scale efficiency in the second range just after banks of class 2 and before those of class 3. We can thus conclude that the exclusion of non-traditional activities in nonparametric models of efficiency studies on developing countries banks may involve distortions that play particularly against the smallest banks.
CONCLUSION
By using a DEA non-parametric frontier approach on a sample of 402 commercial banks from various developing countries, the current study investigates the relationship between bank size and productive efficiency performance under different combinations of inputs and outputs banking. The results show low levels of overall technical inefficiency with a recorded average maximum approximating 54%. Overall, all specifications tested prove the existence of high technical inefficiency in banks of developing countries, implying an average waste of resources (inputs) that exceeds 46% of the current used levels while generating the same level of outputs. It was also demonstrated that the principal source of the waste in the majority of these banks is constituted by pure technical inefficiency and in smaller importance by scale inefficiency. This finding is found for banks of all size classes except for the category of the largest banks (class 4), for which the results indicate the highest levels of pure technical efficiency and the most serious problems of scale inefficiency. The study showed a monotonic increasing relationship between pure technical efficiency and size of banks in developing countries, whatever the model chosen and the adopted approach of measuring banking activity. However, relating to scale efficiency, it is the banks of the intermediate size (class 2) that appeared the most close to the optimal scale with an average level over the entire period between 88.6% and 97.3% depending on the model. The relationship between the inefficiency of scale and the size of banks seems to be U-shape with a maximum of inefficiency reached by class 4 banks. In addition, another main contribution of our study is to confront the efficiency scores generated by the two major approaches for measuring banking used in literature (the intermediation approach and the value added approach of the added value), and to test the impact on the results of the consideration of non-traditional activities among the banking outputs.
measures especially against banks that are most active in this type of transactions. We can infer that they are the smallest banks of our sample that seem to be the most involved in the non-interest income generating activities, which can be explained by a better specialization and/or by supply of differentiated services to their customers. Our results also indicate that the choice of an intermediation approach or a value added approach for measuring banking activity can significantly influence the generated average levels of technical efficiency, but scale efficiency estimates appeared to be less sensitive to this choice. However, it is demonstrated by our study that this choice can participate to favor a size class compared to another or to dig already observed gaps in their performance levels. Our data thus suggest that the examination of the relationship between size and productive efficiency performance of banks is generally weakly affected by the adoption of some approach to measuring banking activity.