Abstract
Huang, Weichun. Computational methods for identifying and characterizing the hu-man gene regulatory regions and cis-elements. (Under the direction of Bruce S. Weir)
The identication of functional regulatory regions and cis-elements is a preliminary step toward the reconstruction of gene regulatory networks. Comparative genomics has been demonstrated to be a powerful approach for motif discovery. However, the accurate align-ment of complex genomic sequences, especially those of mammalians, remains a computa-tional challenge. In chapter 2, we propose a novel pairwise alignment system, ACANA, to improve the alignment quality of genomic sequences. Compared with top competing align-ment tools, ACANA achieves better alignalign-ment quality in aligning divergent sequences for both local and global alignments. When applied to the upstream sequences of human-mouse orthologs, ACANA is able to reliably detect the conserved functional regions containing most cis-elements.
Statistical motif modeling is another fundamental computational approach for motif prediction in large genome sequence. In chapter 3, we introduce the mixture of optimized Markov models to reduce false motif discovery rate in large genomic sequences. Our model is not only able to incorporate most dependency information within a motif by optimizing the arrangement of motif positions, but also exible for adjusting model complexity limited by the size of training data. We implement the mixture model in our OMiMa system. Using OMiMa, we demonstrate that our model can improve motif prediction accuracy.
COMPUTATIONAL METHODS FOR IDENTIFYING AND CHARACTERIZING THE HUMAN GENE REGULATORY REGIONS
AND CIS-ELEMENTS
by
WEICHUN HUANG
A dissertation submitted to the Graduate Faculty of North Carolina State University
in partial fulllment of the requirements for the Degree of
Doctor of Philosophy
BIOINFORMATICS
Raleigh 2005
APPROVED BY:
William R. Atchley Leping Li
Jeffrey L. Thorne Russell D. Wolfinger
Bruce S. Weir
Biography
Acknowledgments
What a long and challenging journey it has been. Looking back, at the moment when I nished the last sentence of this dissertation, I was even amazed by myself that how I could tread through such a long journey lled with constant distractions, temptations, chaos, and dangerous pitfalls. However, this is impossible without the help, trust, encouragement, guidance, protection, and sacrices from many people to whom I would be grateful in all my life.
I'm especially grateful to my adviser, Dr. Bruce S. Weir, for his constant supports and guidances through the past years. I would also like to extend my deepest gratitude to the other members of my committee, Drs. William R. Atchley, Leping Li, Jerey L. Thorne, and Russell D. Wolnger for their valuable advice and suggestions. In addition, I want to thank RTI International, and National Institute of Environmental Health Sciences (NIEHS) for supporting my internships. In particular, I want to thank Drs. Leping Li, David M. Umbach, and Clarice R. Weinberg at Biostatistics Branch at NIEHS, for many benecial discussions and lectures. My special thanks go to all other people in Bioinformatics Research Center, especially, to our Genomic Program director, Dr. Barbara Sherry, and sta members Lisa Barefoot, Juliebeth Briseno, Debra Hibbard, and Alexandra Rogers, for all their wonderful help and supports.
Table of Contents
LIST OF TABLES ix
LIST OF FIGURES xi
LIST OF ALGORITHMS xiv
1 Review 1
Background . . . 2
Large-scale gene expression analysis . . . 4
Genome-wide location profiling . . . 4
Genome-wide DNase hypersensitivity analysis . . . 5
Model-based prediction . . . 6
Motif modeling . . . 8
Model selection . . . 10
Cross-species sequence comparison . . . 12
The choice of species . . . 13
Sequence alignment . . . 14
Criteria for dening CNS . . . 17
Do all CNS contain regulatory elements? . . . 20
Conclusions and future directions . . . 22
Bibliography . . . 26
2 Accurate Anchoring Alignment of Divergent Sequences 41 Abstract . . . 42
Introduction . . . 43
Results . . . 44
Outline of ACANA algorithm . . . 44
Evaluation of performance . . . 45
Evaluation on simulated sequences . . . 46
Assessment on real sequences . . . 47
Methods . . . 52
Algorithms . . . 52
Evaluation . . . 58
Acknowledgments . . . 60
Tables . . . 61
Figures . . . 62
Appendix: a short manual of ACANA . . . 70
Bibliography . . . 73
3 Optimized Mixed Markov Models for Motif Identification 77 Abstract . . . 78
Introduction . . . 79
Methods . . . 81
Mixed Markov models . . . 81
Motif dissection and Markov chain optimization . . . 83
Cross validation . . . 89
Results . . . 91
Eectiveness of DNJ method for optimization . . . 93
Splicing site recognition . . . 95
Identication of transcription factor binding sites . . . 98
Detection of protein domains . . . 100
Discussion . . . 101
Tables . . . 106
Figures . . . 110
Appendix . . . 124
Expansion of equation (3.1) and (3.2) . . . 124
Estimation of model parameters . . . 127
Usage of OMiMa . . . 128
Bibliography . . . 132
4 Computational Analysis of the Association Between Gene Func-tion and Regulatory Region ConservaFunc-tion 136 Abstract . . . 137
Introduction . . . 138
Materials and methods . . . 139
Ortholog collection and upstream sequence extraction . . . 139
Generating false orthologous pairs . . . 140
Sequence alignment and conserved region identication . . . 140
Gene and GO term association . . . 141
Association test . . . 141
Enrichment test . . . 142
Results . . . 143
Upstream sequence data . . . 143
Regulatory region conservation . . . 144
Association of gene function with upstream region conservation . . . 145
Top upstream conserved genes and functional categories . . . 146
TFBS map in upstream regions . . . 147
Discussion . . . 147
Variation of regulatory regions . . . 147
The central hub of gene regulatory networks . . . 148
Positive selection for catalytic enzymes . . . 149
Summary . . . 150
Tables . . . 151
Figures . . . 158
Appendix: supplementary materials . . . 168
List of Tables
1.1 Computational resources for regulatory element identication . . . 25
2.1 Statistics summary of CNS aligned by 3 alignment tools . . . 61
2.2 Summary of the dierences of CNS aligned by 3 alignment tools . . . 61
3.1 Optimized1st order Markov chains for 53 TFBS . . . 106
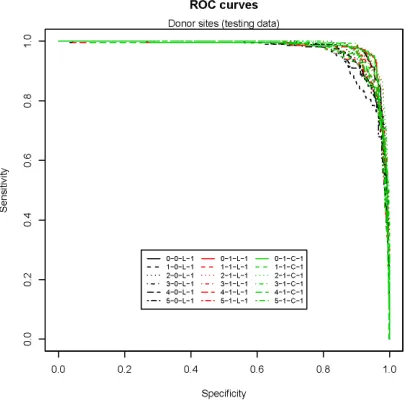
3.2 Comparison of NNSplice and OMiMa for donor site prediction . . . 107
3.3 Comparison of three dierent Markov models (log-likelihood) . . . 107
3.4 Comparison of three dierent Markov models (log-likelihood ratio) . . . 108
3.5 Identication of V$AP1_Q4_01 binding sites . . . 108
3.6 Identication of V$ATF_01 binding sites . . . 109
4.1 The data sets of human-rodent orthologous pairs . . . 151
4.2 The correlation of alignment scores between dierent upstream regions . . . . 151
4.3 Association between gene function and upstream region conservation of human-mouse orthologs . . . 152
4.4 Top 10 upstream conserved human-mouse orthologous genes . . . 156
4.5 GO categories of top 30 promoter conserved human-mouse orthologs . . . 157
List of Figures
2.1 Illustration of the simplied ACANA algorithm . . . 62
2.2 Constraint sensitivities of local alignment tools . . . 63
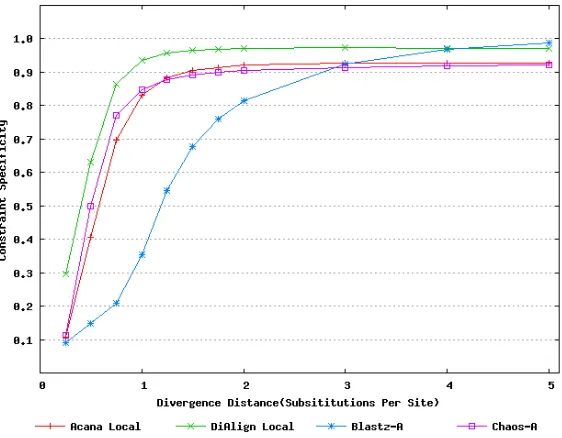
2.3 Constraint specicities of local alignment tools . . . 63
2.4 Constraint sensitivities of global alignment tools . . . 64
2.5 Constraint specicities of global alignment tools . . . 64
2.6 Overall alignment sensitivities of global alignment tools . . . 65
2.7 Coecients of Variation of local alignment tools . . . 65
2.8 Coecients of Variation of global alignment tools . . . 66
2.9 The relative TFBS sensitivities of ACANA(local) and CHAOS . . . 67
2.10 Location distribution of E2F binding sites . . . 68
2.11 Percent Identity Plots of global alignments . . . 69
3.1 A graphic representation of a mixture of Markov models . . . 110
3.2 The mixture of Markov models for TFBS . . . 111
3.3 The ranks of DNJ optimized 0-1 linear models . . . 112
3.4 The ranks of DNJ optimized 0-2 linear models . . . 112
3.5 The ranks of DNJ optimized 0-1 circular models . . . 113
3.6 The ranks of DNJ optimized 0-2 circular models . . . 113
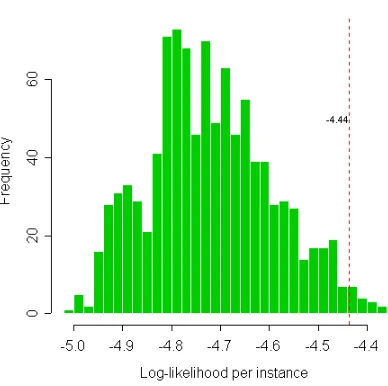
3.7 Histogram of likelihood per instance (0-1 linear models) . . . 114
3.9 Histogram of likelihood per instance (0-1 circular models) . . . 115
3.10 Histogram of likelihood per instance (0-2 circular models) . . . 115
3.11 Donor site prediction (training data) . . . 116
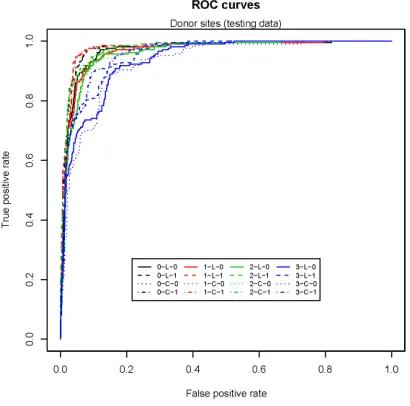
3.12 Donor site prediction (testing data) . . . 116
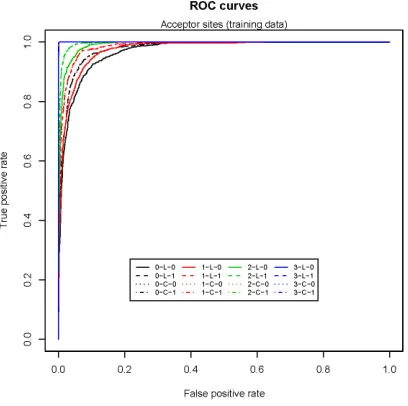
3.13 Acceptor site prediction (training data) . . . 117
3.14 Acceptor site prediction (testing data) . . . 117
3.15 Model selection for donor site by six-fold cross-validation . . . 118
3.16 Model selection for acceptor site by six-fold cross-validation . . . 118
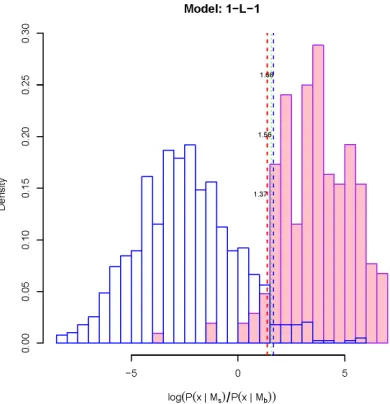
3.17 Donor site recognition (Model 1-L-1) . . . 119
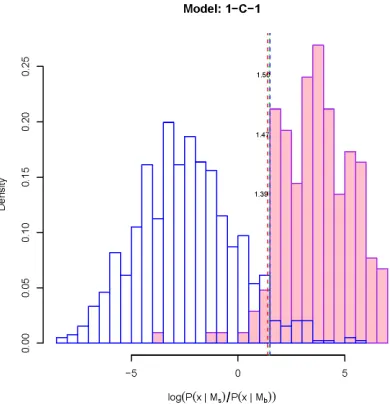
3.18 Donor site recognition (Model 1-C-1) . . . 120
3.19 Donor site recognition (NNSplice's neural network model) . . . 121
3.20 The score (log-likelihood) distribution of TFBS V$AP1_Q4_01 . . . 122
3.21 The score (log-likelihood ratio) distribution of TFBS V$AP1_Q4_01 . . . . 123
3.22 The logo of human RNA 3' splicing site (donor site) . . . 130
3.23 The logo of human TFBS V$AP1_Q4_01 . . . 130
3.24 The logo of human TFBS V$ATF_01 . . . 131
4.1 The distribution of local alignment scores of human-mouse orthologous se-quences . . . 158
4.2 The length distribution of the conserved regulatory regions in the human-mouse orthologs . . . 159
4.3 The alignment score plot: 2500-1000 vs 1000 . . . 160
4.4 The alignment score plot: 5000-1000 vs 1000 . . . 161
4.5 Comparison of the alignment score distributions of false and true human-mouse orthologs . . . 162
List of Algorithms
Chapter 1
Background
The genetic programs controlling cell dierential and embryonic development are long be-lieved to be hardwired in the genomic sequence of an organism (Davidson et al., 2002b). The hardware underlying the genetic program are Gene Regulatory Networks (GRN) that precisely regulate gene expression in both spatial and temporal dimensions. Reconstructing GRN to understand gene expression regulation is one of the greatest challenges in mod-ern molecular biology. An important step in this challenge is the ability to identify all cis-regulatory elements, notably transcription factor binding sites (TFBS) in the anking non-coding regions of genes. The binding of transcription factors to specic cis-regulatory elements, typically those in upstream region of the Transcriptional Start Site (TSS) of a gene, is a primary mechanism for regulating gene transcription from DNA to mRNA. Although regulation of gene expression can occur at any point from DNA to protein, the transcrip-tional regulation is the central control step for many genes. While prokaryotes often use no more than a few transcription factors and cis-elements to regulate a gene transcription, eukaryotic gene transcription often involves the coordination of multiple transcription fac-tors, whose binding sites are spatially clustered and form so-called Cis-Regulatory Modules (CRM). The increasing complexity of regulatory element modular architecture is likely to be the major factor responsible for the more versatile and robust regulatory networks in higher eukaryotes than those in lower eukaryotes and prokaryotes (Kirschner and Gerhart, 1998; Locascio et al., 2002; Lynch and Conery, 2003). Such a coordinated modulation mecha-nism eectively integrates many dierent signaling pathways to provide much more complex regulation networks found in higher eukaryotic organisms.
for whole genome sequences, genome-wide transcriptional proling and location analysis, and other large-scale assessment of gene expression, in addition to the advances in develop-ment of statistical methods and computational tools, provide unprecedented resources and oer the promise of unraveling complex gene networks. Much progress has been made so far. For example, transcription regulation modules have been elegantly mapped genome-wide for Drosophila (Berman et al., 2002) and yeast (Vilo et al., 2000; Pilpel et al., 2001). Many, if not most, of regulatory elements in the yeast genome have been computationally and experimentally identied (Kellis et al., 2003; Doniger et al., 2005). Moreover, the networks involved in sea urchin endomesoderm specication have been comprehensively described and experimentally veried (Davidson et al., 2002a; Oliveri and Davidson, 2004). Genome se-quence comparison of multiple mammals of dierent evolutionary distances has enabled the identication of many ultra-conserved elements involved in regulating developmental process (Bejerano et al., 2004). Despite these advances, we're facing many challenges in deciphering gene regulatory networks. For example, one of many challenges for computational biolo-gists is to integrate and mine the exponentially increasing biological data, such as genome sequences and gene expression data. The ability to eciently integrating large varieties of biological data is essential for decoding genomic languages.
Large-scale gene expression analysis
The mature technology of microarray makes it possible to study large-scale gene expression. A typical approach for regulatory element identication is to apply clustering algorithms to genome-wide expression data to nd sets of co-expressed genes that are also potentially co-regulated (Eisen et al., 1998), then search upstream sequences of these genes to identify statistically over-represented common regulatory motifs (Zhang, 1999; Caselle et al., 2002; Sui et al., 2005). An underlying assumption of this approach is that the co-regulated genes have a similar expression pattern. This approach has been extended to identify regulatory modules and their condition-specic regulators of the co-regulated genes by using a more sophisticated algorithm (Segal et al., 2003). The algorithm makes additional assumption that the expression level of regulated genes will depend on the expression levels of regulators, which is a limitation in cases that the expression level of the regulator does not change appropriately (e.g., regulator is activated by post-transcriptional modication). The analysis of expression data also has been combined with other available information, such as shared DNA binding motifs and protein sequence categories, to identify gene regulatory modules (Pilpel et al., 2001; Ihmels et al., 2002; Berman et al., 2002).
Genome-wide location proling
500 kb) by sonication. Third, the DNA fragments cross-linked to a protein of interest are
enriched by immunoprecipitation with a specic antibody. Fourth, reversing the cross-links of immunoprecipitated DNA and protein complex, the enriched and puried DNA then are amplied and labeled with a uorescent dye (Cy5) by ligation-mediated-polymerase chain reaction (LM-PCR). As a control, an aliquot of the input chromatin DNA is processed us-ing an identical procedure except a dierent uorophore (Cy3) is used for DNA labelus-ing. Both labeled DNA samples and controls are hybridized simultaneously to a single DNA microarray containing genomic DNA sequences. The enriched protein-DNA binding regions are identied as DNA spots in which there is signicantly more uorescence intensity with ChIP-enriched DNA than with the control input DNA.
Genome-wide location analysis has been successfully used to identify transcription factor binding sites in yeast genomes (Lieb et al., 2001; Lee et al., 2002; Liu et al., 2005) as well as in mammalian genomes (Ren et al., 2000). However, this procedure, which can only map the protein-DNA interaction loci within 1-2kb, does not yet have the resolution
to discriminate precise cis-regulatory elements, and cannot yet be readily applied to the entire human genome because of its large size (Weinmann et al., 2002). Using location analysis data, some computational algorithms have been developed to improved accuracy and resolution of TFBS identication (Liu et al., 2002; Garten et al., 2005). Furthermore, the accuracy of cis-regulatory module prediction can be improved by using information from both DNA-binding data of location analysis and gene expression proles (Bar-Joseph et al., 2003).
Genome-wide DNase hypersensitivity analysis
gold-standard experimental method for identifying gene regulatory elements. For example, the traditional method was used to detect the enhancer elements of epsilon-globin gene (Zaret and Yamamoto, 1984) and glucocorticoid-dependent regulatory elements (Tuan and London, 1984). This approach has the advantage of taking chromatin context into account by di-gesting nucleosome-free regions of the genome, allowing for identication of both ubiquitous and tissue-specic regulatory elements. However, this procedure is technically demanding and thus has not been previously considered applicable on a genome-wide scale until the last couple of years (Lu and Richardson, 2004). So far, Genome-wide DNase hypersensitive site mapping has been successfully used to identify active regulatory regions in human erythroid cells (Sabo et al., 2004) and CD4(+) T cells (Crawford et al., 2004).
Model-based prediction
TRED (Zhao et al., 2005) for mammalian regulatory elements, JASPAR (Sandelin et al., 2004) for matrix-based TFBS proles of multicellular eukaryotes. However, it has proved to be dicult to accurately predict all functional sites in genomic sequences, particularly those of mammalian, as all model-based approaches, at present, suer from the high false positive rate problem (Pennacchio and Rubin, 2001). Nevertheless, with completion of genome se-quencing of many species, and the increasing number of experimentally veried functional sites, model-based prediction has become the most ecient computational approach for genome-wide motif identication.
Motif modeling
et al., 2002) indicate that there are important interactions or correlations between adjacent positions as well as non-adjacent positions within a motif in many cases. The inability of a PWM to capture such dependency information has limited its power to nd true motif sites. In the past few years, many models have been developed to incorporate such dependency information of positions. Motif models such as Dinucleotide Weight Matrix model (DWM) (Schneider et al., 1986), Weight Array Model(WAM) (Zhang and Marr, 1993), can incor-porate dependencies between adjacent positions. To incorincor-porate further dependencies of non-adjacent positions, Ponomarenko et al. (1999) extended DWM by introducing Oligonu-cleotide Weight Matrices model, which includes a comprehensive set of oligonuOligonu-cleotide ma-trices classied into 5 biological function categories. In principle, a WAM model could also be extended to high-order WAM, e.g. windowed second order WAM (Burge and Karlin, 1997). However, the exponentially increased number of parameters of these models makes it dicult to use them practically due to insucient training data. To address the weaknesses of WAM in incorporating long-ranging interactions, Burge and Karlin (1997) proposed the Maximal Dependence Decomposition (MDD) model, which has binary tree structure formed by a set of conditional WAM models. While MDD model can capture non-adjacent depen-dencies through the conditional WAM models, it still requires a rather large number of training sequences, which are partitioned into smaller sub-sets to train all conditional WAM models. The idea of MDD is quite smart and its procedure is very similar to the recursive partitioning procedure for multiple variable analysis. First, a consensus is obtained from the original training set; then for each base Ci in the consensus, its dependencies on each base
Xj (i6=j) are calculated by Chi-Square statistics. The sum (Si) of Chi-Square statistics is used as a measure of total dependency ofCion other positions. ChoosingCiwith maximum
undividable, i.e., it has reached bottom level of the tree. (2) No signicant dependency detected. (3) Reach the minimum number of sequences required to train model parameters. So each node in binary tree is a subset of the original training set, which is the root of tree. A series of WAM models are derived, one WAM model for each subset of training sequences. According to the path from root to leaf traveled by a sequence, the probability or logarithm of probability of the sequence given the motif model can be calculated. While MDD model can capture non-adjacent dependencies through the conditional WAM models, it requires a big training data, which can be partitioned into smaller but still adequate to properly train each conditional WAM model. To alleviate the requirement of a large training set, Cai et al. (2000) developed a Bayesian tree to model dependencies within RNA splicing sites; Ell-rott et al. (2002) suggested a position-order optimized Markov chain model, which reorders motif positions to bring long-ranging dependent positions into the near neighbors. More recently, several other models have been developed, including Bayesian networks for model-ing protein-DNA bindmodel-ing sites (Barash et al., 2003), Maximum Entropy Model (MEM) for splicing site identication (Yeo and Burge, 2003), Permuted Variable Length Markov Model (PVLMM) for nding TFBS and splicing sites (Zhao et al., 2004). While these models were proved to perform well for motif identication in some specic cases, it seems that there is still some room to improve.
Model selection
Cross-species sequence comparison
Phylogenetic footprinting based on comparative genomics analysis has been demonstrated to be the most eective approach to identifying functional regulatory elements (Ureta-Vidal et al., 2003; Thomas et al., 2003). The evolutionary assumptions underlying such compar-ative analysis are: 1) mutations in functionally important genomic regions will
accumu-late more slowly due to negative selection forces than mutations in the regions subjected to neutral evolution or positive selection. 2) Genomic sequences under comparison are
of conserved regions, and so on. We select some of these problems to discuss below.
The choice of species
Sequence alignment
of xed length as seeds. In second step, the seeds are extended in both directions to nd local similar regions above a certain threshold. These similar regions are used as anchoring regions for global alignment if needed. Third, a dynamic programming-based algorithm is used to align sequence segments between anchoring regions. The detailed implements of three steps can be dierent among dierent alignment tools. The following three techniques, whose underlying principle is to increase the number of hit in actual homologous sequences while reducing the expect number of hit in random sequences, are generally employed by these tools to improve alignment sensitivity without compromising specicity:
1. Reduce the length of exact matching words, but requiring to match two words within a xed distance instead of a single word in initial seeds searching. This technique is used by local aligning tools WU-BLAST, BLAT, and BLASTZ.
2. Look for highly similar words that allow a certain degree of degenerative instead of exact identical words. This technique is employed by CHAOS.
3. Use a non-consecutive searching model that has the same weight as the original con-secutive model, e.g., BLAST uses the 11-base concon-secutive model 11111111111, while patternHunter employs 18-base non-consecutive model 1110100101001110111 (1 in-dicating match, 0 inin-dicating don't care") with the same weight 11 of the BLAST consecutive model. This technique was rst deployed in PatternHunter, and was also implemented in BLASTZ.
sequences. The idea of this method is to calculate parsimony score of all k-mer substring according to a given phylogenetic tree of related species, and then output a set of k-mers with the lowest parsimony scores, in which parameter k and threshold of parsimony score are dened in advance. If several k-mers are overlapping in each of original sequences, they are merged to form a bigger conserved block. The method was implemented in a dynamic programming-based program called FootPrinter (Blanchette et al., 2002; Blanchette and Tompa, 2003). FootPrinter is much like the local alignment tools such as BLAST with respect to nding conserved blocks. The major dierence is score schemes. BLAST or SSearch uses general score matrices such as BLOSUM matrices or PAM matrices, while FootPrinter uses parsimony scores based on a phylogenetic tree of related species, which make more sense if the included species have dierent relationships and divergent times. While FootPrinter can nd all similar blocks as other local alignment tools, some of which may not be found in global alignment due to inaccurate alignment. It will be dicult to assess whether the similar blocks are real conserved blocks because there are possible random match, particularly for short substrings. In this sense, this method may have much high false positive rate than those based on global alignment though increasing the number of orthologous sequences may increase its power. Nevertheless, FootPrinter provides a nice alternative approach for footprinting. Also its idea of dening CNS using parsimony score makes more sense than the other criteria we will discuss below.
developed heuristic-based tools, such as, AVID, LAGAN, and BLASTZ, are able to e-ciently perform pairwise genome alignment, their alignment qualities are still questionable about whether they are good enough to identify most functional important genomic regions. Computational biologists are facing a dilemma about whether continue to focus on develop-ing new index-based ecient alignment tools or pay more attention to the slower but more accurate dynamic programming algorithm-based tools. Further signicant improvement of alignment tools would rely on more understanding of the underlying evolutionary mechanism of biological organism.
Criteria for dening CNS
The criteria of CNS need to be dened before any CNS can be identied in phylogenetic footprinting analysis. It is an important question about how should we dene CNS as dierent criteria are likely to produce dierent results. Ideally CNS should include all conserved functional binding sites and exclude all non-functional sites. In reality, the CNS is dened arbitrarily based on some observed regulatory region or functional sites, such as Locus Control Region (LCR) of globin, conserved regulatory regions neighboring interleukin genes (IL-4, IL-5, and IL-13) in human chromosome 5, both of which have been well studied and functionally characterized. Some commonly used criteria are: 1) No gap segment; 2)
Percent identity within dened window size in aligned orthologous sequence is larger than an arbitrarily dened cuto value that is larger than expected from neutrally evolved sequences;
3)Contiguous segments satisfying the above 2 conditions are merged together to form larger
values should be used. Using cuto of more than 70% identity over at least 50 bps, Duret and Bucher (1997) showed that only 16% orthologous gene pairs have CNS in regulatory regions. Most of state-of-art tools to visualize and identify CNS are based on these cuto values, such as VISTA (Mayor et al., 2000), PipMaker (Schwartz et al., 2000). The drawback is that these cuto values are chosen too arbitrarily, usually based on common biological sense or rule of thumb. Through incorporating information of genome sequences of three species, human, mouse, and dog, Dubchak et al. (2000) suggested a better criterion to dene CNS of human, which maximize the sum of all pairwise Intersection/Union (I/U) values, the ratio between the common CNS regions of three species and all CNS regions obtained from one species compared with two other species separately. The I/U analysis method is to choose conserved noncoding regions that maximize number of overlapping regions, and minimize number of unique regions among dierent species. Based on 200 kb orthologous sequences human (5q31), mouse (chromosome 11), and dog (chromosome 4), the sum of three I/U values is maximized at the following criteria: Human/Dog, 92% identity over 120
bp; Human/Mouse, 80% identity over 120 bp; and Mouse/Dog, 77% identity over 120 bp.
However, it remains a question whether cuto values chosen by the I/U method are better than those chosen arbitrarily or by other methods.
Castresana (2000) suggested a dierent method to a cuto-value based criterion. The method was implemented in a program called Gblocks. Basically, this method searches for conserved blocks from aligned orthologous sequences that meet a set of requirements. It denes a total of ve arbitrary thresholds, IS, FS, CP, BL1 and BL2, in the set of requirements, and proceeds step by step in the following order to identify conserved block in alignment: 1) Each position is classied into one of three classes, non-conserved (percent identity < IS or there is a gap), conserved (percent identity≥IS but < FS), highly conserved
(percent identity ≥ FS). The default values of IS and FS in Gblocks are 50% and 80%,
rejected, in which alignment is likely ambiguous. The default value of CP is 8 positions. 3) Positions that are not highly conserved as dened in step 1 are removed from the anks of all remaining blocks, so each block is surrounded by highly conserved franks. 4) Small blocks with length less than BL1 positions are rejected. The default value of BL1 is 15 positions. 5) All non-conserved positions adjacent to gaps (include gaps) are eliminated. 6) Only blocks with length larger than BL2 positions after gap cleaning are dened as conserved blocks. The original purpose of the method in the paper is to select conserved blocks thus with high condent in their alignment for phylogenetic tree reconstruction, but it can be applied to footprinting analysis with a little modication. The disadvantages of above methods are: 1) they are highly dependent on accurate alignment of orthologous sequences, which itself is a very dicult problem, particularly, a good alignment for divergent sequences is very dicult to obtain. 2) It may be dicult to obtain optimal values for the cuto thresholds of parameters interested. For comparison of multiple species, additional information such as evolutionary distances and phylogenetic relationships between species can be used to more accurately identify regulatory elements or CNS.
Do all CNS contain regulatory elements?
highly conserved binding sites, which may have a radical eect on expression of genes, it makes other newly evolved or less conserved binding sites undetectable. On the other hand, comparisons of more closely related species are confounded by non-functional but low di-vergence sequences, which will result in high proportion non-functional sites in conserved regions identied. Therefore, in reality we should consider not only false positive rate, but also false negative rate in identifying functional conserved regions.
non-coding regions from known data, we could roughly estimate proportion of non-functional sites in conserved regions.
The power of footprinting
Although there are still some limitations of phylogenetic footprinting approach to identify regulatory elements, it oers many advantages over single genome approach. One important advantage is that it not only dramatically reduces false positive binding sites of single genome approach, but also has more power to detect or discover binding site over many single genome methods (Wasserman et al., 2000; Levy and Hannenhalli, 2002; Cliften et al., 2003; Kellis et al., 2003; Zhang and Gerstein, 2003). For example, in performance comparison of three computational methods for identifying human TFBS, Levy and Hannenhalli (2002) showed that specicity of the method based on footprinting of human and mouse is up to three-fold higher than the other two single genome methods, both of which are based on score of position weight matrices of motifs but with dierent ltering methods, the p-values of motif scores and modular clustering of motifs. Zhang and Gerstein (2003) studied a larger set of human-mouse gene pairs by phylogenetic footprinting and compared the results predicted by ConSite with the previously veried regulatory sites (Lenhard et al., 2003). The result suggested that on average, phylogenetic footprinting improved the selectivity of TFBS prediction by 85% compared to using matrix models alone, and could detect the majority of veried sites. These studies demonstrated that comparative genomics is an eective and powerful method for identifying conserved functional sites in genomic sequences.
Conclusions and future directions
mo-tivated the development of many improved computational models and tools, which were demonstrated to be extremely valuable in deciphering gene regulatory networks. In partic-ular, computational analysis genomics sequences of related species has been proved to be a powerful approach for identifying regulatory elements, especially when combined with the other approaches (Wasserman et al., 2000; Boelli et al., 2003; Nardone et al., 2004). Despite these remarkable progresses, complete regulatory element identication and characterization in higher eukaryotes, particular human, remains a distant hope as too much unknown about the underlying mechanisms of sequence evolution and genome organization. Nevertheless, we are in the right direction, future work on the following emerging elds would certainly be helpful as we are facing the challenge.
Table 1.1: Computational resources for regulatory element identication
Name Authors Website
Sequence Alignment
DiAlign Morgenstern 1999 http://bibiserv.techfak.uni-bielefeld.de/dialign BLASTZ/PipMaker Schwartz et al. 2000 http://bio.cse.psu.edu
AVID Bray et al. 2003 http://baboon.math.berkeley.edu/mavid LAGAN Brudno et al. 2003 http://lagan.stanford.edu
Transcription Factor Binding Site database
TRANSFAC Wingender et al. 2000 http://www.gene-regulation.com/pub/databases.html PRODORIC Münch et al. 2003 http://prodoric.tu-bs.de
JASPAR Sandelin et al. 2004 http://jaspar.cgb.ki.se/cgi-bin/jaspar_db.pl
RegulonDB Salgado et al. 2004 http://www.cifn.unam.mx/Computational_Genomics/regulondb TRED Zhao et al. 2005 http://rulai.cshl.edu/TRED
Orthologous Gene Database
COGs Tatusov et al. 2003 http://www.ncbi.nlm.nih.gov/COG HOPS Storm and Sonnhammer 2003 http://pfam.cgb.ki.se/HOPS
HomoloGene Wheeler et al. 2004 http://www.ncbi.nlm.nih.gov/entrez/query.fcgi?DB=homologene
Motif Identication
MatInspector Quandt et al. 1995 http://www.genomatix.de/products/MatInspector Cister Frith et al. 2001 http://zlab.bu.edu/~mfrith/cister.shtml
eCis-analyst Berman2004 http://rana.lbl.gov/cis-analyst
MSCAN Alkema et al. 2004 http://tfscan.cgb.ki.se/cgi-bin/MSCAN
Motif Discovery
MEME Bailey and Elkan 1995 http://meme.sdsc.edu AlignACE Hughes et al. 2000 http://atlas.med.harvard.edu
YMF Sinha and Tompa 2003 http://bio.cs.washington.edu/software.html SeSiMCMC Favorov et al. 2005 http://favorov.imb.ac.ru/SeSiMCMC
Bibliography
Agarwal, P. and Bafna, V. (1998). Detecting non-adjoining correlations with signals in dna. In RECOMB '98: Proceedings of the second annual international conference on Computational molecular biology, pages 28, New York, NY, USA. ACM Press.
Alkema, W. B. L., Johansson, O., Lagergren, J., and Wasserman, W. W. (2004). MSCAN: identication of functional clusters of transcription factor binding sites. Nucleic Acids Res., 32(Web Server issue):W195W198.
Altschul, S. F., Gish, W., Miller, W., Myers, E. W., and Lipman, D. J. (1990). Basic local alignment search tool. J. Mol. Biol., 215(3):403410.
Altschul, S. F., Madden, T. L., Schäer, A. A., Zhang, J., Zhang, Z., Miller, W., and Lipman, D. J. (1997). Gapped BLAST and PSI-BLAST: a new generation of protein database search programs. Nucleic Acids Res., 25(17):33893402.
Aparicio, S., Chapman, J., Stupka, E., Putnam, N., Chia, J.-M., Dehal, P., Christoels, A., Rash, S., Hoon, S., Smit, A., Gelpke, M. D. S., Roach, J., Oh, T., Ho, I. Y., Wong, M., Detter, C., Verhoef, F., Predki, P., Tay, A., Lucas, S., Richardson, P., Smith, S. F., Clark, M. S., Edwards, Y. J. K., Doggett, N., Zharkikh, A., Tavtigian, S. V., Pruss, D., Barnstead, M., Evans, C., Baden, H., Powell, J., Glusman, G., Rowen, L., Hood, L., Tan, Y. H., Elgar, G., Hawkins, T., Venkatesh, B., Rokhsar, D., and Brenner, S. (2002). Whole-genome shotgun assembly and analysis of the genome of Fugu rubripes. Science, 297(5585):13011310.
Bailey, T. L. and Elkan, C. (1995). The value of prior knowledge in discovering motifs with MEME. Proc. Int. Conf. Intell. Syst. Mol. Biol., 3:2129.
Barash, Y., Elidan, G., Friedman, N., and Kaplan, T. (2003). Modeling dependencies in protein-dna binding sites. In RECOMB '03: Proceedings of the seventh annual interna-tional conference on Computainterna-tional molecular biology, pages 2837, New York, NY, USA. ACM Press.
Bejerano, G., Pheasant, M., Makunin, I., Stephen, S., Kent, W. J., Mattick, J. S., and Haus-sler, D. (2004). Ultraconserved elements in the human genome. Science, 304(5675):1321 1325.
Benos, P. V., Lapedes, A. S., Fields, D. S., and Stormo, G. D. (2001). SAMIE: statistical algorithm for modeling interaction energies. Pac. Symp. Biocomput., pages 115126.
Berman, B. P., Nibu, Y., Pfeier, B. D., Tomancak, P., Celniker, S. E., Levine, M., Rubin, G. M., and Eisen, M. B. (2002). Exploiting transcription factor binding site clustering to identify cis-regulatory modules involved in pattern formation in the Drosophila genome. PNAS, 99(2):757762.
Berman, B. P., Pfeier, B. D., Laverty, T. R., Salzberg, S. L., Rubin, G. M., Eisen, M. B., and Celniker, S. E. (2004). Computational identication of developmental enhancers: conser-vation and function of transcription factor binding-site clusters in Drosophila melanogaster and Drosophila pseudoobscura. Genome Biol., 5(9):R61.
Blanchette, M., Schwikowski, B., and Tompa, M. (2002). Algorithms for phylogenetic foot-printing. J. Comput. Biol., 9(2):211223.
Blanchette, M. and Tompa, M. (2002). Discovery of regulatory elements by a computational method for phylogenetic footprinting. Genome Res., 12:739748.
Blanchette, M. and Tompa, M. (2003). FootPrinter: A program designed for phylogenetic footprinting. Nucleic Acids Res., 31(13):38403842.
Bray, N., Dubchak, I., and Pachter, L. (2003). AVID: A global alignment program. Genome Res., 13(1):97102.
Bray, N. and Pachter, L. (2003). Mavid multiple alignment server. Nucleic Acids Res., 31:35253526.
Brudno, M., Do, C. B., Cooper, G. M., Kim, M. F., Davydov, E., Green, E. D., Sidow, A., and Batzoglou, S. (2003). LAGAN and Multi-LAGAN: ecient tools for large-scale multiple alignment of genomic DNA. Genome Res., 13(4):721731.
Buck, M. J. and Lieb, J. D. (2004). ChIP-chip: considerations for the design, analysis, and application of genome-wide chromatin immunoprecipitation experiments. Genomics, 83(3):349360.
Bulyk, M. L., Johnson, P. L. F., and Church, G. M. (2002). Nucleotides of transcription factor binding sites exert interdependent eects on the binding anities of transcription factors. Nucl. Acids Res., 30(5):12551261.
Burge, C. and Karlin, S. (1997). Prediction of complete gene structures in human genomic DNA. J. Mol. Biol., 268(1):7894.
Cai, D., Delcher, A., Kao, B., and Kasif, S. (2000). Modeling splice sites with Bayes networks. Bioinformatics, 16(2):152158.
Caselle, M., Cunto, F. D., and Provero, P. (2002). Correlating overrepresented upstream motifs to gene expression: a computational approach to regulatory element discovery in eukaryotes. BMC Bioinformatics, 3(1):7.
Castresana, J. (2000). Selection of conserved blocks from multiple alignments for their use in phylogenetic analysis. Mol. Biol. Evol., 17(4):540552.
Cliften, P., Sudarsanam, P., Desikan, A., Fulton, L., Fulton, B., Majors, J., Waterston, R., Cohen, B. A., and Johnston, M. (2003). Finding functional features in Saccharomyces genomes by phylogenetic footprinting. Science, 301(5629):7176.
Crawford, G. E., Holt, I. E., Mullikin, J. C., Tai, D., Blakesley, R., Bouard, G., Young, A., Masiello, C., Green, E. D., Wolfsberg, T. G., and Collins, F. S. (2004). From the Cover: Identifying gene regulatory elements by genome-wide recovery of DNase hypersensitive sites. PNAS, 101(4):992997.
Davidson, E. H., Rast, J. P., Oliveri, P., Ransick, A., Calestani, C., Yuh, C.-H., Minokawa, T., Amore, G., Hinman, V., Arenas-Mena, C., Otim, O., Brown, C. T., Livi, C. B., Lee, P. Y., Revilla, R., Rust, A. G., jun Pan, Z., Schilstra, M. J., Clarke, P. J. C., Arnone, M. I., Rowen, L., Cameron, R. A., McClay, D. R., Hood, L., and Bolouri, H. (2002a). A genomic regulatory network for development. Science, 295(5560):16691678.
Davidson, E. H., Rast, J. P., Oliveri, P., Ransick, A., Calestani, C., Yuh, C.-H., Minokawa, T., Amore, G., Hinman, V., Arenas-Mena, C., Otim, O., Brown, C. T., Livi, C. B., Lee, P. Y., Revilla, R., Schilstra, M. J., Clarke, P. J. C., Rust, A. G., Pan, Z., Arnone, M. I., Rowen, L., Cameron, R. A., McClay, D. R., Hood, L., and Bolouri, H. (2002b). A provisional regulatory gene network for specication of endomesoderm in the sea urchin embryo. Dev. Biol., 246(1):162190.
Day, W. H. and McMorris, F. R. (1992a). Critical comparison of consensus methods for molecular sequences. Nucleic Acids Res., 20(5):10931099.
Day, W. H. and McMorris, F. R. (1992b). Threshold consensus methods for molecular sequences. J. Theor. Biol., 159(4):481489.
Delcher, A. L., Phillippy, A., Carlton, J., and Salzberg, S. L. (2002). Fast algorithms for large-scale genome alignment and comparison. Nucleic Acids Res., 30(11):24782483.
in Mammalian gene regulatory regions: conservation and turnover. Mol. Biol. Evol., 19(7):11141121.
Dermitzakis, E. T., Reymond, A., and Antonarakis, S. E. (2005). Conserved non-genic sequences - an unexpected feature of mammalian genomes. Nat. Rev. Genet., 6(2):151 157.
Doniger, S. W., Huh, J., and Fay, J. C. (2005). Identication of functional transcription factor binding sites using closely related Saccharomyces species. Genome Res., 15(5):701 709.
Dubchak, I., Brudno, M., Loots, G. G., Pachter, L., Mayor, C., Rubin, E. M., and Frazer, K. A. (2000). Active conservation of noncoding sequences revealed by three-way species comparisons. Genome Res., 10:13041306.
Duret, L. and Bucher, P. (1997). Searching for regulatory elements in human noncoding sequences. Curr. Opin. Struct. Biol., 7(3):399406.
Eisen, M. B., Spellman, P. T., Brown, P. O., and Botstein, D. (1998). Cluster analysis and display of genome-wide expression patterns. PNAS, 95(25):1486314868.
Ellrott, K., Yang, C., Sladek, F. M., and Jiang, T. (2002). Identifying transcription factor binding sites through Markov chain optimization. Bioinformatics, 18 Suppl 2:S100S109.
Favorov, A. V., Gelfand, M. S., Gerasimova, A. V., Ravcheev, D. A., Mironov, A. A., and Makeev, V. J. (2005). A Gibbs sampler for identication of symmetrically struc-tured, spaced DNA motifs with improved estimation of the signal length. Bioinformatics, 21(10):22402245.
Fickett, J. W. and Wasserman, W. W. (2000). Discovery and modeling of transcriptional regulatory regions. Curr. Opin. Biotechnol., 11(1):1924.
Genomic DNA insertions and deletions occur frequently between humans and nonhuman primates. Genome Res., 13(3):341346.
Frith, M. C., Hansen, U., Spouge, J. L., and Weng, Z. (2004). Finding functional sequence elements by multiple local alignment. Nucleic Acids Res., 32(1):189200.
Frith, M. C., Hansen, U., and Weng, Z. (2001). Detection of cis-element clusters in higher eukaryotic DNA. Bioinformatics, 17(10):878889.
Garten, Y., Kaplan, S., and Pilpel, Y. (2005). Extraction of transcription regulatory signals from genome-wide DNA-protein interaction data. Nucl. Acids Res., 33(2):605615.
Gotoh, O. (1982). An improved algorithm for matching biological sequences. J. Mol. Biol., 162(3):705708.
Gross, D. S. and Garrard, W. T. (1988). Nuclease hypersensitive sites in chromatin. Annu. Rev. Biochem, 57:159197.
Gupta, M. and Liu, J. S. (2005). De novo cis-regulatory module elicitation for eukaryotic genomes. PNAS, 102(20):70797084.
Hanlon, S. E. and Lieb, J. D. (2004). Progress and challenges in proling the dynamics of chromatin and transcription factor binding with DNA microarrays. Curr. Opin. Genet. Dev., 14(6):697705.
Herrmann, D. C. C., Dieterich, C., Cunto, F. D., Provero, P., and Caselle, M. (2005). Ab initio identication of putative human transcription factor binding sites by comparative genomics. BMC Bioinformatics, 6(1):110.
Hughes, J. D., Estep, P. W., Tavazoie, S., and Church, G. M. (2000). Computational identication of cis-regulatory elements associated with groups of functionally related genes in Saccharomyces cerevisiae. J. Mol. Biol., 296(5):12051214.
Kel, A. E., Gössling, E., Reuter, I., Cheremushkin, E., Kel-Margoulis, O. V., and Wingen-der, E. (2003). MATCH: A tool for searching transcription factor binding sites in DNA sequences. Nucleic Acids Res., 31(13):35763579.
Kellis, M., Patterson, N., Endrizzi, M., Birren, B., and Lander, E. S. (2003). Sequenc-ing and comparison of yeast species to identify genes and regulatory elements. Nature, 423(6937):241254.
Kent, W. J. (2002). BLATthe BLAST-like alignment tool. Genome Res., 12(4):656664.
Kent, W. J. and Zahler, A. M. (2000). Conservation, Regulation, Synteny, and Introns in a Large-scale C. briggsae-C. elegans Genomic Alignment. Genome Res., 10(8):11151125.
Kirschner, M. and Gerhart, J. (1998). Evolvability. PNAS, 95(15):84208427.
Lee, T. I., Rinaldi, N. J., Robert, F., Odom, D. T., Bar-Joseph, Z., Gerber, G. K., Hannett, N. M., Harbison, C. T., Thompson, C. M., Simon, I., Zeitlinger, J., Jennings, E. G., Murray, H. L., Gordon, D. B., Ren, B., Wyrick, J. J., Tagne, J.-B., Volkert, T. L., Fraenkel, E., Giord, D. K., and Young, R. A. (2002). Transcriptional regulatory networks in Saccharomyces cerevisiae. Science, 298(5594):799804.
Lenhard, B., Sandelin, A., Mendoza, L., Engström, P., Jareborg, N., and Wasserman, W. W. (2003). Identication of conserved regulatory elements by comparative genome analysis. J. Biol., 2(2):13.
Levy, S. and Hannenhalli, S. (2002). Identication of transcription factor binding sites in the human genome sequence. Mamm. Genome, 13(9):510514.
Lieb, J. D., Liu, X., Botstein, D., and Brown, P. O. (2001). Promoter-specic binding of Rap1 revealed by genome-wide maps of protein-DNA association. Nat. Genet., 28(4):327 334.
Liu, X. S., Brutlag, D. L., and Liu, J. S. (2002). An algorithm for nding protein-DNA bind-ing sites with applications to chromatin-immunoprecipitation microarray experiments. Nat. Biotechnol., 20(8):835839.
Locascio, A., Manzanares, M., Blanco, M. J., and Nieto, M. A. (2002). Modularity and reshuing of Snail and Slug expression during vertebrate evolution. PNAS, 99(26):16841 16846.
Loots, G. G., Locksley, R. M., Blankespoor, C. M., Wang, Z. E., Miller, W., Rubin, E. M., and Frazer, K. A. (2000). Identication of a coordinate regulator of interleukins 4, 13, and 5 by cross-species sequence comparisons. Science, 288(5463):136140.
Lu, Q. and Richardson, B. (2004). DNaseI hypersensitivity analysis of chromatin structure. Methods Mol. Biol., 287:7786.
Lynch, M. and Conery, J. S. (2003). The origins of genome complexity. Science, 302(5649):14011404.
Ma, B., Tromp, J., and Li, M. (2002). PatternHunter: faster and more sensitive homology search. Bioinformatics, 18:440445.
Mayor, C., Brudno, M., Schwartz, J. R., Poliakov, A., Rubin, E. M., Frazer, K. A., Pachter, L. S., and Dubchak, I. (2000). VISTA : visualizing global DNA sequence alignments of arbitrary length. Bioinformatics, 16(11):10461047.
Münch, R., Hiller, K., Barg, H., Heldt, D., Linz, S., Wingender, E., and Jahn, D. (2003). PRODORIC: prokaryotic database of gene regulation. Nucleic Acids Res., 31(1):266269.
Morgenstern, B. (1999). Dialign 2: improvement of the segment-to-segment approach to multiple sequence alignment. Bioinformatics, 15:211218.
Nardone, J., Lee, D. U., Ansel, K. M., and Rao, A. (2004). Bioinformatics for the 'bench biologist': how to nd regulatory regions in genomic DNA. Nat. Immunol., 5(8):768774.
Needleman, S. B. and Wunsch, C. D. (1970). A general method applicable to the search for similarities in the amino acid sequence of two proteins. J. Mol. Biol., 48:443453.
Ohler, U. and Niemann, H. (2001). Identication and analysis of eukaryotic promoters: recent computational approaches. Trends Genet., 17(2):5660.
Oliveri, P. and Davidson, E. H. (2004). Gene regulatory network analysis in sea urchin embryos. Methods Cell Biol., 74:775794.
Pearson, W. R. (1991). Searching protein sequence libraries: comparison of the sensitivityand selectivity of the Smith-Waterman and FASTA algorithms. Genomics, 11(3):635650.
Pennacchio, L. A. and Rubin, E. M. (2001). Genomic strategies to identify mammalian regulatory sequences. Nat. Rev. Genet., 2(2):100109.
Pilpel, Y., Sudarsanam, P., and Church, G. M. (2001). Identifying regulatory networks by combinatorial analysis of promoter elements. Nat. Genet., 29(2):153159.
Ponomarenko, M. P., Ponomarenko, J. V., Frolov, A. S., Podkolodnaya, O. A., Vorobyev, D. G., Kolchanov, N. A., and Overton, G. C. (1999). Oligonucleotide frequency matrices addressed to recognizing functional DNA sites. Bioinformatics, 15(7):631643.
Quandt, K., Frech, K., Karas, H., Wingender, E., and Werner, T. (1995). MatInd and MatInspector: new fast and versatile tools for detection of consensus matches in nucleotide sequence data. Nucl. Acids Res., 23(23):48784884.
Ren, B. and Dynlacht, B. D. (2004). Use of chromatin immunoprecipitation assays in genome-wide location analysis of mammalian transcription factors. Methods Enzymol., 376:304315.
R. A. (2000). Genome-wide location and function of DNA binding proteins. Science, 290(5500):23062309.
Sabo, P. J., Humbert, R., Hawrylycz, M., Wallace, J. C., Dorschner, M. O., McArthur, M., and Stamatoyannopoulos, J. A. (2004). Genome-wide identication of DNaseI hypersen-sitive sites using active chromatin sequence libraries. PNAS, 101(13):45374542.
Salgado, H., Gama-Castro, S., Martínez-Antonio, A., Díaz-Peredo, E., Sánchez-Solano, F., Peralta-Gil, M., Garcia-Alonso, D., Jiménez-Jacinto, V., Santos-Zavaleta, A., Bonavides-Martínez, C., and Collado-Vides, J. (2004). RegulonDB (version 4.0): transcriptional regulation, operon organization and growth conditions in Escherichia coli K-12. Nucleic Acids Res., 32(Database issue):D303D306.
Sandelin, A., Wasserman, W. W., and Lenhard, B. (2004). ConSite: web-based prediction of regulatory elements using cross-species comparison. Nucleic Acids Res., 32(Web Server issue):W249W252.
Schneider, T. D. (2002). Consensus sequence Zen. Appl. Bioinformatics, 1(3):111119.
Schneider, T. D., Stormo, G. D., Gold, L., and Ehrenfeucht, A. (1986). Information content of binding sites on nucleotide sequences. J. Mol. Biol., 188(3):415431.
Schwartz, S., Kent, W. J., Smit, A., Zhang, Z., Baertsch, R., Hardison, R. C., Haussler, D., and Miller, W. (2003). Human-mouse alignments with BLASTZ. Genome Res., 13(1):103107.
Schwartz, S., Zhang, Z., Frazer, K. A., Smit, A., Riemer, C., Bouck, J., Gibbs, R., Hardi-son, R., and Miller, W. (2000). PipMakera web server for aligning two genomic DNA sequences. Genome Res., 10(4):577586.
Shabalina, S. A., Ogurtsov, A. Y., Kondrashov, V. A., and Kondrashov, A. S. (2001). Selective constraint in intergenic regions of human and mouse genomes. Trends Genet., 17(7):373376.
Sinha, S. and Tompa, M. (2003). YMF: A program for discovery of novel transcription factor binding sites by statistical overrepresentation. Nucleic Acids Res., 31(13):35863588.
Sinha, S., van Nimwegen, E., and Siggia, E. D. (2003). A probabilistic method to detect regulatory modules. Bioinformatics, 19 Suppl 1:i292i301.
Smith, T. F. and Waterman, M. S. (1981). Identication of common molecular subsequences. J. Mol. Biol., 147(1):195197.
Staden, R. (1984). Computer methods to locate signals in nucleic acid sequences. Nucl. Acids Res., 12(1):505519.
Storm, C. E. V. and Sonnhammer, E. L. L. (2003). Comprehensive analysis of orthologous protein domains using the HOPSdatabase. Genome Res., 13(10):23532362.
Stormo, G. D. (2000). DNA binding sites: representation and discovery. Bioinformatics, 16(1):1623.
Stormo, G. D. and Fields, D. S. (1998). Specicity, free energy and information content in protein-DNA interactions. Trends Biochem. Sci., 23(3):109113.
Sui, S. J. H., Mortimer, J. R., Arenillas, D. J., Brumm, J., Walsh, C. J., Kennedy, B. P., and Wasserman, W. W. (2005). oPOSSUM: identication of over-represented transcription factor binding sites in co-expressed genes. Nucleic Acids Res., 33(10):31543164.
Thijs, G., Lescot, M., Marchal, K., Rombauts, S., Moor, B. D., Rouzé, P., and Moreau, Y. (2001). A higher-order background model improves the detection of promoter regulatory elements by Gibbs sampling. Bioinformatics, 17(12):11131122.
Thomas, J. W., Touchman, J. W., Blakesley, R. W., Bouard, G. G., Beckstrom-Sternberg, S. M., Margulies, E. H., Blanchette, M., Siepel, A. C., Thomas, P. J., McDowell, J. C., Maskeri, B., Hansen, N. F., Schwartz, M. S., Weber, R. J., Kent, W. J., Karolchik, D., Bruen, T. C., Bevan, R., Cutler, D. J., Schwartz, S., Elnitski, L., Idol, J. R., Prasad, A. B., Lee-Lin, S.-Q., Maduro, V. V. B., Summers, T. J., Portnoy, M. E., Dietrich, N. L., Akhter, N., Ayele, K., Benjamin, B., Cariaga, K., Brinkley, C. P., Brooks, S. Y., Granite, S., Guan, X., Gupta, J., Haghighi, P., Ho, S.-L., Huang, M. C., Karlins, E., Laric, P. L., Legaspi, R., Lim, M. J., Maduro, Q. L., Masiello, C. A., Mastrian, S. D., McCloskey, J. C., Pearson, R., Stantripop, S., Tiongson, E. E., Tran, J. T., Tsurgeon, C., Vogt, J. L., Walker, M. A., Wetherby, K. D., Wiggins, L. S., Young, A. C., Zhang, L.-H., Osoegawa, K., Zhu, B., Zhao, B., Shu, C. L., Jong, P. J. D., Lawrence, C. E., Smit, A. F., Chakravarti, A., Haussler, D., Green, P., Miller, W., and Green, E. D. (2003). Comparative analyses of multi-species sequences from targeted genomic regions. Nature, 424(6950):788793.
Thompson, W., Rouchka, E. C., and Lawrence, C. E. (2003). Gibbs recursive sampler: nding transcription factor binding sites. Nucleic Acids Res., 31(13):35803585.
Tompa, M., Li, N., Bailey, T. L., Church, G. M., Moor, B. D., Eskin, E., Favorov, A. V., Frith, M. C., Fu, Y., Kent, W. J., Makeev, V. J., Mironov, A. A., Noble, W. S., Pavesi, G., Pesole, G., Réier, M., Simonis, N., Sinha, S., Thijs, G., van Helden, J., Vandenbogaert, M., Weng, Z., Workman, C., Ye, C., and Zhu, Z. (2005). Assessing computational tools for the discovery of transcription factor binding sites. Nat. Biotechnol., 23(1):137144.
Ureta-Vidal, A., Ettwiller, L., and Birney, E. (2003). Comparative genomics: genome-wide analysis in metazoan eukaryotes. Nat. Rev. Genet., 4(4):251262.
van Steensel, B. (2005). Mapping of genetic and epigenetic regulatory networks using mi-croarrays. Nat. Genet., 37 Suppl:S18S24.
Vilo, J., Brazma, A., Jonassen, I., Robinson, A., and Ukkonen, E. (2000). Mining for putative regulatory elements in the yeast genome using gene expression data. Proc. Int. Conf. Intell. Syst. Mol. Biol., 8:384394.
Wasserman, W. W., Palumbo, M., Thompson, W., Fickett, J. W., and Lawrence, C. E. (2000). Human-mouse genome comparisons to locate regulatory sites. Nat. Genet., 26(2):225228.
Weinmann, A. S., Yan, P. S., Oberley, M. J., Huang, T. H.-M., and Farnham, P. J. (2002). Isolating human transcription factor targets by coupling chromatin immunoprecipitation and CpG island microarray analysis. Genes Dev., 16(2):235244.
Werner, T. (2000). Identication and functional modelling of DNA sequence elements of transcription. Brief Bioinform., 1(4):372380.
Wheeler, D. L., Church, D. M., Edgar, R., Federhen, S., Helmberg, W., Madden, T. L., Pontius, J. U., Schuler, G. D., Schriml, L. M., Sequeira, E., Suzek, T. O., Tatusova, T. A., and Wagner, L. (2004). Database resources of the National Center for Biotechnology Information: update. Nucl. Acids Res., 32(90001):D35D40.
Wingender, E. (2004). TRANSFAC, TRANSPATH and CYTOMER as starting points for an ontology of regulatory networks. In. Silico. Biol., 4(1):5561.
Workman, C. T. and Stormo, G. D. (2000). ANN-Spec: a method for discovering tran-scription factor binding sites with improved specicity. Pac. Symp. Biocomput., pages 467478.
Yeo, G. and Burge, C. B. (2003). Maximum entropy modeling of short sequence motifs with applications to rna splicing signals. In RECOMB '03: Proceedings of the seventh annual international conference on Computational molecular biology, pages 322331, New York, NY, USA. ACM Press.
Zaret, K. S. and Yamamoto, K. R. (1984). Reversible and persistent changes in chromatin structure accompany activation of a glucocorticoid-dependent enhancer element. Cell, 38(1):2938.
Zhang, M. Q. (1999). Promoter analysis of co-regulated genes in the yeast genome. Comput. Chem., 23(3-4):233250.
Zhang, M. Q. and Marr, T. G. (1993). A weight array method for splicing signal analysis. Comput. Appl. Biosci., 9(5):499509.
Zhang, T.-Y., Kang, Zhang, Z.-F., and Xu, W.-H. (2004). Identication of a POU factor involved in regulating the neuron-specic expression of the gene encoding diapause hor-mone and pherohor-mone biosynthesis-activating neuropeptide in Bombyx mori. Biochem. J., 380(Pt 1):255263.
Zhang, Z. and Gerstein, M. (2003). Of mice and men: phylogenetic footprinting aids the discovery of regulatory elements. J. Biol., 2(2):11.
Zhao, F., Xuan, Z., Liu, L., and Zhang, M. Q. (2005). TRED: a Transcriptional Regulatory Element Database and a platform for in silico gene regulation studies. Nucleic Acids Res., 33(Database issue):D103D107.
con-ference on Computational molecular biology, pages 6875, New York, NY, USA. ACM Press.
Chapter 2
Abstract
Comparative sequence analysis is a powerful approach for identifying conserved functional elements in orthologous sequences. The success of this approach depends on the accuracy of sequence alignment. Here we propose a novel pairwise sequence alignment algorithm, ACANA (ACcurate ANchoring Alignment), for aligning biological sequences at both local and global levels. Like many fast heuristic methods, ACANA uses an anchoring strat-egy. However, unlike others, ACANA uses a Smith-Waterman-like dynamic programming algorithm to recursively identify near optimal regions as anchors for a global alignment. Performance evaluations using a simulated benchmark dataset and real promoter sequences suggest that ACANA is accurate and consistent, especially for divergent sequences. Speci-cally, we use a simulated benchmark dataset to show that ACANA has the highest sensitivity to align constrained functional sites compared to BLASTZ, CHAOS and DIALIGN for local alignment and compared to AVID, ClustalW, DIALIGN, and LAGAN for global alignment. Applied to 6,007 pairs of human-mouse orthologous promoter sequences, ACANA identied the largest number of conserved regions (dened as over70%identity over 100bp) compared
Introduction
Discovering the function of genes and revealing gene regulation networks are important tasks in decoding genome sequences. The conserved protein domains and functional reg-ulatory sites can provide valuable information for inferring gene functions and regreg-ulatory controls. Comparative analysis of homologous sequences from related species is an ecient way to reveal such functional domains or regulatory elements (Xie et al., 2005). With the increasing availability of genome sequences from related species, such cross-species compar-ative analysis has become a powerful and popular approach for decoding information in genome sequences. However, the success of a comparative analysis is largely dependent on the alignment accuracy of sequences.
lengths of two sequences and can increase by a factor of about three when the ane gap cost model is applied. Hence, many heuristic algorithms (Altschul et al., 1990, 1997; Batzoglou et al., 2000; Morgenstern et al., 1998; Morgenstern, 1999; Tatusova and Madden, 1999; Kent and Zahler, 2000; Bray et al., 2003; Brudno et al., 2003b; Schwartz et al., 2003) have been developed to increase alignment speed and/or make alignment more biologically meaningful. BLAST (Altschul et al., 1990, 1997), a standard tool to search for homologous segments, has impressive speed. MUMmer (Delcher et al., 2002) and AVID (Bray et al., 2003), both of which locate anchors using a sux tree algorithm, are two well-known fast global alignment tools. To increase alignment speed, many of these algorithms search for highly matched gap-free segments of xed length as alignment seeds. As a result, the obtained alignments may not be (biologically) optimal, especially when sequences are highly divergent.
In many comparative sequence analysis tasks, one is interested in nding short conserved protein domains or non-coding functional elements. In such analyses, one usually deals with sequences with moderate length, i.e., a few thousand to tens of thousand base pairs that can be aligned quickly even by the relatively slow and intricate dynamic programming algorithms. However, quality of alignment remains a challenging issue, particularly when sequences are highly divergent. To address this issue, we developed a new pairwise alignment algorithm, ACANA (ACcurate ANchoring Alignment), to improve quality of alignment of sequences that share only moderate similarity and/or have many long insertions/deletions.
Results
Outline of ACANA algorithm
time and/or improving quality of global alignment. The latter feature is largely dependent on the accuracy of anchor selection. To ensure an accurate alignment, ACANA weights local similarity, regional conservation, and overall similarity of sequences, and chooses the best set of anchoring regions, from which a biologically meaningful global alignment can be constructed. The simplied ACANA alignment algorithm is illustrated in Figure 2.1. The four essential parts of ACANA algorithm are: a heuristic dynamic programming algorithm primarily based on the Smith-Waterman algorithm for calculating matrices and tracing local alignment pathes using ane gap cost model; a hash based algorithm for identifying non-overlapping local alignments in a single pass of calculation of matrices; a method of selecting anchoring regions from local alignments; an algorithm for avoiding unnecessary calculation in recursively searching for the best anchoring regions. The details of these algorithms are described in Methods. For a pair of sequences, ACANA outputs the non-overlapping local alignments as well as a global alignment, so it is a both local and global alignment tool.
Evaluation of performance
Evaluation on simulated sequences
The simulated data set was generated and used by Pollard et al. (2004) for evaluating the performance of alignment tools in aligning non-coding DNA sequences. The original data consist of four dierent sets simulated under four dierent regimes. Here we used only one set whose sequences were simulated under the regime with insetion/deletion evolution and constraint blocks. The sequences in this data set are more realistic and biologically relevant than those in other sets as the authors suggested. In short, the data set consists of sequences with eleven divergence distances ranging from 0.25 to 5.0 substitutions per site. At each
divergence distance, there are 1000 pairs of10Kbsequences. For evaluation, both global and
local alignments produced by ACANA were scored for the six measures: overall coverage, overall sensitivity, constraint coverage, constraint sensitivity, constraint specicity, and local constraint sensitivity. These measures were calculated by the exactly same methods used by Pollard et al. (2004). For each of these six measures, a mean and a coecient of variation were calculated from 1000 replicates at each divergence distance.
Local alignment performance
For a local alignment tool, one would be interested in its ability to accurately align functional constrained sites. To assess this ability, we compared ACANA with DIALIGN (Morgenstern et al., 1996, 1998; Morgenstern, 1999), BLASTZ(Schwartz et al., 2003), and CHAOS (Brudno et al., 2003a)(author suggested settings were used for BLASTZ and CHAOS. The details are described in Pollard et al. (2004)). Figures 2.2 and 2.3 show that ACANA can detect constrained functional sites with a high sensitivity and a reasonable specicity. In partic-ular, ACANA has a higher constraint sensitivity for sequences of intermediate (1.25−3.0
substitutions per site) or large divergence distances (3.0−5.0 substitutions per site) than
while the dierence in constraint specicity is relatively unchanged or even smaller. In ad-dition, the coecients of variation of all six measures for ACANA are relatively small across dierent divergence distances (Figure 2.7), which suggests that performance of ACANA is consistent in aligning dierent pairs of sequences. We also found that ACANA, BLASTZ and DIALIGN all have a high local constraint sensitivity (over 90%) across dierent diver-gence distances and show no signicant dierence from each other, whereas CHAOS has a lower local constraint sensitivity.
Global alignment performance
To assess the performance of ACANA for global alignment, we compared it with top com-peting alignment tools: AVID (Bray et al., 2003), LAGAN (Brudno et al., 2003b) and DIALIGN, as well as with the classic ClustalW (Thompson et al., 1994). To assess align-ment accuracy of a global alignalign-ment tool, the most relevant measures are overall sensitivity, constraint sensitivity and specicity. ACANA outperforms all other four tools with regard to these measures, and this is particularly true for sequences of intermediate or larger diver-gence distances (Figures 2.4, 2.5 and 2.6). Interestingly, after an initial decrease, the overall sensitivity of ACANA increases as the divergence distance increases. This is not the case for the other competing tools of which overall sensitivity either stays relatively unchanged or decreases as divergence distance increases. Again, the performance of ACANA in these measures is highly consistent, as its coecients of variation stay relatively smaller across dierent divergence distances than those of the other tools (Figure 2.8).
Assessment on real sequences
length 4,500bp: 3,500bp upstream and 1,000 bp downstream of the transcription start site
(TSS) as annotated in GenBank. Because we did not know the true alignments, we used indirect measures of alignment accuracy for assessing ACANA performance.
Local alignment sensitivity
To test whether ACANA local alignment can eectively detect conserved functional sites in homologous sequences, we assessed its sensitivity for aligning conserved transcription factor binding sites (TFBS) in the human-mouse orthologous promoter sequences. Since we do not know the number of truly conserved sites in our promoter sequences, we used the relative TFBS sensitivity described in Methods for assessing a tool sensitivity for local alignment. The performance of ACANA was compared with that of CHAOS (using its default parameter settings) for local alignment. Both ACANA and CHAOS output non-overlapping local alignments, which are anchoring regions for global alignments by ACANA and LAGAN, respectively.
We used the known instances of TFBS from 20 matrix records of Transfac database (Wingender et al., 2000) to nd the exactly matched sites as putative functional sites in our sequences. Overall, a total of 135,179 putative sites are found in 6007 unaligned human pro-moter sequences, among which 57902 and 14602 are detected as conserved sites by ACANA and CHAOS, respectively. That is, on average, the relative TFBS sensitivity of ACANA is 42.83%, and that of CHAOS is 10.80%. The dierences between ACANA and CHAOS are consistent across 20 dierent matrix records (Figure 2.9).
proximity to the transcription start sites, which is consistent with the proposed E2F function as an initiator binding protein to form a pre-initiation complex of transcription (Cartwright et al., 1998; Black and Azizkhan-Cliord, 1999; Helin, 1998; Hateboer et al., 1998). So if a putative E2F binding site is a true functional site, it is most likely located in regions near transcription start sites. Using mRNA start positions annotated in GenBank as the likely transcription start sites (TSS), all of the putative sites that are exactly matched to the known instances in the record M00932 of Transfac database are mapped into the relative location to TSS. The results in Figure 2.10 show that most putative E2F sites are near the putative TSS. For a few sites that are located far from TSS, it is possible that the putative TSS are not the true TSS because many mRNA annotated in GenBank are not of full length.
Global Alignment Quality
Instead of directly measuring alignment accuracy, which is impossible when true alignments are unknown, we assessed global alignment quality by the relative length of all conserved re-gions aligned by dierent tools. From a biological point of view, an accurate global alignment should correctly align evolutionarily related regions, including the syntenically conserved re-gions. Therefore, the relative length of syntenically conserved regions aligned can be used as an indirect measure for assessing quality of global alignments by dierent tools.