ABSTRACT
MOSES, SELINA. Characterization and functionalization of substrates and nanoparticles for detection of surface binding events of biomolecules. (Under the direction of Stefan Franzen.)
This dissertation mainly focuses on detection of biomolecules on metal and
metal-oxide surfaces by photoelectrochemistry. Characterization of DNA monolayers on the
surface of gold was studied in detail by X-ray photoelectron spectroscopy (XPS),
Polarization Modulated Infrared reflectance absorbance Spectroscopy (PMIRRAS) and
FTIR. An electrochemical technique Chronocoulometry (CC) quantified the surface
coverage of ssDNA on gold to be ~ 1012 molecules/cm2. The issues that affected the
hybridization efficiency of DNA on the gold surface were analyzed and parameters for
optimum hybridization were established by the same techniques used to detect ssDNA on
the surface. Though gold is a well-known surface, the thiol chemistry, which is the basis
of attaching DNA on the surface, is not robust and reproducible due to the desorption of
probes from the surface during hybridization, which involves elevating the temperature.
Hybridization yield on gold surfaces could not be determined accurately as the desorption
of probe from the surface was a competing phenomenon during hybridization event. As a
result, new substrates were analyzed and indium-doped tin oxide (ITO) was found to be a
very useful substrate because of the ease with which it can be modified with COOH,
Phosphates, Phosphonates and silanes. In addition, the physical properties of ITO make it
an attractive candidate to use in creating bioarrays. It is highly conductive and tansparent
in the visible region and reflective in the IR. Compared to the thiol chemistry on gold the
gold nanoparticles used as labels to detect hybridization. All these properties can be
utilized to characterize ssDNA modified ITO surfaces and surface DNA hybridization
either by optical or electrical methods. 12-Phosphonododecanoic acid (12-PDA) formed a
well-ordered monolayer on the ITO surface. By activating the COOH group by
1-ethyl-3-(3-dimethylaminopropyl)carbodiimide hydrochloride (EDC), an amine terminated DNA
probe can be attached to the surface with 12-PDA as the linker. Studies on monolayer of
DNA on ITO by XPS, IR show presence of DNA on the ITO surface and CC reveals a
surface coverage of ~ 1013 molecules/cm2. The detection strategies employed in this
study to detect hybridization of DNA was by probing the gold nanoparticle labeled target
DNA by XPS, AFM, electrochemical stripping and thermography. To further improve the
design, TiO2 nanoparticles sensitized with a Ruthenium polypyridyl complex was used as
a label to detect DNA hybridization photoelectrochemically. This idea was generalized
further to detect viruses - Red Clover Necrotic Mosaic Virus (RCNMV) and HIV from
CHARACTERIZATION AND FUNCTIONALIZATION OF SUBSTRATES AND NANOPARTICLES FOR DETECTION OF SURFACE BINDING EVENTS OF
BIOMOLECULES
by
SELINA MOSES
A dissertation submitted to the Graduate Faculty of North Carolina State University
in partial fulfillment of the requirements for the Degree of
Doctor of Philosophy
CHEMISTRY Raleigh, North Carolina
2005
APPROVED BY:
Dr. Stefan Franzen, Chair of Advisory Committee
Dr. Daniel Feldheim Dr. Paul Maggard
DEDICATION
To my wonderful parents who taught me to dream big in life and
supported me with their thoughtful prayers
To my dear sister and her family for their encouragement
and love
To my loving husband for constantly inspiring me
BIOGRAPHY
ACKNOWLEDGEMENTS
First and foremost I would like to give all glory and honor to God, the source of all wisdom and understanding. He granted me His grace, strength and guidance at every step throughout the strenuous years of graduate student life. God has led me in wonderful ways and brought wonderful people along my way for whom I am thankful.
My husband Jabastine Moses, has been my constant source of inspiration. When I see him tirelessly persuing his MBA at Duke University and keeping a full time job it inspires me. He has motivated me immensely and listened to all my frustrations when my experiments failed and shared the happy moments of exciting results. He would push me as hard as he could to get more publications!! His love, friendship and support have carried me through these years.
My parents Chandra Anthireya and Jesudason Anthireya encouraged me from early on in life to work hard and do my best in everything. They supported my interest in science through school and college and made it possible for me to dream big and set high goals in life. Growing up they provided a loving atmosphere and instilled good discipline, which was much needed in my Graduate student life. My sister Sophia, was always ready to help me with my doubts in science especially in chemistry and taught me how to balance chemical equations! Without my family’s support and prayers I would not be who I am today.
each and every one of them, specially the Dinakaran’s for their constant care, love and fellowship.
My life as a graduate student would not have been so rewarding if it not were for my research advisor Dr. Stefan Franzen. He has a way of inspring people with his passion for science. He is extremely resourceful and knowledgeable and yet would take time to discuss and explain concepts as many times as I requested. His enthusiasm would make me strive harder everytime I had a meeting with him. I also want to thank Jan Genzer, Daniel Feldheim and Paul Maggard for being on my committee and reviewing my diisertation. Dan and Paul have also contributed a lot to this thesis and I have benefited greatly by the fruitful discussions I had with both of them.
TABLE OF CONTENTS
LIST OF TABLES... xii
LIST OF FIGURES... xiii
LIST OF SCHEMES... xx
CHAPTER 1 INTRODUCTION AND BACKGROUND... 1
1.1 Introduction... 2
1.2 Background ... 4
1.2.1 DNA Morphology... 4
1.2.2 DNA hybridization and factors affecting hybridization efficiency ... 6
1.2.2.1 Nucleic Acid concentration... 9
1.2.2.2 Salt concentrationtions... 9
1.2.2.3 Temperature ... 10
1.2.2.4 Length of the target... 10
1.2.2.5 Formamide Concentration ... 11
1.2.2.6 Composition of oligo ... 11
1.2.2.7 Mismatch Percentage ... 11
1.2.2.8 Other Factors... 11
1.3 History of Hybridization Assay ... 12
1.3.1 Southern Blotting Hybridization Assay... 13
1.3.2 DNA Microarrays ... 13
References... 14
CHAPTER 2 DETECTION OF DNA HYBRIDIZATION ON GOLD SUBSTRATES BY POLARIZATION MODULATION INFRARED REFLECTION ABSORPTION SPECTROSCOPY (PMIRRAS)... 16
Abstract... 17
2.1 Introduction... 17
2.2.1 DNA Monolayer Formation... 19
2.2.2 Polarization Modulation Infrared Reflection Absorption Spectroscopy (PM-IRRAS) ... 21
2.2.3 Density Functional Theory (DFT) Calculations. ... 22
2.3 Results and Discussion ... 22
2.4 Conclusion ... 30
Acknowledgements... 31
References... 31
CHAPTER 3 COLLOIDAL LABELING FOR DNA HYBRIDIZATION DETECTION ON GOLD SUBSTRATES... 34
3.1 Introduction to nanoparticles ... 35
3.1.1 Optical and redox properties of nanoparticles ... 35
3.1.2 Stability of colloids... 37
3.2 Adsorption of Ru(II) and Os(II) Polypyridyl Complexes on Gold and Silver Nanoparticles ... 38
3.2.1 Introduction... 39
3.2.2 Methods and Material ... 40
3.2.2.2. Steady-State Methods ... 41
3.2.3 Results... 42
3.2.3 1 Steady-State spectra ... 42
3.2.3.2 Time-Resolved Data ... 47
3.2.4 Discussion... 51
3.2.5 Conclusion ... 57
3.3 Sandwich Hybridization Assay of DNA... 58
3.3.1 Instrumentation ... 59
3.3.2 Methods and material... 59
Acknowledgements... 62
CHAPTER 4
CHARACTERIZATION AND QUANTITATION OF SSDNA AND DETECTION
OF HYBRIDIZATION OF DNA ON GOLD SUBSTRATES... 66
Abstract... 67
4.1 Introduction... 68
4.2 Methods and Materials... 69
4.2.1 Materials ... 69
4.2.2 DNA Monolayer Formation... 69
4.2.3 Oligonucleotides. ... 71
4.3 Instrumentation ... 71
4.3.1 X-ray Photoelectron Spectroscopy (XPS) ... 71
4.3.2 Polarization Modulation Infrared Reflection Absorption Spectroscopy (PM-IRRAS). ... 72
4.3.3 Density Functional Theory (DFT) Calculations. ... 72
4.3.4 Electrochemical Measurements. ... 73
4.3.5 Atomic Force Microscopy. ... 74
4.3.6 Fluorescence Measurements ... 74
4.4 Results... 75
4.4.1 ssDNA Modified Gold Surfaces ... 75
4.4.1.1 X-ray photoelectron spectroscopy (XPS). ... 75
4.4.1.2 Polarization modulation infrared reflection absorption spectroscopy (PM-IRRAS).... 77
4.4.1.3 Chronocoulometry. ... 78
4.4.1.4 Fluorescence. ... 80
4.4.2 DNA Hybridization on Gold Surfaces... 81
4.4.2.1 X-ray photoelectron spectroscopy (XPS). ... 81
4.4.2.2 Chronocoulometry. ... 82
4.4.2.3 Polarization modulation infrared reflection absorption spectroscopy (PM-IRRAS) ... 83
4.4.2.4 Atomic Force Microscopy (AFM). ... 86
4.6 Conclusions... 90
Acknowledgements... 91
References... 91
Tables... 93
CHAPTER 5 DETECTION OF DNA HYBRIDIZATION ON INDIUM TIN OXIDE SURFACES ... 95
Abstract... 96
5.1 Introduction... 96
5.2 Methods and Materials... 98
5.2.1 ssDNA modification of ITO. ... 98
5.2.3 DNA Hybridization Conditions. ... 100
5.2.4 X-ray Photoelectron Spectroscopy (XPS). ... 100
5.2.5 Infrared Reflection Absorption Spectroscopy (IRRAS). ... 101
5.2.6 Density Functional Theory (DFT) Calculations. ... 101
5.2.7 Electrochemistry. ... 101
5.2.8 Thermographic Measurements... 103
5.2.9 Atomic Force Microscopy (AFM). ... 103
5.3 Results and Discussion ... 104
5.3.1 Characterization of ssDNA modified ITO Surface... 104
5.3.2 Characterization of dsDNA modified ITO Surface ... 109
5.4 Conclusion ... 115
Acknowledgements... 116
References... 117
CHAPTER 6 DETECTION OF BIOMOLECULES ON METAL-OXIDE SUBSTRATES... 119
6.1 Detection of DNA on Indium tin oxide (ITO) substrates by photoelectrochemistry 120 6.1.1 Photoelectrochemistry – a sensitive detection tool for biomolecules... 120
6.1.3 Photoelectrochemistry: Inspiration from Semiconductor-Nanoparticle Solar Cells
... 123
6.1.4 Transfer of electron through DNA... 126
6.2 Research Design... 129
6.2.1 Synthesis of nanocrystalline TiO .2... 129
6.2.2 Synthesis of the Ruthenium polypyridyl compound... 132
6.2.3 Surface attachment of DNA to ITO. ... 133
6.2.4 Scheme for creating DNA microarray ... 134
6.2.4.1 Functionalization of TiO nanoparticles.2 ... 134
6.2.4.2 The Microarray Design ... 141
6.2.4.3 Experimental Setup Photoelectrochemistry (PEC)... 143
EDTA... 146
6.2 Quartz Crystal Microbalance (QCM) – a tool for detection light addressable biological sensor ... 154
6.2.1 General Introduction to QCM... 154
6.2 Methods and Instrumentation ... 155
6.3 Results and Discussion ... 156
Acknowledgements... 159
References... 159
CHAPTER 7 REASSEMBLY AND DETECTION OF VIRUS PARTICLES ON ITO SUBSTRATE... 161
7.1 General Introduction to plant and animal viruses ... 162
7.1.1 Properties of Plant Viruses... 164
7.1.2 Symmetry of Plant Viruses ... 164
7.2 Viral encapsulation using TiO nanoparticles2 ... 165
7.2.1 General Morphology of Red Clover Necrotic Mosaic Virus (RCNMV) ... 165
7.2.2 Materials and methods ... 166
7.2.3 Transmission Electron Microscope (TEM) ... 166
7.2.5 Conclusions... 169
7.3.1 Materials and Methods... 177
7.3.2 Dynamic Light Scattering( DLS)... 178
7.3.2 Transmission Electron Microscope (TEM) ... 178
LIST OF TABLES
Table 3.1: Lifetimes and Calculated Populations for Mixed Polypyridyl-Colloid Systems ... 49 Table 4.1. XPS N 1s peak positions and areas... 93 Table 4.2. Gaussian fits to the PM-IRRAS spectra of ssDNA and dsDNA on a gold
LIST OF FIGURES
Figure 1.2 A. Chemical components of DNA... 5
Figure 1.2.B Phosphodiester linkage ... 5
Figure 1.3 Watson-Crick Interactions... 6
Figure 1.4 B Form of DNA... 6
Figure 1.5 Melting curve of DNA... 8
Figure 1.6 Flow of genetic information chart ... 12
Figure 2.1 Formation of DNA monolayer by A. Codeposition route B. Sequential route20 Figure 2.2 PM-IRRAS spectra of a mixed monolayer of 6-mercapto-1-hexanol and single stranded DNA before (dashed spectrum) and after hybridization (solid spectrum) with the complementary single stranded DNA strand to obtain double stranded DNA with a hybridization temperature of 65°C (A) or 85°C (B) recorded at an incident angle of 80 degrees... 24
Figure 2.3. Solution single-pass ATR FTIR spectra of single stranded DNA (dashed spectrum) and double-stranded DNA (solid spectrum) corresponding to the same DNA strands used for the probe and target single stranded DNA on the gold surfaces. The concentration of the DNA solutions was approximately 200mM. The inset shows the larger spectral range from 970 - 1760 cm .-1 ... 25
Figure 2.4. Solution single-pass ATR FTIR spectra of single stranded DNA recorded as a function of hydration and concentration in aqueous solution. The spectra correspond to least concentrated ~20 mM (- - -), more concentrated (-- -- --), and most concentrated ~200 mM (solid spectrum) of the single stranded DNA used as the probe strand on the gold surfaces. The most concentrated sample is nearly in a gel state. ... 26
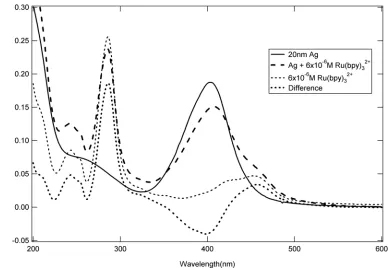
Figure 3.1. UV-VIS absorption spectra of 6x10⁻⁶M Ru(bpy)32+ adsorbed onto 10 nm mercaptooctanoate (MO) stabilized Au colloids (3.1x10⁻⁹ M), which corresponds to a ratio of Ru(bpy)32+/Au ~2000. The mixture was allowed to equilibrate for ~1 h before spectra were taken. Monomer spectra of the Au colloids and the Ru(bpy)32+ complex at equivalent concentrations are also included. The difference spectrum was obtained by subtracting the monomer spectrum of Au colloids from the spectrum of the mixture. ... 42 Figure 3.2. UV-VIS absorption spectra of 1.4x10 M Ru(bpy) adsorbed onto 10 nm
citrate stabilized Au colloids (4.7x10 M), which corresponds to a ratio of Ru(bpy) /Au ~300. The mixture was allowed to equilibrate for ~1 h before spectra were taken. Monomer spectra of the Au colloids and the Ru(bpy) complex at equivalent concentrations are also included. The difference spectrum was obtained by subtracting the monomer spectrum of Au colloids from the spectrum of the mixture. -6 32+ -9 32+ 32+ ... 44 Figure 3.3. UV-VIS absorption spectra of 6x10 M Ru(bpy) adsorbed onto 20 nm
citrate stabilized Ag colloids. The mixture was allowed to equilibrate for ~2 h before spectra were taken. Monomer spectra of the Ag colloids and the Ru(bpy) complex at equivalent concentrations are also included. The difference spectrum was obtained by subtracting the monomer spectrum of Ag colloids from the spectrum of the mixture.
-6
32+
32+
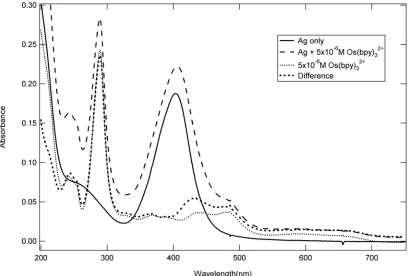
... 45 Figure 3.4. UV-VIS absorption spectra of 5x10 M Os(bpy) adsorbed onto 20 nm
citrate stabilized Ag colloids . The mixture was allowed to equilibrate for ~1 h before spectra were taken. Monomer spectra of the Ag colloids and the Os(bpy) complex at equivalent concentrations are also included. The difference spectrum was obtained by subtracting the monomer spectrum of Ag colloids from the spectrum of the mixture.
-6
32+
32+
... 46 Figure 3.5. Time-Resolved emission from Ru(bpy) in solution and adsorbed onto
various colloids. The colloids include 10 nm mercaptooctanoate (MO) stabilized Au colloids (3.1x10 M), 20 nm citrate stabilized Ag colloids and 10 nm citrate stabilized Au colloids (4.7x10 M). Given a solution concentration of 6x10 M Ru(bpy) /Au for the MO stabilized colloids the ratio of Ru(bpy) :Au is ~2000.
32+
-9
-9 -6
Lower concentrations had to be used for the citrate stabilized colloids in order to avoid aggregation. Given a solution concentration of 1.4x10 M Ru(bpy) in solution the ratio of Ru(bpy) :Au was ~300. The excitation wavelength was 423 nm and emission was detected at 640 nm. Each kinetic trace was normalized by setting the maximum intensity equal to 1. The experimental fits shown in the Figure all used a biexponential function. Experimental data are shown as a dashed line, and the predicted fit is shown as a solid line.
-6
32+ 32+
... 48 Figure 3.6. Time-Resolved emission data, detected at 780 nm, of 5x10 M Os(bpy) in aqueous solution and on 20 nm citrate stabilized Ag colloids is shown. The excitation wavelength for these systems was also 423 nm. The experimental data for Os(bpy) in aqueous solution were fitted to a single-exponential function, and the data for the mixed Os(bpy) colloid system were fit to a biexponential function. Each kinetic trace was normalized by setting the maximum intensity equal to 1. Experimental data are shown as a dashed line, and the predicted fit is shown as a solid line.
-6
32+
32+
32+
... 50 Figure 3.7. B Plot of Particle count vs target concentration. ... 60 Figure 3.7.C AFM image of noncomplimentary sequence checked for non specificity at 6 nM target concentration ... 61 Figure 3.8 Schematic of hybridization assay in a sandwich assay format... 62 Figure 3.9. AFM Images from Avidity Study - varying ratio of target oligonucleotide to gold colloid: 0.5 (A), 5.0 (B), and 50 (C). ... 62 Figure 3.10. Bnding Curve from Avidity Study-varying ratio of target oligonucleotide to gold colloid: 1 (A), 10 (B), and 100 (C). ... 62 Figure 4.1. XPS spectra of the N 1s region for a mixed monolayer of MCH/ssDNA. The dashed line corresponds to an adlayer of MCH in all three spectra. The raw data (dots) were fit to Gaussian line shapes (solid). ... 75 Figure 4.2. Plot of N 1s XPS peak area as a function of temperature of an adlayer of
Figure 4.4. Surface density of fluorescent tagged probe DNA adsorbed on gold substrates at 25 ºC, 45 ºC, 65 ºC, and 85 C.o ... 80 Figure 4.5. Chronocoulometric response curves for modified electrode surfaces in the
absence (dots) and presence (dashes) of 50 µM [Ru(NH ) ] in a buffer solution extrapolated to time zero from the linear portion of the curve (solid). A. dsDNA hybridized at 25 ºC. B. dsDNA hybridized at 45 ºC to a mixed MCH/ssDNA adlayer (solid) on a gold surface.
3 6 3+
... 82 Figure 4.6. PM-IRRAS of a mixed monolayer of ssDNA and MCH hybridized with the complementary ssDNA at 25 ºC (A) or 45 ºC (B) on a gold surface fitted to Gaussian line shapes and (C) is the difference spectra obtained by subtracting the ssDNA spectra from the dsDNA spectra. The solid and dashed lines correspond to the 25 ºC and 45 ºC difference spectra, respectively. ... 83 Figure 4.7. DFT calculated infrared spectra of ssDNA (solid) and dsDNA (dashed) using a weighted average of the DFT calculated infrared spectra of the individual and nucleotides along with the corresponding nucleotide base pairs according to the experimental DNA sequence used in the experiments. ... 85 Figure 4.8. AFM image of Gold substrate upon hybridization of ssDNA/MCH
monolayer with its compliment target labeled with 10 nm gold colloid (A) and with a non-compliment (B) at 6 nM target concentration... 86 Figure 5.1. XPS spectra of In 3d (A) and Sn 3d (B) for bare ITO (solid), ITO modified with a monolayer of 12-phosphonododecanoic acid (short dash) and ITO modified with ssDNA coupled through a monolayer of 12-phosphonododecanoic acid (long dash). C. XPS N 1s spectra of ITO modified with a monolayer of 12-phosphonododecanoic acid (long dash) and ITO modified with ssDNA coupled through a monolayer of 12-phosphonododecanoic acid (short dash) fitted to a Gaussian line shape (solid).
5/2,3/2 5/2,3/2
... 105 Figure 5.2. A. Reflectance FTIR spectra of ITO modified with a monolayer of
weighted average of the calculated IR spectra of the individual nucleosides fit to a Gaussian width of 10 cm .-1 ... 107 Figure 5.3. Chronocoulometry of a ssDNA modified ITO surface with (long dash) or
without (short dash) [Ru(NH ) ] in the electrochemical cell.3 6 3+ ... 108 Figure 5.4 (A) XPS spectra of Au 4f are shown. (B) stripping voltammograms (in a 0.5 M KCl solution) of ITO modified with ssDNA (long dash ) exposed to the complementary
7/2,5/2
... 110 (solid ) or non-complementary (short dash ) ssDNA labeled with 10 nm gold nanoparticles (1 nM) (C) Tapping mode AFM image (1µm with a height scale of 50 nm) of ITO modified with ssDNA exposed to the complementary ssDNA labeled with 10 nm gold nanoparticles (1 nM).
2
... 110 Figure 5.5. Anodic current versus time for an ITO electrode modified with ssDNA and hybridized with the complimentary ssDNA gold-nanoparticle conjugate (1 nM). The measurement was done in 0.1 M potassium phosphate buffer with 0.05 M EDTA. At 30 s the sample was illuminated with 532 nm laser light with a power density of approximately 100 W/cm . After 90 s the laser light was switched off. The potential was held at 0.7 V versus a Ag(s)/AgCl reference electrode which was not fixed isothermally.
2
... 112 Figure 5.6. A. Electrochemical response for 100 mM FeCl (scan rate 100 mV/s) as a function of the amount of target ssDNA / gold nanoparticle conjugate in the hybridization solution. The four target concentrations were 1 nM, 500 pM, 100 pM and 10 pM of the gold nanoparticles (modified with the target ssDNA). The hybridization was allowed to proceed for 1 hour at 45°C and the solution was then gradually cooled to room temperature overnight. B. Electrochemical response as a function of the amount of the gold nanoparticle / target ssDNA in the hybridization solution at 887 mV (squares) for the oxidation current and 109 mV (triangles) for the reduction current fit globally to a straight line (solid).
2
... 114 Figure 5.7. Electrochemical response for 100 mM FeCl (scan rate 100 mV/s) as a
function of the amount of target ssDNA in the hybridization solution with improved hybridization conditions. The three target amounts were 100 pM, 10 pM and 1 pM of the gold nanoparticles (10 nm diameter) modified with the target ssDNA. The
hybridization was allowed to proceed at 37°C for nineteen hours in a shaking
incubator. ... 115
Figure 6.1.A Dye sensitized Semiconductor Photoelectrochemical Cell. ... 124
Figure 6.1.B Pathway of electron flow in a Dye sensitized Semiconductor Photoelectrochemical Cell. ... 125
Figure 6.2 Electron hopping in DNA... 128
Figure 6.3. X-ray diffraction pattern of nanocrystalline TiO2... 130
Figure 6.4 UV-Visible spectrum of aqueous TiO .2... 131
Figure 6.5. Crystal structure of Rutile, Anatase and Brookite TiO2... 131
Figure 6.6 UV-Visible spectrum of [4,4’-(LL)] Ru(Cl) in water2 2 ... 132
Figure 6.7 Reaction scheme of surface hydroxyl groups of TiO2 with carboxylic acid. 133 Figure 6.8 TEM images of A. TiO nanoparticles in the supernatant suspension. B. TiO reacted with [4,4’-(LL)] Ru(Cl) 2 2 2 2... 136
Figure 6.9 TEM image of TiO nanoparticles suspended in water.2 ... 137
Figure 6.10 A. TiO functionalized with [4,4’-(LL)] Ru(Cl) B. TiO with Streptavidin2 2 2 2 ... 138
C. TiO functionalized with Streptavidin and [4,4’-(LL)] Ru(Cl)2 2 2... 138
Figure 6.11 UV-Vis spectra of strepatavidin and [4,4’-(LL)] Ru(Cl) stabilized TiO nanoparticles 2 2 2 ... 140
Figure 6.12 SEM image of TiO nanoparticles2 ... 141
Figure 6.13. Experimental setup for Photoelectrochemistry. ... 144
Table 6.14 Cyclic voltamograms of (A)electron donors I/I2 and EDTA (B) Sodium oxalate, TEA and EDTA in supporting electrolyte Sodium or Potassium Phospahte Buffer on bare ITO substrate ... 146
Figure 6.15 Cyclic voltamogram of 1 M [4,4’-(LL)] Ru(Cl) in sodium oxalate at pH 5.5 on bare ITO electrode. 2 2 ... 147
Figure 6.17 Photocurrent from 1uM [4,4’-(LL)] Ru(Cl) adsorbed on TiO particles sintered onto an ITO substrate. The electron donor is an Iodine system in propylene carbonate.
2 2 2
... 148
Figure 6.18 Photocurrent from TiO functionalized with [4,4’-(LL)] Ru(Cl) on ITO substrate at different applied potentials. Sacrificial donor is 50 mM EDTA in 0.1 M KP buffer. 2 2 2 ... 149
Figure 6.19 TiO functionalized with [4,4’-(LL)] Ru(Cl) on ITO substrate at different concentrations. The green curve corresponds to the lowest concentration and the blue curve corresponds to the highest concentration of functionalized nanoparticles. 2 2 2 ... 150
Figure 6.20. TiO functionalized with [4,4’-(LL)] Ru(Cl) on ITO substrate. A. Sacrificial donor 10 mM EDTA in 0.1 M KP buffer at pH 7.5 B. Sacrificial donor 10 mM Sodium oxalate in 0.1 M KP buffer at pH 5.5 2 2 2 ... 152
Figure 6.21 Temperature controlled QCM setup... 156
Figure 6.22 Frequency as a function of time on a ITO crystal ... 157
Figure 6.23 Change in temperature (A) and frequency (B) as a function of concentration of Au nanoparticles on the ITO crystal... 158
Figure 7.1 Bioarray for detection of viruses on substrates by photoelectrochemistry.... 163
Figure 7.2 a. TEM images of TiO nanoparticles and b. RCNMV assembled TiO nanoparticles 2 2 ... 167
Figure 7.3 XPS of N 1s of plain ITO, ITO modified with PDA and EDC coupled to RCNMV Antibody and ITO modified with PDA, EDC coupled to RCNMV Antibody and reacted with assembled virus ... 169
Figure7.4 Diagram of a Retrovirus ... 172
Figure 7.5 Infection cycle of retrovirus ... 173
Figure 7.6 Replication and budding of retroviruses... 174
Figure 7.7 Coding and Non coding proteins in retroviruses... 176
Figure 7.8 TEM image of reassembled HIV Gag protein... 177
Figure 7.9 A. 10 nm BSPP coated Au nanoparticles B. DLS of DNA-Au bioconjugate179 Figure 7.10 . Plain Gag protein A. TEM B. DLS ... 179
LIST OF SCHEMES
Scheme 5.1. Modification of ITO with single stranded DNA through the formation of an amide bond between the carboxylic acid functional group of a monolayer of 12-phosphonododecanoic acid with the primary amine of 5’ modified H N(CH ) ssDNA.
2 2 3 ... 99 Scheme 6.1. Formation of an amide bond by the activation of the carboxylic acid on a monolayer of 12-phosphonododecanoic acid on ITO by EDC (1-ethyl-3-(3-dimethylaminopropyl)carbodiimide hydrochloride) with 5’ modified C3NH2 DNA. ... 134 Scheme 6.2. Functionalization of TiO nanoparticles with [4,4’-(LL)] Ru(Cl)2 2 2... 135 Scheme 6.3. Functionalization of TiO nanoparticles by Streptavidin and
[4,4’-(LL)] Ru(Cl)
2
2 2... 137 Scheme 6.4 ITO substrate modified with ssDNA hybdridzed to a biotin labeled
compliment and exposed to Streptavidin and [4,4’-(LL)] Ru(Cl) coated by TiO nanoparticles.
2 2 2
CHAPTER 1
1.1 Introduction
All living things have a characteristic set of chromosomes present in the nucleus of each cell. Biochemical studies carried out around 1940 indicated that the nuclear materials that make up the chromosomes are composed of DNA and proteins. Three billion chemical bases make up human DNA forming estimated 50,000 – 100,000 genes into what is called human genome. The human genome is contained within the 23 pairs of chromosomes in the nucleus of a human cell, plus one tiny type of chromosome contained in a cell's mitochondria. The genomic sequence provides access to the complete structures of all genes, including those without known function, their control elements, and, by inference, the proteins they encode, as
well as all other biologically important sequences. The object of Human Genome Project was to decipher the entire nucleotide sequence of each of these DNA molecules – the location and identity of all the genes to determine which gene sequence is responsible for the genetic disorders. Also genetic mutations leading to
diseases and cancer have been an area of intense investigation. Interesting research has been carried out to develop new techniques that would provide insight to the sequence- specific information of DNA. Constant efforts are put in to obtain this information in a cheaper, faster and economical manner.
Figure 1.1 Fluorescence based microarray
http://www.gene-chips.com
hybridization may be then detected directly or by a marker tagged to the target. An experiment with a single DNA chip can provide researchers information on thousands of genes simultaneously - a dramatic increase in throughput.
1.2 Background
1.2.1 DNA Morphology
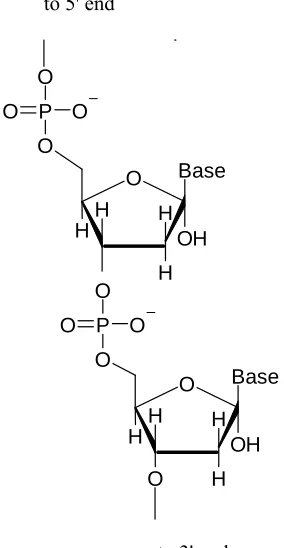
Deoxyribonucleic Acid (DNA) is a polymer composed of monomer units known as nucleotides. Each nucleotide consists of a 5-carbon sugar (deoxyribose), a nitrogen containing base attached to the sugar, and a phosphate group. The deoxyribose is a five carbon sugar with a pentagonal structure. The phosphate in the DNA is hydrophilic and binds to the sugar. It has three reactive (-OH) groups of which two are involved in the formation of the sugar-phosphate backbone of each DNA strand. The hydrophobic bases are divided into two classes based on their chemical structure. Adenine (A) and guanine (G) are double ringed bases and are called purines, while pyrimidines are single ringed structures comprised of thymine (T) and cytosine (C). In the DNA polynucleotide strands, the nucleotides are joined with each other by ‘phosphodiester linkages’ in which the phosphate group present at the C-5 of the sugar of one nucleotide gets attached to the C-3 of the sugar of the next nucleotide in the chain.
Bases
N N
N
N NH2
Adenine
N N
O O
C H3
N N N N O NH2 Guanine N N O NH2 Cytosine O H OH H H H OH H
CH2OH
2-Deoxyribose P O O O O Phosphate Group
Figure 1.2 A. Chemical components of DNA
P O O O O O H O H H H OH Base P O O O O O H H H H OH Base
to 5' end
to 3' end
N N N
N N
N
N O
O
CH3
H H H
A - T
N
N N
N O
N H
H H
N N
O N
H H
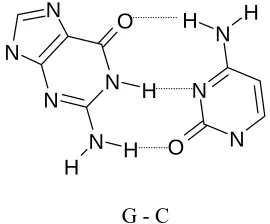
G - C
Figure 1.3 Watson-Crick Interactions
Nature © Macmillan Publishers Ltd
Figure 1.4 B Form of DNA
1.2.2 DNA hybridization and factors affecting hybridization efficiency
has the moieties in the right position for bonding to occur. Purine-purine ring pairs would be too bulky and the pyrimidine-pyrimidine ring pairs too far for the formation of double helical structure. Figure 3 shows how adenine binds to thymine and guanine to cytosine through hydrogen bonds called as Watson-crick Interactions. As this bonding continues, the hydrophilic anionic phosphates turn themselves to the outer side while the hydrophobic bases orient themselves on the inner side forming a helical structure. James Watson and Francis Crick first described this structure in 1953. [1]
target is solution takes place under condition that favours duplex formation. There are parameters like temperature, length and composition of the oligo, salt concentration, formamide concentration and mismatch percentage between the two complimentary oligonucleotides that affect the hybridization efficiency and stability of the hybrid. Depending on the type of hybdridization assay employed the effect of the above mentioned parameters vary slightly. In this thesis, the focus is on surface-based hybridization assays (DNA microarrays).
Figure 1.5 Melting curve of DNA
1.2.2.1 Nucleic Acid concentration
In theory, the rate of a reaction is proportional to the concentration of the reactants, i.e the concentration of the probe and the reactant. The overall reaction can be expressed in terms of depletion of target from the hybridization solution as:
[ ] [ p][ t] t
C C k dt
C
d =
− (1.1)
where –d[Ct] /dt is the rate at which target is depletes, k is the rate constant, [Cp] is the concentration of the probe and [Ct] is the target concentration. In theory the [Cp] is not known accurately since a proportion of probe is not available for nucleation. At low concentration of probes the rate limiting step is nucleation while as at higher probe concentration the hybridization occurs rapidly and depletes the surrounding solution of the target strands and the diffusion of target to the probe becomes the rate-limiting step of the reaction. In case of DNA microarrays the target is in excess and so the rate of hybridization depends only on the probe concentration. To increase the hybridization rate higher probe concentration can be used but target diffusion has to be increased using smaller volumes and short lengths of oligos.
1.2.2.2 Salt concentrationtions
1.2.2.3 Temperature
The hybridization rate increases with the increase in temperature. The maximum hybridization rate is reached about 20-25 oC below the melting temperature, Tm (the temperature at which 50% of the oligos are hybridized) of the hybrid and declines with further increase in the temperature. [3] Melting temperature for DNA: DNA hybrids in assays can be estimated by equation 1.2.
Tm = 81.5 oC – 16.6 (log10[M]) + 0.41(%G+C)- 0.63 (% Formamide) – 600/L (1.2) where [M] is the concentration of the monovalent cation, (%G+C) is the percentage of guanines and cytosines in the probe, (% Formamide) is the concentration of the formamide used in the hybridization solution and L is the chain length of the hybrid expressed in base pairs. The above equation holds true for [M] between 0.01-0.4 of monovalent cations and (%G+C) of 30-75 % and does not take base mismatch into account. As these relationships are derived from solution phase hybridization it can not predict the surface hybridizations accurately. It has been shown that in event of surface hybridization the Tm of the hybrid is lower than the solution. [4]
1.2.2.4 Length of the target
1.2.2.5 Formamide Concentration
An average decrease of 0.63 oC per 1% formamide in Tm is adopted for surface hybridization, from the calculated Tm for homopolymers hybrids in solution. Lowering the Tm of the hybrid by formamide can be useful since incubation at high temperature run the risk of thermal degradation of the targets and desorption of probes from the surface.
1.2.2.6 Composition of oligo
The rate of hybridization increases to a very small extent as the (%G+C) increases in the target. But the stability of the hybrid is influenced greatly by the composition of the target. The GC base pair binds with three hydrogen bonds while the AT has only two hydrogen bonds. Hence GC base pairs offer grater stability to the hybrid and the effect of (%G+C) is seen in equation 2.2. A variation of 2-3% in GC composition of a hybrid can
vary the melting temperature of the hybrid by 1 °C.
1.2.2.7 Mismatch Percentage
The rate of hybridization and Tm will be reduced in presence of mismatches. Studies suggest that the rate of formation of hybrid under normal conditions would be reduced by
a factor of two for every 10% mismatch [5] and the Tm reduces by 1 °C for every 1%
mismatch. The position of the mismatch base pair also affects the duplex stability and Tm.
1.2.2.8 Other Factors
(PEG) affect the hybridization kinetics and also the stability of the hybrid, but has not been studied extensively.
1.3 History of Hybridization Assay
With explosion of genomic information “one gene at a time” approach to gene expression had to be modified to accommodate monitoring of thousands of gene products simultaneously. Figure 1.6 shows the wealth of genetic information that can be procured from genetic analysis. Rapid sequencing of DNA for diagnostics and research purposes is the first level in understanding genomics. Functional genomics is the second means of gene expression analysis in which mRNA expression level is examined to identify target proteins and altering the gene expression in it. Proteomics – studying all the proteins expressed in a cell, is an excellent way to examine the proteins encoded by genes. Comparison of protein patterns in treated vs. untreated tissues can shed light on the disease causing proteins.
Flow of genetic information
Genomics DNA
Analysis of DNA sequence
Transcription
Functional Genomics mRNA
-Analysis of RNA expressed by a specific cell
Translation
Proteomics Protein
-Analysis of expressed proteins
Flow of genetic information
Genomics DNA
Analysis of DNA sequence
Transcription
Functional Genomics mRNA
-Analysis of RNA expressed by a specific cell
Translation
Proteomics Protein
-Analysis of expressed proteins
DNA hybridization analysis in an array format provides a broad-based screen of gene expression by filtering through thousands of genes to identify physiologically important ones and to help understand patterns of gene expression and how the genes are regulated.
1.3.1 Southern Blotting Hybridization Assay
Hybridization of nucleic acids by immobilizing DNA on a substrate was first carried out by Southern Blotting Hybridization Assay. In spot blotting, crude or purified mixture of DNA is spotted on the surface of a derivatized nylon membrane or flexible nitrocellulose membrane, immobilized and detected by hybridization. The target is first obtained by digestion of genomic DNA by restriction enzymes. Gel electrophoresis has superior resolution properties hence used for fractionating the fragments. The DNA fragments that have been size fractionated can be identified by gel electrophoresis. The purified fragments (targets) separated by gel methods are transferred to a membrane support and this is known as southern transfer. The targets are then immobilized by baking or UV-crosslinking. These imbolized targets are exposed to a labeled solution of probes and hybridization is detected by autoradiography
1.3.2 DNA Microarrays
concentrated sample, and rapid hybridization kinetics. Non-porous substrates also prevent absorption of reagents and analytes into substarte matrix. Solid substrates provide exceptional quality of microarrays through uniform surface attachment chemistry and provide access to parallel analysis. The three major techniques used in manufacture of microarray are photolithography, ink-jetting and mechanical microspotting. Any of these three techniques can be used to immobilize thousands of DNA molecules of known sequences (probe) on the solid substrate in a high density in an array pattern. The array is exposed to a solution of mixture of unknown fluorescent-labeled targets. After washing the excess, the microaaray is developed by Confocal Scanning devices to determine the hybridization centers. The fluorescent emission is converted into digital output by suitable detectors. By comparing the pattern of fluorescence obtained and the known probe positions, the sequence of unknown targets can be determined in the given microarray. Active research is being carried out to develop oligonucleotide detection system, which is highly sensitive, and use inexpensive probes and monitoring equipments. Chad A. Mirkin etal. has studied both homogeneous and heterogeneous assays and developed nanoparticle based colorimetric and scanometric detection of oligonucleotides in an array format.
References
1. Watson, J.D.C., F. H. C., Nature, 1953. 171: p. 737-738.
2. George H. Keller, M.M.M., DNA Probes. 1989: Macmillan Publishers Ltd. 3. Beltz, G.A., Jacobs, K. A., Eickbush, T. H., Cherbas, P. T., and Kafatos, F. C.,
Methods in enzymology, ed. L.G. R. Wu, and U. Moldave. Vol. 100. 1983: Academic Press, NY. 266.
CHAPTER 2
Detection of DNA hybridization on gold substrates by Polarization
modulation infrared reflection absorption spectroscopy
Abstract
Polarization modulation infrared reflection absorption spectroscopy (PM-IRRAS) was used to detect DNA hybridization on gold surfaces. Mixed monolayers of 6-mercapto-1-hexanol (MCH) and single stranded DNA (ssDNA) with a C6-SH 5’ modifier was first formed on the gold surface by co-deposition. Then hybridization with the complementary ssDNA strand was performed to obtain double stranded (dsDNA). The PM-IRRAS spectra obtained contained absorptive features indicative of DNA arising from the phosphodiester backbone and the purine and pyrimidine rings. An infrared signature of dsDNA was observed at 1655 cm-1 that was absent in the ssDNA spectra. This band permitted the distinction between ssDNA and dsDNA to be made thus allowing for the detection of DNA hybridization on gold surfaces by PM-IRRAS.
2.1 Introduction
The detection of DNA hybridization on surfaces is an area of intense current investigation. A number of methods have recently been employed for analysis of surface
hybridization including fluorescence,1-4 chronocoulometry,5-7 surface plasmon
resonance8,9 and colloidal labeling of nanoparticles.10-12 The hybridization of DNA on gold surfaces is of particular interest because of the wide use of self-assembled monolayers on gold. However, despite the well-developed application of grazing angle
Fourier transform infrared spectroscopy13,14 there has been no direct detection of DNA hybridization on self-assembled monolayers of DNA. There have been numerous
non-resonant16,21,25-31 and resonant Raman spectroscopy.32-36 These studies include
using vibrational spectroscopy to probe B, A, and Z DNA forms37-42 and to study drug
and protein binding to DNA.43-46 The vibrational spectra and energetics of the individual nucleic acids and the AT and GC base pairs have also been studied by
semiempirical and DFT calculations.47-49
Self-assembled monolayers (SAMs) of DNA are prepared as mixed monolayers from a co-deposition solution of 6-mercapto-1-hexanol and single stranded DNA
(ssDNA) followed by surface hybridization with the complementary ssDNA.50 Here we report the first direct detection of DNA hybridization on a gold surface using polarization modulation infrared reflection absorption spectroscopy (PM-IRRAS). . The advantages of PM-IRRAS are threefold. First, labeling of the DNA with fluorescent tags or radioisotopes is not required. This technique is also non-intrusive allowing quick determination of the presence of single stranded DNA (ssDNA) or double stranded DNA (dsDNA) on the surface without contaminating the sample with an electrochemical agent. Thirdly, this technique can distinguish between the A, B, and Z forms of dsDNA on the surface. Single-pass attenuated total reflection (ATR)-FTIR spectra were taken of the ssDNA and dsDNA samples to verify the modes obtained with PM-IRRAS. ATR-FTIR spectra were also taken at various levels of hydration to determine the degree of hydration of the DNA strands on the surface. These comparisons provide an experimental link between bulk samples and analytical applications for detecting 10 picomoles (based on the surface coverage of DNA and the sampling area of PM-IRRAS)
of DNA-drug interactions using surface-attached DNA. Density Functional Theory (DFT) calculations of the individual DNA bases and base pairs were performed to yield calculated frequency spectra of ssDNA and dsDNA that were in excellent agreement with experimentally observed bands.
2.2 Methods and Materials
2.2.1 DNA Monolayer Formation.
The mixed self-assembled monolayers (SAM) were prepared on clean polycrystalline gold deposited on a glass slide containing a chromium oxide passivation layer (Evaporated Films, Inc., cleaned with piranha solution (70% conc. H2SO4: 30%H2O2 (30%) (CAUTION, piranha solution reacts violently with organic chemicals)
and rinsed with millipore 18 MΩ deionized water (BARNSTEAD E-PURE). The
single-stranded DNA (ssDNA) (Applied Biosystems) probe strand was modified at the 5’ end with a C6-S-disulfide modifier (Applied Biosystems). The ssDNA was deprotected to
form the CSH linker as described elsewhere.10 A co-deposition solution of 6-mercapto-1-hexanol (MCH) (Sigma-Aldrich) and ssDNA (probe strand) was used to form the mixed SAM on the gold surface with a 0.10 mole fraction of ssDNA in a 1µM MCH
room temperature. The DNA modified gold substrate was then exposed to 1mM MCH solution in water for an hour. The schematic step by step deposition scheme is shown in
Figure 2.1 B. The gold slides were then rinsed with 18 MΩ deionized water and placed in
a 1X SSC (saline sodium citrate) (Fisher Scientific) at 65°C for one hour and then cooled
to room temperature over four additional hours with or without target ssDNA (exact complement to the probe ssDNA on the gold surface) for hybridization (2.5 nmol of
target ssDNA). The surfaces were then rinsed in 18 MΩ deionized water and dried with nitrogen gas. Both ssDNA strands were comprised of 30 bases and the probe strand had a sequence of 5’-GGAGACTGTTATCCGCTCACAATTCCACAC-3’ and the target ssDNA was the exact complement of the probe ssDNA strand. The solution hybridization mixture, containing the two complementary ssDNA strands (in 1X SSC), was heated to 85°C for five minutes and then cooled to room temperature for 30 minutes
to obtain dsDNA for solution FTIR measurements. The excess salt from the dsDNA solution was removed using Centricon YM-3 centrifugal filter units (Millipore) and 18 MΩ deionized water as the wash solvent.
5’ modified C6SH ssDNA
+ 1 mM MCH
Target DNA
+
5’ modified C6SHssDNA
Target DNA 1 mM
MCH
2.2.2 Polarization Modulation Infrared Reflection Absorption
Spectroscopy (PM-IRRAS)
The PM-IRRAS spectra were recorded on a Bio-Rad FTS 7000 spectrometer equipped with a step scan interferometer, liquid nitrogen cooled narrow band MCT detector, globar source, and a UDR-8 filter. The IR radiation was typically phase
modulated at frequencies of 400 or 800Hz at an amplitude of 1.0 or 2.0 λ HeNe while
stepping at 0.5 - 2.5 Hz. A gold grid polarizer was used to obtain either s- or p-polarized radiaton, which was then modulated by a Hinds ZnSe PEM operating at 37 KHz and
amplitude of 0.5 λ (strain axis 45 degrees to the polarizer) before reflecting off the
2.2.3 Density Functional Theory (DFT) Calculations.
The geometry optimization and vibrational frequency calculations of the individual DNA bases and complementary base pairs were done using the MSI (Molecular Simulations, Inc) quantum chemistry software program DMol3 at the North Carolina Supercomputer Center (NCSC) on either the IBM RS/6000 SP. DMol3 is an ab initio (first principles)
software package that utilizes density functional theory.51 These calculations were done in the gas phase using the DNP basis set, the GGA functional, and the method of finite differences for calculating the vibrational frequencies. The MSI software Insight II was used to build the models and to visualize the eigenvector projections of the vibrational modes of the models.
2.3 Results and Discussion
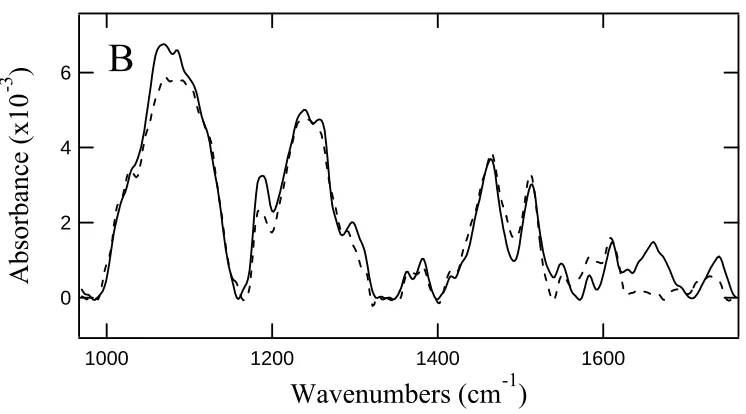
Figure 2.2 A and 2.2 B show the PM-IRRAS spectra corresponding to the mixed monolayer of MCH and ssDNA before and after hybridization with the complementary ssDNA with a hybridization temperature of 65°C and 85°C respectively recorded at an
incident angle of 80 degrees. The hybridization temperature was varied to obtain efficient hybridization while minimizing ssDNA strand loss from the gold surface. The ssDNA and dsDNA spectra contain absorptive features indicative of DNA for both temperatures. For instance, the modes centered at 1082 and 1238 cm-1 correspond to the
symmetric and asymmetric PO2- group of the DNA phosphodiester backbone.52,53 The
environment in the current PM-IRRAS configuration.54,55 The modes at 1464 and 1514
cm-1 result from the purine and pyrimidine (DNA bases) ring modes,52,53 while the region from 1600 – 1750 cm-1 is due to carbonyl (C=O), C=N stretching and exocyclic
-NH2 bending vibrations in the DNA bases.52,56 However, the intensities of these bands are not the same at 65oC and 85oC due to the quantity and orientation of the DNA on the surface. The intensity for the ssDNA and dsDNA spectra for 85°C is lower than the
corresponding spectra with a hybridization temperature of 65°C. This observation suggests that strand loss is occurring at the higher temperature due to thiolate desorption.
The major distinction between the PM-IRRAS spectra for ssDNA and dsDNA in Figures 2.2A and 2.2 B is the presence of a band at 1655 cm-1 in the dsDNA spectra, which is absent in the ssDNA spectra. This distinction is observed at both hybridization temperatures. The intensity change in this region represents changes in hydrogen bonding between complementary bases that occur upon formation of a double helix and the
quantity of DNA on the surface.52 The infrared signature at 1655 cm-1 of dsDNA thus permits the detection of DNA hybridization on gold surfaces by PM-IRRAS.
12 10 8 6 4 2 0
Absorbance (x10
-3
)
1600 1400
1200 1000
Wavenumbers (cm
-1)
6
4
2
0
Absorbance (x10
-3
)
1600 1400
1200 1000
Wavenumbers (cm
-1)
B
Figure 2.2 PM-IRRAS spectra of a mixed monolayer of 6-mercapto-1-hexanol and single stranded DNA before (dashed spectrum) and after hybridization (solid spectrum) with the complementary single stranded DNA strand to obtain double stranded DNA with a hybridization temperature of 65°C (A) or 85°C (B) recorded at an incident angle of 80 degrees.
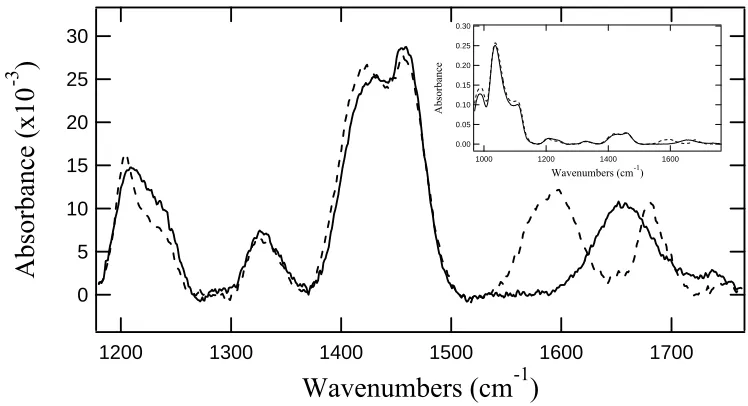
Figure 2.3 shows the single-pass ATR FTIR spectra of ssDNA and dsDNA strands in aqueous solution to verify the absorptive features observed in the PM-IRRAS spectra of ssDNA and dsDNA are due to these DNA species. These spectra contain similar features as seen in the PM-IRRAS spectra corresponding to these species on a gold surface. However the absorptive features present in Figure 2.3 for ssDNA and dsDNA are not identical due to the hydrogen bonding between complementary bases in
the dsDNA.52 The features can be assigned, as done above, to arising from the phosphodiester backbone and the purine and pyrimidine rings of the DNA bases. However, ssDNA has two modes in the high frequency region at 1594 and 1681 cm-1 that are replaced with a single mode at 1658 cm-1 in dsDNA. Therefore ssDNA and dsDNA can be distinguished in both solution and on the gold surface using infrared spectroscopy. The sample conditions under single-pass ATR-FTIR resemble those of a hydrated DNA
0.30 0.25 0.20 0.15 0.10 0.05 0.00
Absorbance
1600 1400 1200 1000
Wavenumbers (cm-1)
30 25 20 15 10 5 0
Absorbance (x10
-3
)
1700 1600
1500 1400
1300 1200
Wavenumbers (cm
-1)
Figure 2.3. Solution single-pass ATR FTIR spectra of single stranded DNA (dashed spectrum) and double-stranded DNA (solid spectrum) corresponding to the same DNA strands used for the probe and target single stranded DNA on the gold surfaces. The concentration of the DNA solutions was approximately 200mM. The inset shows the larger spectral range from 970 - 1760 cm-1.
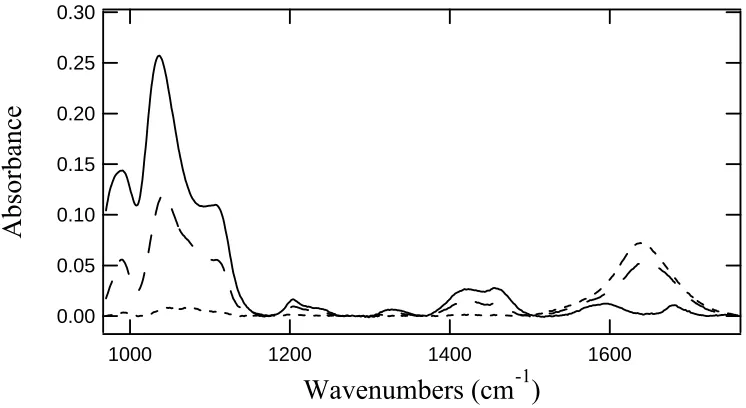
Figure 2.4 shows the single-pass ATR FTIR spectra of ssDNA in aqueous solution as a function of hydration to estimate the amount of hydration in the DNA monolayers on the gold surfaces. Initially, the bending vibration mode of water at 1638 cm-1 masks the carbonyl and amino hydrogen bonding region of the spectra and the other
0.30 0.25 0.20 0.15 0.10 0.05 0.00
Absorbance
1600 1400
1200 1000
Wavenumbers (cm
-1)
Figure 2.4. Solution single-pass ATR FTIR spectra of single stranded DNA recorded as a function of hydration and concentration in aqueous solution. The spectra correspond to least concentrated ~20 mM (- - -), more concentrated (-- -- --), and most concentrated ~200 mM (solid spectrum) of the single stranded DNA used as the probe strand on the gold surfaces. The most concentrated sample is nearly in a gel state.
25
20
15
10
5
0
Intensity
1800 1750
1700 1650
1600 1550
Wavenumbers (cm-1)
30
20
10
0
Intensity
1800 1750
1700 1650
1600 1550
Wavenumbers (cm-1)
B
20
15
10
5
0
Intensity
1800 1750
1700 1650
1600 1550
Wavenumbers (cm-1)
C
Figure 2.5. Dmol3 calculated frequency spectra of A. adenine (-- --), thymine (-- . --, and the adenine-thymine base pair (solid spectrum), B. guanine (-- --), cytosine (-- . --), and the guanine-cytosine base pair (solid spectrum), C. probe ssDNA before (dashed spectrum) and after hybridization (dsDNA) (solid spectrum) using the weighted average of the calculated spectra of either the individual bases or base pairs, respectively. All spectra have a Gaussian width of 20 cm-1.
1584, and 1629 cm-1 due mostly from NH2 bending (and some ring deformation). The thymine calculated spectrum has a mode at 1649 cm-1 due to C-C stretching and two modes at 1705 and 1756 cm-1 resulting from carbonyl stretching. The calculated spectrum of the AT base pair resulted in four modes at 1605, 1655, 1676, and 1754 cm-1. The modes at 1605 and 1655 cm-1 result from NH2 bending, the mode at 1642 cm-1 is a ring deformation mode, the mode at 1676 cm-1 results from N-H bending, while the mode at 1754 cm-1 results from a carbonyl stretching motion. These spectra illustrate a blue shift of the NH2 bending modes upon base pair formation due to hydrogen bonding which involves this group. The NH2 bending motion of adenine becomes more constrained in the base pair and hence the frequency of the NH2 bend increases. The carbonyl stretching frequency of the carbonyl group of thymine involved in hydrogen bonding in the AT base pair decreases in frequency upon base pair formation. This red shift is the result of a weakening of the C=O force constant due to hydrogen bonding. The other carbonyl stretching frequency of thymine decreases minimally since this carbonyl group is not involved in hydrogen bonding with adenine in the AT base pair. These shifts are in
qualitative agreement with previous semiempirical calculations.47
shows six modes at 1565 (NH2 and N-H bending, carbonyl stretching), 1628 and 1634 (primarily NH2 and N-H bending, small component of carbonyl stretching and ring deformation), 1676 (NH2 bending, carbonyl stretching), and 1684 and 1717 cm-1 (NH2 and N-H bending, carbonyl stretching). Similar to the calculated spectrum of the AT base pair relative to the spectra of the individual bases, the GC calculated spectrum shows a blue shift in the NH2 (and N-H) bending frequency and a red shift in the carbonyl stretching frequency for those groups involved in hydrogen bonding in the GC base pair relative to the individual bases.
2.4 Conclusion
Polarization modulation infrared reflection absorption spectroscopy (PM-IRRAS) was successfully used to detect DNA hybridization on a gold surface. The most pronounced spectral changes between ssDNA and dsDNA are in the nucleobase hydrogen bonding region from 1550 cm-1 to 1720 cm-1. Surface hybridization was detected by an increase in absorption intensity at 1655 cm-1 in dsDNA. Comparison of the single-pass ATR-FTIR spectra of ssDNA solutions with the PM-IRRAS method showed that a minimal amount of water was present in the DNA monolayers on gold due
to the absence of the water bending mode, νH-O-H, at 1638 cm-1 in the PM-IRRAS spectra.
This observation is significant because, if present, νH-O-H masks the region of the DNA spectrum that contains the most information. The spectral features of surface attached
DNA are similar to those of fiber DNA at low humidity. 54 However, ssDNA does not form fibers and thus the conversion of ssDNA to dsDNA cannot be detected by FTIR spectroscopy so that the observed spectral changes associated with hybridization reported here are unique. The PM-IRRAS spectra were in excellent agreement with DFT calculated spectra of dsDNA and ssDNA. The calculated frequency spectra of the DNA bases and base pairs show that the difference between ssDNA and dsDNA results from the blue shift of the NH2 and N-H bending modes and a red shift in the carbonyl stretching frequency due to hydrogen bonding between the complementary bases. These changes permit detection of DNA hybridization on samples for which the surface
coverage. These results suggest that the PM-IRRAS technique can be used to observe binding events to surface-immobilized DNA or RNA. The fact that A-form structure is observed in the spectra presented here indicates that the current configuration can be used directly to observe binding events to surface-immobilized RNA. The PM-IRRAS method can be used in theory in high humidity conditions favoring B-form DNA. Thus, in addition to the detection of DNA hybridization, PM-IRRAS has the potential for use in the study of protein and drug binding to RNA and DNA.
Acknowledgements
This work was done in collabration with Stefan Franzen, Scott Brewer, Simon Lappi and David Draphco and was the subject of publication, in Langmuir, 2002. Selina Moses was supported by Applied Biosystems Ltd.
References
1)Fodor, S. P. A.; Read, J. L.; Pirrung, M. C.; Stryer, L.; Lu, A. T.; Solas, D. Science 1991, 251, 767-773.
2)Lockhart, D. J.; Winzeler, E. A. Nature 2000, 405, 827-836.
3)Bulyk, M. L.; Gentalen, E.; Lockhart, D. J.; Church, G. M. Nature Biotechnology 1999, 17, 573-577.
4)Chee, M.; Yang, R.; Hubbell, E.; Berno, A.; Huang, X. C.; Stern, D.; Winkler, J.; Lockhart, D. J.; Morris, M. S.; Fodor, S. P. A. Science 1996, 274, 610-614.
5)Esch, M. B.; Locascio, L. E.; Tarlov, M. J.; Durst, R. A. Anal. Chem. 2001, 73, 2952-2958.
6)Steel, A. B.; Herne, T. M.; Tarlov, M. J. Anal. Chem. 1998, 70, 4670-4677.
7)Steel, A. B.; Herne, T. M.; Tarlov, M. J. Bioconjugate Chemistry 1999, 10, 419-423. 8)He, L.; Musick, M. D.; Nicewarner, S. R.; Salinas, F. G.; Benkovic, S. J.; Natan, M. J.; Keating, C. D. J. Am. Chem. Soc. 2000, 122, 9071-9077.
9)Brockman, J. M.; Frutos, A. G.; Corn, R. M. J. Am. Chem. Soc. 1999, 121, 8044-8051. 10)Sauthier, M.; Carroll, R.; Gorman, C.; Franzen, S. Langmuir 2001, in press.
12)Demers, L. M.; Mirkin, C. A.; Mucic, R. C.; Reynolds, R. A.; Letsinger, R. L.; Elghanian, R.; Viswanadham, G. Anal. Chem. 2000, 72, 5535-5541.
13)Allara, D.; Nuzzo, R. Langmuir 1985, 1, 52-66. 14)Allara, D.; Nuzzo, R. Langmuir 1985, 1, 45-52.
15)Chin, S.; Scott, I.; Szczepaniak, K.; Person, W. B. J. Am. Chem. Soc. 1984, 106, 3415-3422.
16)Delabar, J. M.; Majoube, M. Spectrochim. Acta 1978, 34A, 129-140.
17)Falk, M.; Hartman, K. A.; Lord, R. C. J. Am. Chem. Soc. 1963, 85, 387-391.
18)Graindourze, M.; Smets, J.; Zeegers-Huyskens, T. H.; Maes, G. J. Mol. Struct. 1990, 222, 345-364.
19)Hirakawa, A. Y.; Okada, H.; Sasagawa, S.; Tsuboi, M. Spectrochim. Acta 1985, 41A, 209-216.
20)Kyogoku, A. Y.; Higuchi, S.; Tsuboi, M. Spectrochim. Acta 1967, 23A, 969-. 21)Lewis, T. P.; Miles, H. T.; Becker, E. D. J. Phys. Chem. 1984, 88, 3253-3260. 22)Thijs, R.; Zeeger-Huyskens, T. Spec. Acta 1984, 40A, 307-313.
23)Thomas Jr., G. J. Biopolymers 1969, 7, 325-334.
24)Tsuboi, M.; Kyogoku, Y.; Shimanouchi, T. Biochim. Biophys. Acta 1962, 55, 1-12. 25)Tsuboi, M.; Takahashi, S.; Harada, I. Infrared and Raman spectra of nucleic acids - Vibrations in the base residues; Tsuboi, M.; Takahashi, S.; Harada, I., Ed.; Academic Press: Lodon, 1973; Vol. 2, pp 92-143.
26)Lane, M. J.; Thomas Jr., G. J. Biochemistry 1979, 18, 3839-3846. 27)Lord, R. C.; Thomas Jr., G. J. Spectrochim. Acta 1967, 23A, 2551-2591. 28)Lord, R. C.; Thomas Jr., G. J. Biochim. Biophys. Acta 1967, 142, 1-11.
29)Nishimura, Y.; Tsuboi, M.; Nakano, T.; Higuchi, S.; Sato, T.; Shida, T.; Uesugi, S.; Ohtsuka, E.; Ikehara, M. Nucl. Acids Res. 1983, 11, 1579-1588.
30)Nishimura, Y.; Tsuboi, M.; Sato, T. Nucl. Acids Res. 1984, 12, 6901-6908.
31)Peticolas, W. A.; Kubasek, W. L.; Thomas, G. A.; Tsuboi, M. Nucleic Acids; Peticolas, W. A.; Kubasek, W. L.; Thomas, G. A.; Tsuboi, M., Ed.; John Wiley and Sons: New York, 1987; Vol. 1, pp 82-133.
32)Ziegler, L. D.; Hudson, B.; Strommen, D. P.; Peticolas, W. L. Biopolymers 1984, 23, 2067-2081.
33)Tsuboi, M.; Nishimura, Y.; Hirakawa, A. Y.; Peticolas, W. L. Resonance Raman spectroscopy and normal modes of the nucleic acid bases; Tsuboi, M.; Nishimura, Y.; Hirakawa, A. Y.; Peticolas, W. L., Ed.; John Wiley and Sons: New York, 1988; Vol. 2, pp 109-179.
34)Toyama, A.; Takino, Y.; Takeuchi, H.; Harada, I. J. Am. Chem. Soc. 1993, 115, 11092-11098.
35)Toyama, A.; Kurashiki, E.; Watanabe, Y.; Takeuchi, H.; Harada, I. J. Am. Chem. Soc. 1991, 113, 3615-3616.
36)Fodor, S. P. A.; Rava, R. P.; Hays, T. R.; Spiro, T. G. J. Am. Chem. Soc. 1985, 107, 1520-1529.
42)Thamann, T. J.; Lord, R. C.; Wang, A. H. J.; Rich, A. Nucl. Acids Res. 1981, 9, 5443-5457.
43)Lu, D. S.; Nonaka, Y.; Tsuboi, M.; Nakamoto, K. J. Raman Spec. 1990, 21, 321-326. 44)Takeuchi, H.; Sasamori, J. Biopolymers 1995, 35, 359-367.
45)Hud, N. V.; Milanovich, F. P.; Balhorn, R. Biochemistry 1994, 33, 7528-7535. 46)Grygon, C. A.; Spiro, T. G. Biochemistry 1989, 28, 4397-4402.
47)Hrouda, V.; Florian, J.; Hobza, P. J. Phys. Chem. 1993, 97, 1542-1557. 48)Florian, J.; Leszczynski, J.; Johnson, B. G. J. Mol. Struc. 1995, 349, 421-426.
49)Guerra, C.; Bickelhaupt, F.; Snijders, J.; Baerends, E. J. Am. Chem. Soc. 2000, 122, 4117-4128.
50)Herne, T. M.; Tarlov, M. J. J. Am. Chem. Soc. 1997, 119, 8916-8920. 51)Delley, B. J. Phys. Chem. 1990, 92, 508-517.
52)Tsuboi, M. Prog. Theor. Phys. Supp. 1961, 17, 99-107.
53)Falk, M.; Hartman, K. A.; Lord, R. C. J. Am. Chem. Soc. 1963, 85, 391-394. 54)Taillandier, E.; Liquier, J. Methods Enz. 1992, 211, 307-335.
55)Taillandier, E.; Liquier, J.; Ghomi, M. J. Mol. Struct. 1989, 214, 185-211.
CHAPTER 3
3.1 Introduction to nanoparticles
3.1.1 Optical and redox properties of nanoparticles
Metal nanoparticles have been investigated widely since the studies of colloidal gold by Faraday in the 1800s[1]. The size, shape and composition of the nanoparticles influence their properties [2] . Properties of nanoparticles are different from their bulk counterparts due to the reduced dimensionality and modification of functional properties. The conduction band present in the bulk is absent in nanometals in the case of metallic nanoparticles but there are discrete states at the band edge of the particles. Also depending on the size, shape and the interatomic distance, the free electrons oscillate at a particular frequency. In case of gold colloids, these electrons at the surface of the colloid can absorb electromagnetic radiation that matches with the frequency of oscillation of the conduction electron and exhibit a strong absorbance band called the Surface plasmon band in the visible spectrum. The plasmon frequency band is present around 520 nm for gold nanoparticles but for very small particles of size 2 nm, it disappears. Also for bigger particles the plasmon band shifts to a higher wavelength. This is the test for aggregation of gold colloid as the color of the gold nanopartcles turns from pink to blue. As clusters of bigger particles are formed the plasmon band shifts.
Semiconductor nanoparticles like CdSe or CdS called “quantum dots” can also be functionalized with streptavidin or carboxylates for biological applications. Their fluorescence quantum yields are higher compared to conventional fluorescent dyes reducing the limit of detection.
The properties of nanoparticles make them interesting tools in biology, optics and for labeling chemistry. Gold colloids have been extensively used for DNA hybridization, [3] [4, 5] [6] protein assays [7], immunoassays [8, 9][10] [11], cell targeting and delivery [12]. One of the important areas of application of the properties related to aggregation of metallic nanoparticles is for the analyte detection. The plasmon band of monomer gold nanoparticles is near 520 nm and a solution has a dark pink color. Upon aggregation due to addition of salt the solution turns to blue or purple. The origin of this effect is the reduction in the Debye length 1/κ that permits closer approach of the nanoparticles. According to Derjaguin-Landau-Verwey-Overbeek (DLVO) theory the reduced electrostatic repulsion tips the balance of the potential energy in favor of the attractive van der Waal's term resulting flocculation and aggregation. A blue color is also observed when colloidal gold aggregates in response to the addition of an analyte in the case of
3.1.2 Stability of colloids
Nanoparticles are colloids dispersed in fluid suspensions. The stability of the the colloids is determined by the balance of three forces – van der Waals attraction, electrostatic repulsion and the randomizing thermal energy. Mutual dipole interactions (Van der Waals attraction) due to the polarizibility of the colloid cause the colloids to flocculate and aggregate over time. Derjaguin, Landau, Verwey and Overbeek proposed (DLVO theory) that the electrostatic charge on the surface of colloids will cause repulsive interaction and prevent aggregation. This repulsive force keeps the colloids stable [13]. According to DLVO theory, the van der Waals attraction due to the polarizibilty of the colloids is compenasated by the electrostatic repulsion due to the
electrical double layer between the two colloids. The electrostatic repulsion varies as e-κr
and van der waals attraction varies as r-2. The electrical double layer prevents the colloids from coming near the vicinity of each other where the attractive forces can draw them together. But in some conditions the electrical double layer reduces in thickness causing the van der Waals attraction to be the predominant force causing aggregation of colloids. The conditions for flocculation is given by the Debye equation
x=(εT/8πne2ν2)1/2 3.1
where ε is the dielectric constant of the solution , T is the temperature, n is the
concentration of the salt present and ν is the valence of the salt. According to the equation 3.1 a high concentration of salt of high valence will cause the colloids to flocculate by reducing the Debye length.
stabilizer that is used to stabilize gold colloid with a weakly binding layer of charged ligands. Citrates can be easily replaced by more stable chemical entities like mercaptoalkanoic acids, thiols and mercaptoalkylamines. [14-16] [17]
Other charged molecules used for stabilizing gold colloid by electrostatic interaction are Bis(p-sulfonatophenyl)- phenylphosphine (BSPP) and mercaptoundeconoic acid (MUA). Gold colloids labeled with oligonucleotides are used in the DNA-array based detection systems [18]