*
Comparison of edge detection techniques for M7 subtype
Leukemic cell in terms of noise filters and threshold value
Afifah Salmi Abdul Salam1,*, Mohd. Nazrin Md. Isa 1, Muhammad Imran Ahmad1 and Rizalafande Che Ismail11School of Microelectronic Engineering, University Malaysia Perlis, Pauh Putra Campus, 02600, Arau, Perlis, Malaysia
2School of Computer and Communication Engineering, University Malaysia Perlis, Pauh Putra Campus, 02600, Arau, Perlis, Malaysia
Abstract. This paper will focus on the study and identifying various threshold values for two commonly used edge detection techniques, which are Sobel and Canny Edge detection. The idea is to determine which values are apt in giving accurate results in identifying a particular leukemic cell. In addition, evaluating suitability of edge detectors are also essential as feature extraction of the cell depends greatly on image segmentation (edge detection). Firstly, an image of M7 subtype of Acute Myelocytic Leukemia (AML) is chosen due to its diagnosing which were found lacking. Next, for an enhancement in image quality, noise filters are applied. Hence, by comparing images with no filter, median and average filter, useful information can be acquired. Each threshold value is fixed with value 0, 0.25 and 0.5. From the investigation found, without any filter, Canny with a threshold value of 0.5 yields the best result.
1 Introduction
Leukemia cells in humans are growing rapidly each year. In 2016, statistics show that 24,400 people are expected to die from this disease [1] Leukemia is one of the deathly diseases amongst humans and it is known as a bone marrow disorder. This disease involves abnormalities of white blood cells proliferation that disables the cells to function normally [2].This disease is grouped by how quickly the illness develops. It can be either acute or chronic [3].
In addition, Leukemias are grouped by affected blood cell type (lymphocytes or myelocytes). This disease can be categorized into four main types which includes acute lymphocytic leukemia (ALL), chronic lymphocytic leukemia (CLL), acute myelocytic leukemia (AML) and chronic myelocytic leukemia (CML) [4]. Each leukemia type has its particular properties or shape to differentiate them from others. Acute Leukemia grows briskly which can invade the body within a few weeks or months. Chronic Leukemia on the other hand, takes time growing but progressively worsens over the years.
Acute myelocytic leukemia (Fig.1) is a heterogenous group of clonal disorders which is usually not detected until it has spread into other organs. AML is classified by a system known as French-American British (FAB) classification which is categorized into eight subtypes, namely M0 until M7[5].
Fig.1. Acute Myelocytic leukemia (AML)
Table 1. French-American-British Classification [6]
FAB
SUBTYPE NAME
M0 Undifferentiated acute myeloblastic leukemia M1 Acute myeloblastic leukemia with minimal
maturation
M2 Acute myeloblastic leukemia with maturation
M3 Acute promyelocytic leukemia (APL)
M4 Acute myelomonocytic leukemia
M4 eos Acute myelomonocytic leukemia with eosinophilia
M5 Acute monocytic leukemia
M6 Acute erythroid leukemia
Table 1 shows the subtypes of AML
classification. Each subtypes varies in properties like the size and number of leukemia cells. The usage of edge detection becomes a major part in detecting these changes of cell shape. M7 subtypes have been
distinguished over the years by the uses of cytochemical and morphological criteria which were found lacking [7]. Moreover it has been found that 3-10% of primary childhood AML and children may consists varieties of symptoms such as low-grade fever, diarrhea and easy bruising[8]. Studies have been conducted that this type of leukemia is usually abnormally abundant in children with Down Syndrome cases.
Image segmentation (Preprocessing) is one of the crucial steps in an automatic leukocyte recognition system[9]. This is because the last two steps after segmentation depends greatly on the result of segmentation. Edge detection is part of image segmentation. Edge detection contains significant information. It reduces the image size and filters out information that are less convenient [10]. Edges typically occur on the boundary between two different region in an image [11]. Frequently, this detection is the first step in recovering information from images. Detecting edges greatly rely on the noise, intensity, brightness and blur. Thus, by working with different edges of the same image, differences can be observed and the selected suitable algorithm will be chosen to further to the next stage of image processing (feature extraction). Edge detection can come with a threshold value which functions to detect edges. Typically the lower the threshold value, more edges can be detected [12]. However, it is not necessarily that many edges found can make an image looks great. Due to it’s advantages, edge detection continues to be an active research area.
Thus, this paper will study different edge detection techniques (Sobel and Canny) which then will be compared with one another to select which is the best techniques to be applied on detecting edges on an M7 subtype leukemic cell (Figure 2). The system should able to recognize the cell pattern and shape. A threshold value of 0, 0.25 and 0.5 will be chosen. The threshold value will determine how many edges are available to be detected in an image. Filters (median and averaging) which is for noise removal will also be studied to find which is the most suitable filter to minimise/remove noise filters. The sofware to implement this project will be MATLAB 2014a.
Fig.2. M7 subtype of AML cell
2
Proposed methodology
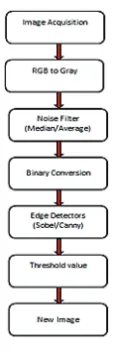
Fig.3. Flowchart of the whole system
Figure 3 shows the overall flowchart of the edge detection system, starting from image acquisition until new image is achieved. Since the highlight of this paper is about noise filter, edge detection and threshold value, thus the next subsequent section will explain briefly about these three things.
3 Noise Filter
Filtering is removing some frequencies in order to suppress interfering signals and reduce background noise [13]. In other words, filtering is a device or process that removes signal of unwanted component or feature. Filters can come in high pass or low pass depending on the amount of noise needs to be filtered. This paper involves noise removing using low pass filter of averaging filter and median filter.
Average filter or mean filter functions to smooth the image into non-noise image [14]. The smoothing filters are used for image blurring and noise reduction in spatial domain.
Median filter is a nonlinear image processing operation used to remove the impulsive noise from images [15]. They are most preferred against impulsive noise due to their robustness and denoising power.
4
Edge detection
Table 2. Advantages and Disadvantages of Sobel and Canny [12]
Edge
Detection Advantages Disadvantages
SOBEL -Simplicity - Detection of edges and their
orientations
- Sensitivity to noise - Inaccurate
CANNY
- Improving signal to noise ratio - Better detection especially in noise detection - Good for finding error rate
- Complex computation - False zero crossing -Time consuming
Table 2 shows the pros and cons of each edge detection. Aforementioned that edge detection varies in algorithm, thus the table shows how important it is to choose a correct detection that fit best to the application.
4.1. Sobel edge detector
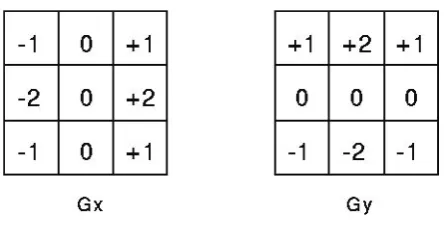
The function of Sobel edge detector is for detecting vertical and horizontal edges in an image known as Gx and Gy [16]. It also combines information into a single matrix. The operator consists of 3x3 convolution kernels by which one kernel is simply rotated by 90° by the other as shown in Figure 2 [11].
Fig.4. Sobel Masks
The kernels can be joined together to find the absolute magnitude and the orientation of the gradient as shown in Equation (1).
|𝑮𝑮| = √𝐺𝐺𝐺𝐺² + 𝐺𝐺𝐺𝐺²
(1)
4.2 Canny Edge detector
Canny edge detection is also known as the optimal edge detector [16], which satisfies all of the performance criteria. Canny comes in several steps as follow [11, 12], [16-18]:
1. Gaussian filtering for noise removal 𝑮𝑮𝑮𝑮 = 1
√2𝜋𝜋𝜋𝜋² 𝑒𝑒𝐺𝐺𝑒𝑒[− 𝑚𝑚2+𝑛𝑛2
2𝜋𝜋2 ] (2)
2. Finding the intensity and gradient of image whereby it uses four filters to find out the vertical, horizontal and diagonal edges to find the blurred image.
𝑴𝑴(𝒎𝒎, 𝒏𝒏) = √𝑔𝑔2𝑚𝑚(𝑚𝑚, 𝑛𝑛) + 𝑔𝑔²𝑛𝑛(𝑚𝑚, 𝑛𝑛) (3) and
𝜽𝜽 = 𝑡𝑡𝑡𝑡𝑛𝑛 ͞ ¹ [𝑔𝑔𝑛𝑛(𝑚𝑚,𝑛𝑛)
𝑔𝑔𝑚𝑚(𝑚𝑚,𝑛𝑛)] (4)
3. Non maximum suppression for thinning of the edge. 4. Double threshold to get rid of spurious responses from bothering factors such as noise and colour variation. 5. Track edge by hysteresis to achieve accurate result by getting rid of weak edges caused by latter reasons. To track down the edge connection, Binary Large Object analysis is applied by looking at weak edge pixel and its 8-connected neighbourhood pixels.
5 Threshold
The aim of threshold is to determine which pixels fall into each category [19]. A straightforward thresholding method uses a single value of intensity and relying on it, every pixel can belong to one of two categories:
a. Low intensity of pixel = pixel set to black b. High intensity of pixel = pixel set to white
In Matlab, BW = edge(I,’edge’,thresh) is one of the easiest method to detect edge by using threshold. The thresh specifies the sensitivity threshold for the particular edge method [13]. If the thresh is not specify or empty, edge chooses the value automatically. In this paper a threshold value of 0, 0.25 and 0.5 are used to compare which value gives out the best effect of M7 subtypes of AML.
6 Experiments
This section explains the experiment that has been conducted to find which threshold values (0, 0.25 and 0.5) and noise filters that gives the best result for either Sobel edge detector or Canny edge detector in finding the M7 subtype AML cell. The image is obtained from clinicalflow website. The experiment starts with the test of these two operators with no filters then followed by testing with averaging noise filters and median filters. The difference between each images are tabulated in Table 3 and Table 4 of this section.
6.1 Sobel operator with no filter
(a) (b) (c)
6.2 Canny operator with no filter
(a) (b) (c)
Fig.6. (a)Threshold 0 of canny, (b)Threshold 0.25 of canny, and (c) Threshold 0.5 of canny
6.3 Sobel operator with averaging filter
(a) (b) (c)
Fig.7. (a) Threshold 0 of sobel averaging filter, (b) Threshold 0.25 of sobel averaging filter and (c) Threshold 0.5 of sobel averaging filter
6.4 Canny operator with averaging filter
(a) (b) (c)
Fig.8. (a)Threshold 0 of canny averaging filter, (b) Threshold 0.25 of canny averaging filter and (c) Threshold 0.5 of canny averaging filter
6.5 Sobel operator with median filter
(a) (b) (c)
Fig.9. (a)Threshold 0 of sobel median filter, (b) Threshold 0.25 of sobel median filter and (c) Threshold 0.5 of sobel median filter
6.6 Canny operator with median filter
(a) (b) (c)
Fig.10. (a) Threshold 0 of canny median filter, (b) Threshold 0.25 of canny median filter and (c) Threshold 0.5 of canny
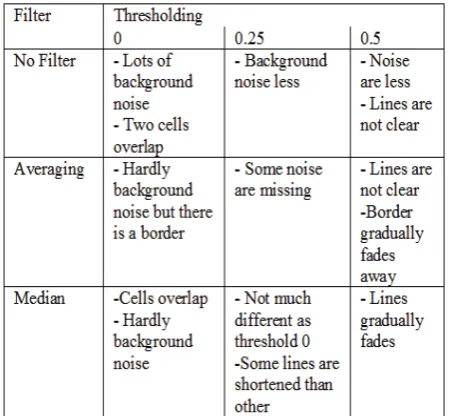
Figure 5 to 10 shows the results of one image of M7 that has been tested with different values of threshold, noise filters and edge detection (Sobel and Canny). Table 3 and 4 shows the overall result of M7 subtypes AML image with different edge detection techniques, thresholding and filter. From Table 3 that shows the result of Sobel edge detection, it proves that noise will decrease as threshold increase. However, the edge lines will gradually disappear as threshold increase. For Table 4, for non-filtering cases of Canny using threshold 0.5, the cell looks much clearer with only a few noise left and two cells overlap but are able to identify that they are different because the overlapping case does not make much difference. Overall, with average filter when there is no threshold, the image will produce a border but gradually fades as threshold increase. Other than that, Sobel edge’s line fades as threshold increase but for Canny, the edge still maintains with an increase sharpness of line. This is due to Canny edge detection having to do double threshold and finding intensity and gradient of image.
Table 3. Overall result for Sobel edge Operator
7 Conclusion
Briefly, this paper is about finding suitable edge detection techniques (Sobel and Canny) for M7 subtype AML to further on the next step of image processing after segmentation step, which is feature extraction. The image is tested with different threshold values (0, 0.25, and 0.5) and filters (averaging filter and median filter) to give out the best result. Based on the obtained results, without any filter and a threshold of 0.5, canny edge detection is suitable to be picked since noise decreases greatly compare to Sobel. With the factor of threshold as mentioned in [12], 0.5 value is apt in producing clear edge lines because the value is not too high and too low. Also aforementioned with its ability to give better detection in terms of noise detection, Canny also filters noise earlier in one of it steps hence it does not require additional filter to remove the noise. Albeit that there are still one or two background noises left, Canny managed to produce a clearer edge line compare to Sobel. For future reference it is good to try on different low pass filter so that the background noise will completely be removed and solve the problem of overlapping cell cases.
References
1. https://www.lls.org/http%3A/llsorg.prod.a cquia-sites.com/facts-and-statistics/facts- and-statistics-overview/facts-and-statistics. [Accessed: 14-Mar-2017].
2. S. Mohapatra, D. Patra, and S. Satpathy, Neural. Comput. Appl., 24, no. 7–8, pp. 1887–1904, (2014)
3. http://www.medicinenet.com/leukemia/article.htm. [Accessed: 14-Mar-2017].
4. http://www.empowher.com/leukemias/content/type s-leukemia. [Accessed: 14-Mar-2017].
5. H. Mahmood et al., J. Hematop., 7, no. 1, pp. 3–8, (2014)
6. https://www.cancer.org/cancer/acute- myeloid-leukemia/detection-diagnosis-s classified.html. [Accessed: 15-Mar-2017].
7. a Carroll et al., Blood, 78, no. 3, pp. 748–752, (1991)
8. P. D. Mueller and W. S. Korey, Iran. J. Paediatr. Haematol. Oncol., 4, no. 4, pp. 7–10, (1998) 9. G. Gu and D. Cui, Comput. Informatics, 30, no. 1,
pp. 189–199, (2011)
10. Y. Zheng, J. Rao, and L. Wu, 2010 5th Int. Conf. Comput. Sci. Educ. (ICCSE), pp. 471–473, (2010)
11. V. Sucharita, S. Jyothi, and D. M. Mamatha, Int. J. of Comp. Applications, 78, no. 6, pp. 1–5, (2013) 12. G. T. Shrivakshan and C. Chandrasekar, Int. J.
Comput. Sci. Issues, 9, no. 5, pp. 269–276, (2012)
13. B. Poornima, Y. Ramadevi, and T. Sridevi, Int. J. of Eng. Science and Technology (IJEST), 3, no. 4, pp. 400–403, (2011)
14. C. M. Tsai and Z. M. Yeh, Proc. - 2012 Int. Symp. Comput. Consum. Control. IS3C 2012, no. 1, pp. 153–156, (2012)
15. L. A. Aranda, P. Reviriego, and J. A. Maestro, IEEE Trans. Nucl. Sci., X, no. X, pp. 1–1, (2017)
16 V. G. Narendra and K. S. Hareesh, Int. J. of Agricultural and Biological Eng. 4, no. 2, (2011) 17. K. Ogawa, Y. Ito, and K. Nakano, 2010 First
Int. Conf. Netw. Comput., pp. 279–280, (2010) 18. T. Nadu and T. Nadu, 2nd International Conference
on Electronics and Communication Systems (ICECS 2015), pp. 282–285, (2015)
![Table 1. French-American-British Classification [6]](https://thumb-us.123doks.com/thumbv2/123dok_us/8125356.1353914/1.595.308.515.438.580/table-french-american-british-classification.webp)