P a g e 1 | 50
The impact of working relationships in the accounting and audit cycle
Reza mohammadi1
[Department of accounting group , Kerman Unit , Islamic Azad university, Kerman , Iran][ Correspondence:
Abstract
This study evaluates literature on the wheel of audit partners in Chinese companies and institutions by examining the impact of relationships before and after the rotation between the input and output partners. We consider the partners in the rotation before the rotation, before the work relationship. We find two different results from the previous working relationships: (a) increasing the likelihood of the outgoing partners after the cooling period, and (b) reducing the quality of the audit and lower accounting after the rotation. These findings ask whether the rotational partners are truly independent of the working relationships.
Keywords:, Audit quality , Previous working relationship , Audit and audit cycle
Introduction
countries, especially after the major corporate collapsess uch as Enron and WorldCom in the United States, have expressed great concern about the detrimental effect of long audit tenure on audit quality (e.g., China Securities Regulatory Commission, 2003; Commission on Public Trust and Private Enterprise, 2005; Securities and Exchange Commission, 1994). This is because auditor-client relationships can become increasingly close as audit tenures are extended, leading auditor independence and audit quality to erode (Dopuch, King, & Schwartz, 2001; Mautz & Sharaf, 1961). One potential way to address this concern is to rotate audit
1Reza mohammadi, accounting group , Kerman Unit , Islamic Azad university, Kerman , Iran
*
P a g e 2 | 50 partners or audit firms, an idea that has been proposed frequently in recent years. That is, regulators can set an upper bound for audit partner tenure or audit firm tenure. Many jurisdictions, including Australia, China, France, Germany, Taiwan, the United Kingdom, and the United States, have in fact placed limitations on the
length of audit partner tenure. However, very few have restricted the length of audit firm tenure (Lennox, Wu, & Zhang, 2014).23 This is mainly because requiring audit firm rotations would significantly increase audit costs and create unintended consequences such as poorer audit quality (American Institute of Certified Public Accountants, 2011).
Given the prevalence of mandatory audit partner rotation worldwide, recent studies take it as a key agenda to examine the effectiveness of this policy. However, identifying audit partner rotations, which requires acquisition of partner names, is the main constraint in performing such examinations as most countries do not require disclosing the individual information of audit partners. As far as we know, only a few studies have explored this issue. For example, using a sample of firms from Taiwan, where a five-year audit partner rotation came into force in 2004, Chi, Huang, Liao, and Xie (2009) investigate the effect of mandatory audit partner rotation on audit quality. They do not find consistent evidence that mandatory audit partner rotation improves audit quality. Lennox et al. (2014) , by using a proprietary dataset of audit adjustments in China, show that audit quality significantly improved in the years immediately surrounding mandatory audit partner rotation.
It is worth noting that most of the prior studies treat all rotations as homogeneous in the role of shaping audit quality. One exception is a recent work by Firth, Rui, and Wu (2012a), who find that Chinese firms with mandatory audit partner rotations are associated with a significantly higher probability of receiving modified audit opinions than firms without mandatory audit partner rotations, and such an association is limited to the firms located in regions with weak legal institutions.
2 European legislation to reform the statutory audit market was adopted in April 2014. According to the new rules, European firms classified as public interest entities (PIEs) will
be required to change their audit firms every ten years as a maximum.
http://dx.doi.org/10.1016/j.intacc.2017.04.003
P a g e 3 | 50 Enlightened by Firth et al. (2012a), we decide to examine the changes in audit quality around mandatory audit partner rotations conditioning on whether there are previous working relationships between outgoing and incoming audit partners.4 We expect that the previous working relationships between outgoing and incoming audit partners would impair the independence of incoming audit partners, thus inhibiting the ability of a rotation to result in a fresh perspective, which is the main benefit of partner rotations. The research perspective of our study, i.e., the relationship between rotating audit partners, is proposed based on the guanxi theory. In China, guanxi means interpersonal connections (Xin & Pearce, 1996). Once guanxi is established between two persons, each can ask a favor of the other with the expectation that the debt incurred will be repaid sometime in the future (Yang, 1994). Several studies show that guanxi can affect the behavior of managers and auditors. For instance, Peng and Luo (2000) and Li, Poppo, and Zhou (2008) find that managers' micro interpersonal ties with top executives at other firms and with government officials help firms gain resources, help foster firm growth, and help firms achieve superior performance. Guan, Su, Wu, and Yang (2016) suggest that close relationships between auditors and managers, which manifests in school ties, would impair auditor independence and lead auditors to issue more clean audit opinions. Moreover, some studies find that guanxi could weaken the effectiveness of formal institutional arrangements. For example, Firth, Rui, and Wu (2011) document that firms are more likely to obtain favorable appeal results when sued by other firms if their managers, directors, or shareholders have guanxi with government.
The disclosure requirement of the Chinese audit market ensures that we can obtain a substantially large dataset to examine the impact of previous working relationships between rotating partners on mandatory audit partner rotation. In China, two audit partners5 must sign a single audit report. The China Securities Regulatory Commission (CSRC) requires all listed firms to report detailed information on the two audit partners, such as their names, audit firms, and tenure. By hand-collecting these data, we can identify the previous working relationships between outgoing and incoming audit partners. We consider two audit partners who have cosigned an audit
4Su and Wu (2016) find that audit partners are less likely to issue modified opinions to their unforced follower clients, as compared either with all other audits in the same successor
audit firm in the same year, or with post-follow audits of forced follower clients, suggesting that audit partners account for relationships when issuing opinions. We also get inspiration from this work.
P a g e 4 | 50 report before mandatory rotation to have a previous working relationship, and a mandatory rotation between these two audit partners is defined as a “connected rotation.”6 Connected rotations are widely present in Chinese audit firms. Moreover, based on interviews conducted with audit partners, we find that it is a common phenomenon for outgoing audit partners to participate in incoming audit partners' work, and in some extreme cases, outgoing audit partners even continue to conduct audit practices while incoming audit partners sign the reports afterward.7
Using a sample of Chinese firms undergoing mandatory audit partner rotations, we
find that outgoing audit partners are more likely to rotate back after the cooling-off
period in rotations where rotating audit partners have previous working relationships. The incoming audit partners in such rotations are likely to be less independent, as they are more likely to serve a temporal role and be influenced by outgoing audit partners. Taking the absolute value of discretionary accruals (|DA|) and industry-median adjusted nonrecurring items (NRI) as proxies for audit quality (e.g., Chen, Su, & Wu, 2009; Chi et al., 2009; Myers, Myers, & Omer, 2003), we also find that for non-connected rotations, the audit quality improves, but for connected rotations, the improvement in audit quality decreases significantly and in some cases diminishes completely. Therefore, the evidence in our setting suggests that the close relationship between outgoing and incoming audit partners can erode the positive effect of mandatory audit partner rotation on audit quality.
Our study contributes to the literature in the following ways. First, we extend prior studies on mandatory audit partner rotation by examining whether the impact on audit quality after rotation depends on the relationships between rotating audit partners. Most prior studies investigate the consequences of mandatory audit partner rotation by comparing the audit quality between the pre- and post-rotation periods directly (e.g., Chi et al., 2009; Lennox et al., 2014). Implicitly assumed in these studies is that all rotations are created equal, that is, on average, all rotations either improve or reduce audit quality. We relax this assumption and provide evidence that relationships between rotating audit partners moderate the positive effect of mandatory audit partner rotation on audit quality. Moreover, our investigation is
6 Previous academic researchers such as Lennox (2005) have used working relationships as proxies for the close social relationships between auditors and executives of clients. 7 For example, in 2010, the Shanghai Aijian Corporation (Chinese stock code: 600643) was exposed as being involved in a
financial fraud of RMB 1.7 billion during 1998–2002. At the same time, Aijian was audited by Lixin, an audit firm in Shanghai. Although Lixin always issued unqualified opinions, later investigation revealed that the two CPAs, Dai
Dingyi and Zhou Qi, did not participate in the audit process, but only signed the audit reports prepared by previous auditors. Source: http://
P a g e 5 | 50 conducted based on the perspective of audit partners. Compared with the perspective of an external legal environment (Firth et al., 2012a), audit partners, who are the target of rotation policy, have more direct impact on audit quality improvement after mandatory rotation. Therefore, our study is helpful for understanding the heterogeneity in mandatory rotation effectiveness as we can see how audit partners evade mandatory rotation directly. Second, this study has policy implications for practitioners such as regulators, audit firms and client managers. We show that, due to the relationships between rotating audit partners, mandatory audit partner rotation cannot necessarily bring a fresh look or enhance auditor independence. Regulators should be aware of such loopholes in mandatory audit partner rotation policy so that they can address the issues accordingly in their policy setting. Audit firms and client managers can also learn from our findings and react accordingly to improve audit quality.
The rest of this paper is organized as follows. In Section 2, we introduce the institutional knowledge related to our research setting, review the relevant literature, and develop our hypotheses. In Section 3, we discuss the sample, data, and the empirical design. In Section 4, we present our main empirical results. In Section 5, we report additional analyses. Section 6 concludes the paper.
2. Institutional background, literature review, and hypothesis development
2.1. Background of China's mandatory audit partner rotation policy
China's current regular auditor rotation policy is aimed at regulating audit partners. In October 2003, the Chinese Institute of Certified Public Accountants (CICPA) and the Ministry of Finance of China issued their joint Regulations on the Regular Rotation of the CPA Engaging on the Auditing of Securities and Futures, the major articles of which audit partners must follow. An audit partner cannot spend more than five years continuously auditing a publicly traded company.8 If an audit partner joins a new audit firm after working at another firm, the time the audit partner spends on auditing the same company in the two different audit firms should be aggregated. An audit partner who reaches the five-year limit cannot resume audit services for the company within two years, which is defined as the “cooling-off period.” The fi
P a g e 6 | 50 year limitation is decreased to two years if an audit partner is serving the client in the year of the client's initial public offering (IPO). The regulations went into effect on January 1, 2004. With the implementation of these policies, China adopted mandatory audit partner rotations in practice.
The CSRC also requires each publicly traded company to report the names of the two incumbent audit partners, the audit firm(s) with which they are associated, and other details such as the names of the outgoing and incoming audit partners and the time of rotation. This unique disclosure requirement is rarely seen in other countries and offers a desirable research setting for comparing audit quality changes after mandatory rotation for two kinds of rotations: non-connected rotations, in which outgoing and incoming audit partners have no previous working relationships on other audit clients, and connected rotations, in which such relationships do exist.
2.2. Literature review and hypothesis development
P a g e 7 | 50 Recently, when the data of mandatory audit partner rotation become available in some countries, researchers begin to examine the real effect of this policy on audit quality. Using audit data from Taiwan, where a five-year audit partner rotation became de facto mandatory in 2004, Chi et al. (2009) do not find consistent evidence that mandatory audit partner rotation can improve audit quality. Bamber and Bamber (2009) and Lennox et al. (2014) suggest that this “no-result” finding can be attributed to the noisy proxy for audit quality. Using a unique dataset of audit adjustments in China, Lennox et al. (2014) find that audit quality significantly improved in the years immediately surrounding mandatory audit partner rotation. In addition, Firth et al. (2012a) find that Chinese firms with mandatory audit partner rotations are significantly more likely to receive a modified audit opinion than firms without mandatory audit partner rotations, suggesting that audit quality can be improved by mandatory audit partner rotations, although such an association is limited to the firms in regions with weak legal institutions.
When examining the effectiveness of mandatory audit partner rotation, most of the previous studies, except Firth et al. (2012a), implicitly assume that all rotations are created equal, that is, all rotations either improve or reduce audit quality. They do not take other factors, which can affect the association between mandatory audit partner rotation and audit quality, into consideration. We attempt to fill this gap by investigating the effectiveness of mandatory audit partner rotation policy, conditioning on whether there is a relationship between rotating audit partners. By China's mandatory audit partner rotation policy, if an audit partner has audited a
firm continuously for five years, the partner must be replaced by another partner from the same or a different audit firm. In other words, the outgoing audit partner must transfer his or her own client resources to the incoming audit partner. It implies a loss for the outgoing audit partner, especially in China,7 where the number of public9firms is limited and the auditing market is intensively competitive (Huang, Chang, & Chiou, 2016; Su & Wu, 2016 ). Therefore, the outgoing audit partner has an
9 Audit firms in China usually adopt a “you eat what you kill” formula in distributing profits among partners, which means the audit profit from a given client goes to partners who
P a g e 8 | 50 incentive to rotate back to serve the prior client after the cooling-off period. In fact, rotating back is common. In the sample used by Firth, Rui, and Wu (2012b), as many as 46.4% of outgoing audit partners rotate back after the cooling-off period.
If an outgoing audit partner is motivated to rotate back, s/he would not ignore the relationship with the incoming audit partner and would prefer the successive audit partner to be a close relation.10 This is because a close relationship, or guanxi, between outgoing and incoming partners can increase the chance that an outgoing partner rotates back after the cooling-off period. In a relationshipbased society such as China, people are inclined to build “inner circles” in which intimate connections encourage mutual help and construct “win-win” scenarios (Bedford, 2011; Zhang & Li, 2003).11 This is similar to a strategic alliance established between two or more
firms to achieve business objectives. Although alliance members may also compete against each other, the benefit of cooperation exceeds the costs from competition (Soekijad & Andriessen, 2003). For example, by establishing a price alliance, firms can avoid malignant competition which entails substantial price reduction. This way, alliance members can enjoy favorable profits (Liu, 2005). In the same vein, under a mandatory audit partner rotation regime, audit partners who have close relationships have incentives to cooperate to minimize the risk of losing clients. Otherwise, internal competition would make audit partners exhausted when maintaining relationships with clients, leading to a “lose-lose” scenario. Therefore, referrals are more likely to happen between outgoing and incoming audit partners who have close relationships. In addition, if an outgoing audit partner has a close relationship with an incoming audit partner, the former is more likely to influence the latter's auditing process to cater to the client needs, which can prevent losing clients to other audit
firms. For instance, much of the literature has found that clients prefer to change audit firms if they receive modified audit opinions (Chow & Rice, 1982). By catering to client needs, the relationship between outgoing audit partner and client can be strengthened, and this is helpful to the rotating back of the outgoing audit partner. Therefore, our first hypothesis can be stated as follows.
10
We conduct interviews with audit partners coming from big and small audit firms. They told us that an outgoing audit partner often chooses a successor when rotating off, but
such a practice is usually performed in private to avoid potential penalties from regulators.
11 The evidence is not only limited in China. Using a unique dataset of Swedish audit partners' criminal convictions, Amir, Kullunki, and Nilsson (2014) document that there is an
P a g e 9 | 50
H1. If outgoing and incoming audit partners have a previous working relationship, then the outgoing audit partner is more likely to rotate back to provide audit
services.
During an audit partner rotation, the incoming audit partner gives a fresh perspective on a client, just as a patient obtains a second opinion from a different (an independent) doctor. The more independent the incoming audit partner, the more valuable the new perspective. Baber, Krishna, and Zhang (2014) document that if investors perceive that affiliated hires of executives compromise auditor independence, then there is a relative decline in earnings quality (lower quarterly ERC) after affiliated hires. In our setting, connected rotations endanger the policy objective of a mandatory audit partner rotation. When incoming audit partners have close working relationships with outgoing audit partners, they are more likely to be influenced by outgoing audit partners and therefore cannot bring as fresh a perspective as others who do not have close working relationships with outgoing audit partners. These incoming audit partners are inclined to compromise with clients over the course of an audit, thereby decreasing audit quality improvement. In contrast, when outgoing audit partners have no close working relationships with incoming audit partners, the incoming audit partners can audit the clients more independently and the audit quality should increase after rotation. The preceding discussions lead to H2 as follows.
H2. After connected rotations during which the outgoing and incoming audit partners have previous working relationships, the audit quality after mandatory rotation improves less than it does after non-connected rotations.
We acknowledge that if previous working relationships can facilitate the transfer of client knowledge between incoming and outgoing audit partners,12 audit quality would be improved more after mandatory rotation. However, such an effect might be limited in the setting of mandatory internal rotations.13 Several factors (e.g., incoming audit partners can easily access working papers used by outgoing audit partners) would weaken the impact of relationships between outgoing and incoming audit partners on the transfer of client knowledge.
12Guan et al. (2016) suggest that school ties can facilitate the information transfer between auditors and executives of clients.
P a g e 10 | 50
3. Data, sample and regression models
3.1. Data and sample
After obtaining most of our data from the China Stock Market Accounting Research (CSMAR) database, we hand-collected audit partner-related supplementary information from the Shanghai Securities Exchange (http://www.sse.com.cn/) and Shenzhen Securities Exchange (http://www.szse.cn/). Since the Chinese mandatory audit partner rotation policy went into effect on January 1, 2004, which could affect the audit work of fiscal year 2003, our sample starts from 2003. Our sample ends at 2009 because we need to keep the two-year cooling-o ff
period in our sample and identify whether outgoing audit partners rotate back or not after the two-year cooling-off period, and the latest available data when we start this study are the data of fiscal year 2011.14,15 We focus on mandatory internal rotations and purge the data using the following steps.
We start with 19,925 firm-year observations from the CSMAR database for the period 1998 to 2011. We exclude financial firms (820 observations). We also remove
firm-years that are missing values needed to calculate variables used in empirical models (1749 observations). Then, we identify the mandatory internal rotations —
rotations where outgoing and incoming audit partners come from the same audit firm. For example, there are three audit partners: A, B, C, and all of them come from audit
firm X. During our sample period, firm Y's financial reports are audited by audit firm X without changing audit firms. From 1998 to 2002, partner A is responsible for auditing firm Y's financial reports, and partner B joins in this work in 2001. By 2002, partner A has continuously conducted the audit work for firm Y for five years and must be rotated off next year according to the regulatory requirements. In 2003, partner A is replaced by partner C, and partner C and partner B co-work to audit firm Y's financial report. In this example, the client does not change its audit firm, and when the old audit partner's tenure reaches the five-year limit, the old audit partner is replaced with a new audit partner coming from the same audit firm. We define this situation as mandatory internal rotation.
14 When we say our sample period starts at 2003 and ends at 2009, we mean that the rotation year (the
first year of incoming audit partner tenure) ranges from 2003 to 2009.
15 When mandatory audit partner rotation occurs in 2009, we need to identify whether outgoing audit partners rotate back or not after the two-year cooling-o
ff period (2009 and 2010) in 2011. It should be noted that, because we need to compare the audit quality of five years before rotation with that of the two-year coolingoff period, the sample used in our
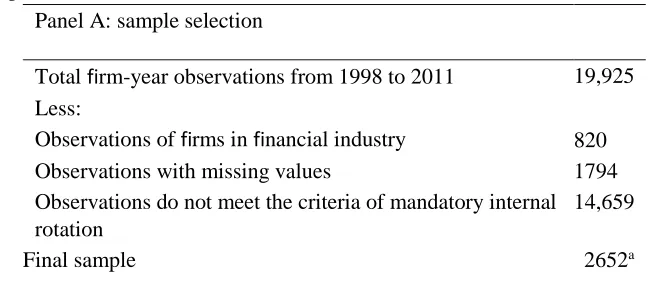
P a g e 11 | 50 All observations that do not meet the criteria of mandatory internal rotation are excluded from our sample. For instance, the audit firm tenure may have been too short16 (e.g., three years) so audit partners were not subject to mandatory rotations, or long (e.g., ten years), but the audit partners changed before their tenures reached the five-year limit. This selection process yields a final sample of 2652 firm-years. The 2652 firm-year observations cover the period from five years before rotation to two years after rotation (the cooling-off period). Panel A of Table 1 reports the sample selection process.
We divide the mandatory rotation timeline into three periods (shown in Fig. 1) as follows. The first period is the pre-mandatory rotation period, or PreMR, which includes the five years before the audit rotation (two years for firms in their IPO years). The second period is the post-mandatory rotation period, or PostMR, in which incoming audit partners provide audit services to clients for two years. For outgoing audit partners, these two years represent a cooling-off period. The final period is the third year after a rotation, which reveals whether the outgoing audit partners rotate back or not, or RB or NRB, respectively, to serve their original clients. Depending on whether the previous audit partners rotate back after the cooling-off
period, we divide the observations into two groups: the RB and NRB subsamples. Panel B of Table 1 shows the distributions of both subsamples in each year. Among the 454 companies whose audit partners were mandatorily rotated during 2003–
2009, 210 companies are in the RB subsample and 244 companies are in the NRB subsample.
Depending on whether the outgoing and incoming audit partners had already cosigned a client's audit report, we divide the observations into two groups: the subsample with previous working relationships (WR) and the subsample with no previous working relationships (NWR). Panel C of Table 1 shows the distributions of the two subsamples according to two metrics: RB vs. NRB and WR vs. NWR. Among the 318 WR subsample observations, 168 observations belong to the RB subsample, comprising 52.83%. Among the 136 NWR subsample observations, 42 observations belong to the RB subsample, comprising 30.88%. If an outgoing audit partner has a previous working relationship with an incoming audit partner, the
16 We do not classify the type of audit firm changes (e.g., voluntary switch, partner changes audit firms and the client follows the partner). When audit firm tenure is short so that
P a g e 12 | 50 likelihood of the outgoing audit partner rotating back after the cooling-off period is 21.95% higher than the likelihood of the outgoing audit partner not having a previous working relationship with the incoming audit partner. As a result, we find some preliminary support for H1.
3.2. Regression models
Earlier, we hypothesized a positive association between the previous working relationship and outgoing partner rotating back (H1). To test this association, we estimate the following logistic regression model:
where the dependent variable is RBi, a dummy variable that equals 1 if outgoing audit partner i rotates back after the cooling-off period and 0 otherwise. We are interested in the variable WRi, a dummy variable indicating whether the outgoing audit partner and incoming audit partner have a previous working relationship. We measure previous working relationship by examining whether outgoing and incoming audit partners ever jointly performed audit services for a firm as the signing auditors. If these two audit partners have a previous working relationship, then WRi equals 1, and 0 otherwise. Prior studies have used the previous working relationships between previous and new auditors to measure their affiliations (e.g., Lennox, 2005). To be consistent with H1, the coefficient on WRi should be significantly positive.
Since the selection of a new auditor can be influenced by the characteristics of both auditor and client, we control for these two Table 1
Sample selection and distribution. Panel A: sample selection
Total firm-year observations from 1998 to 2011 19,925 Less:
Observations of firms in financial industry 820 Observations with missing values 1794 Observations do not meet the criteria of mandatory internal rotation
14,659
Final sample 2652a
P a g e 13 | 50 Year RB Percent (%) NRB Percent
(%)
2003 39 19 32 13
2004 42 20 32 13
2005 37 18 22 9
2006 47 22 52 21
2007 17 8 25 10
2008 22 10 31 13
2009 6 3 50 21
Total 210 100 244 100
Panel C: previous working relationship and rotate back.
WR Percent (%) NWR Percent (%) Total
RB 168 52.83 42 30.88 210
NRB 150 47.17 94 69.12 244 Total 318 100 136 100 454c Variable definitions:
WR: outgoing and incoming audit partners have a previous working relationship. NWR: outgoing and incoming audit partners do not have a previous working relationship. RB: outgoing audit partner rotates back after the cooling-off period.
NRB: outgoing audit partner does not rotate back after the cooling-off period. a
The 2652 observations cover PreMR and PostMR(1–2) periods (see Fig. 1). b Mandatory rotation year is the first year of incoming audit partner tenure.
c
There are 160 IPO cases where audit partners have to be rotated every two years.
sets of factors. We choose outgoing audit partner's gender, age, education degree, and working experience as control variables. GENDERi is a dummy variable that equals 1 when the outgoing audit partner is male and 0 otherwise. AGEi represents
1. PreMR
2. PostMR
3. RB or NRB
P a g e 14 | 50 the outgoing audit partner's age. EDUCATIONi is a dummy variable that captures the outgoing audit partner's education degree, which equals 1 for a bachelor or higher degree and 0 otherwise. EXPERi represents the outgoing audit partner's working experience, measured as working years. In addition, we add variables of AFTENk, AFSIZEk, SPECNUMk, and SPECPAIRk into model (1). AFTENk is the tenure of the audit firm. AFSIZEk is audit firm size, which equals the rank of the audit firm each year based on clients' assets. SPECNUMk is the number of industry specialized audit partners each year of an audit firm (corresponding to the client's industry). We define industry specialists as those partners whose industry-year market share belong to the highest quartile of its distribution (Zerni, 2012). Audit partners' market share is calculated based on clients' assets. SPECPAIRk is a dummy variable, which equals 1 when both of two audit partners who are responsible for the same client are industry specialists (corresponding to the client's industry), and 0 otherwise.
Following Wang, Wong, and Xia (2008), we control for the client level variables as follows. GROWTHj stands for the client's growth, which is equal to the annual sales growth rate. LTAj stands for the firm size, which is equal to the natural logarithm of total assets. OPROAj is return on assets, which is equal to the operating profit divided by total assets. LEVj is financial leverage, which is equal to the total liabilities divided by total assets. LIQj is current ratio, which is equal to the current assets divided by current liabilities. RECVj controls for client's accounts receivable level, which is equal to the accounts receivable divided by total assets. INVj controls for a client's inventory level, which is equal to the inventory divided by total assets. ISSUANCEj is a dummy variable which controls for a client's equity financing activity, and it is equal to 1 if a firm issues equity next year and 0 otherwise. All control variables are calculated based on the year before mandatory rotation.
To determine the effect of previous working relationships between rotating audit partners on audit quality improvement (H2), we estimate the following regression model:
P a g e 15 | 50 2002; Heninger, 2001; Johnson, Khurana, & Reynpreviouss, 2002; Myers et al., 2003; Son & Chen, 2006). This proxy has several advantages for capturing audit quality. For example, it is a component of financial reporting quality, easily detectable “within GAAP” earnings manipulation, and applicable to small samples (DeFond & Zhang, 2014). In addition, using this proxy allows us to compare our
findings with those of prior studies which focus on mandatory audit partner rotation (e.g., Chi et al., 2009). Kothari, Lenoe, and Wasley (2005) suggest that performance-adjusted discretionary accrual measures can enhance the reliability of inferences from earnings management research. Following this suggestion, we add return on assets (ROAj,t) into the modified Jones model (Dechow, Sloan, & Sweeny, 1995) to estimate DAj,t:
where TACCjt refers to total accruals, and it is calculated as follows: the change in the current assets of year t − the change in the cash and cash equivalents of year t −
the change in the current liabilities of year t + the change in the short-term borrowing in current liabilities of year t − the change in the depreciation and amortization expense of year t. TAjt − 1 is equal to the total assets at the end of year t − 1. ΔREVjt is
the change in sales revenue between year t and t − 1. RECjt is equal to the change in net receivables between year t and t − 1. PPEjt is equal to the book value of the fixed assets in year t. ROAjt is the return on assets in year t.
We conduct the regression analysis by industry and year to estimate γ1, γ2, and γ3.
We then substitute the parameters into Eq. (b) to calculate DAj,t and take the absolute
value of DAj,t, where
Therefore, |DAj,t| is an annual basis proxy for audit quality. For each firm-year, it has a distinct value.17
17
P a g e 16 | 50 We are interested in the interaction term of WR and POST (WR ∗POST), which captures the difference-in-differences effect in our research design. POST is a dummy variable that equals 1 for two post-rotation years and 0 for five pre-rotation years. As predicted by H2, the coefficient on WR ∗ POST should be significantly positive.
Following prior studies (Blouin, Grein, & Roundtree, 2007; Chen et al., 2009), we control for other determinants of audit quality. LTAj,t is firm size, calculated as the logarithm transformed total assets; LEVj,t is financial leverage, calculated as total liabilities over total assets; OPROAj,t is profitability, calculated as operating income over total assets; LOSSj,t is a dummy which equals 1 for loss reporting firms and 0 otherwise; RECVj,t is the ratio of receivables to total assets and INVj,t is the ratio of inventories to total assets, which are used to control for audit complexity; CASHFLOWj,t is operating cash flow scaled by total assets; LISTAGEj,t is firm age, measured as the number of years since the firm went public; GROWTHj,t is annual sales growth rate; ISSUANCEj,t is a dummy which equals 1 for firms issuing equity next year and 0 otherwise; AFTENj,t is the tenure of the audit firm; MCj,t is audit market concentration, measured as the Herfindhal index of audit market each year based on clients' total assets; LNAFj,t is the natural logarithm transformed audit fees.18 We also include year (YEAR) and industry (INDUSTRY) fixed effects in model (2). Industries are classified by China Securities Regulatory Commission (CSRC), which include 13 basic industry categories. For both model (1) and model (2), we cluster standard errors at the firm and year level. To mitigate the influence of outliers, we winsorize all continuous variables at the 1% and 99% cutoff points, respectively.
4. Empirical results
5. 4.1. Descriptive statistics
6. Table 2 presents the descriptive statistics for variables used in empirical
models. We split the full sample into two subsamples (WR and NWR) based on whether there are previous working relationships between outgoing and incoming audit partners. In the WR
7. Table 2
P a g e 17 | 50
8.
Mean Median Mean Median Mean Median Panel A: Descriptive statistics for
model (1).
AGE 40.628 39.000 40.167 39.000 0.504 0.501 EXPER 9.345 9.000 9.197 9.000 0.620 0.843 GROWTH 0.209 0.160 0.175 0.160 0.467 0.401 LTA 21.241 21.111 21.204 20.957 0.769 0.243 OPROA 0.126 0.105 0.130 0.117 0.606 0.405
LEV 0.542 0.529 0.502 0.496 0.097 0.147
LIQ 1.942 1.300 1.862 1.269 0.802 0.774
RECV 0.128 0.099 0.122 0.104 0.609 0.965
INV 0.169 0.132 0.144 0.114 0.063 0.153
AFTEN 5.802 5.000 4.382 5.000 0.000 0.000 AFSIZE 27.406 25.000 25.088 20.000 0.226 0.123 SPECNUM 3.978 3.000 4.500 3.000 0.273 0.855 Categorical
variables
No. of Obs. Percent No. of Obs. Percent Mean Median
RB 168 52.83% 42 30.88% 0.000 0.000
GENDER 201 63.21% 94 69.14% 0.297 0.297
EDUCATION 200 62.89% 85 62.50% 0.779 0.779
ISSUANCE 22 6.92% 6 4.41% 0.271 0.311
SPECPAIR 90 28.30% 27 19.85% 0.049 0.060 Panel B: Descriptive statistics for
model (2).
NRI 0.013 0.001 0.013 0.003 0.914 0.760
|DA| 0.120 0.078 0.124 0.076 0.221 0.836 LTA 21.191 21.071 21.170 20.951 0.655 0.106
LEV 0.525 0.523 0.513 0.500 0.254 0.201
OPROA 0.198 0.170 0.213 0.181 0.016 0.012 RECV 0.134 0.108 0.132 0.110 0.615 0.690
INV 0.163 0.126 0.143 0.118 0.001 0.048
CASHFLOW 0.051 0.050 0.055 0.050 0.256 0.589 LISTAGE 5.775 5.000 4.900 4.000 0.000 0.000 GROWTH 0.148 0.086 0.087 0.066 0.163 0.023 AFTEN 5.808 5.000 4.549 4.000 0.000 0.000
MC 0.275 0.267 0.304 0.285 0.000 0.005
LNAF 12.995 12.899 13.016 12.899 0.411 0.881 Categorical
variables
No. of Obs. Percent No. of Obs. Percent Mean Median
LOSS 32 1.67% 11 1.49% 0.745 0.745
P a g e 18 | 50
ISSUANCE 150 7.83% 58 7.85% 0.987 0.987
9. Variable definitions:
10.RB: dummy variable, which equals 1 if outgoing audit partner rotates back after the cooling-off period, and 0 otherwise.
11.WR: dummy variable, which equals 1 if outgoing audit partner has a previous working relationship with incoming audit partner, and 0 otherwise.
12.GENDER: dummy variable, which equals 1 when outgoing audit partner is male, and 0 otherwise. 13.AGE: outgoing audit partner's age.
14.EDUCATION: dummy variable, which equals 1 when outgoing audit partner has a bachelor or higher degree, and 0 otherwise.
15.EXPER: outgoing audit partner's working experience, measured as working years. 16.AFTEN: tenure of audit firm.
17.AFSIZE: audit firm size, which equals the rank of audit firm each year based on clients' total assets.
18.SPECNUM: the number of industry specialized audit partners each year of an audit firm (corresponding to the client's industry). We define industry specialists as those partners whose industry-year market share belong to the highest quartile of its distribution (Zerni, 2012). Audit partners' market share is calculated based on clients' total assets.
19.SPECPAIR: dummy variable, which equals 1 when both of two audit partners, who are responsible for the same client, are industry specialists (corresponding to the client's industry), and 0 otherwise.
20.GROWTH: annual sales growth rate. 21.LTA: natural logarithm of total assets.
22.OPROA: return on assets, calculated as operating profit over total assets. 23.LEV: leverage ratio, calculated as total liabilities over total assets. 24.LIQ: current ratio, calculated as current assets over current liabilities. 25.RECV: ratio of account receivables to total assets.
26.INV: ratio of inventory to total assets.
27.ISSUANCE: dummy variable, which equals 1 if a firm issues equity next year, and 0 otherwise. 28.|DA|: the absolute value adjusted discretionary accruals, estimated by performance-adjusted modified Jones model.
29.NRI: industry-median adjusted non-recurring items, calculated as (net profit − operating profit + profit from other operations) / total assets, and adjusted by industry median value.
30.LOSS: dummy variable, which equals 1 for loss reporting firms, and 0 otherwise.
31.CASHFLOW: ratio of operating cash flows to total assets.
32.LISTAGE: firm age, calculated as the number of years since firm went public.
33.MC: audit market concentration, measured as the Herfindhal index of audit market each year based on firms' total assets. LNAF: natural logarithm transformed audit fees.
34.subsample, the outgoing and incoming audit partners have previous working
P a g e 19 | 50 preliminary evidence that previous working relationships between outgoing and incoming audit partners affect the rotating back of outgoing audit partners. In Panel B, we present the descriptive statistics for the variables used in model (2) and compare these variables between the WR and NWR subsample. The observations in the WR subsample have significant lower means and medians for OPROAj,t and MCj,t, but significantly higher means and medians for INVj,t, LISTAGEj,t, and AFTENj,t, indicating that previous working relationships between outgoing and incoming audit partners are more likely to exist in firms with lower profits, more inventories, longer listing histories, and audit firms with longer tenures and more competitors. We find no significant differences for other variables between these two subsamples.
35.Table 3
36.Previous working relationship and rotate back.
37.
38.Dependent variable: RB
39.
Column 1 Column 2 Column 3 Column 4
Intercept −0.8054 −0.6699 2.6192 2.3600
(18.75)⁎⁎⁎ (0.69) (2.06) (0.94)
WR 0.9187 0.9607 0.9682 0.9800
(17.86)⁎⁎⁎ (17.04)⁎⁎⁎ (19.40)⁎⁎⁎ (17.23)⁎⁎⁎
GENDER 0.3961 0.4485
(3.28)⁎ (3.95)⁎⁎
AGE 0.0006 0.0054
(0.00) (0.08)
EDUCATION 0.0619 0.0431
(0.08) (0.04)
EXPER −0.1027 −0.1032
(6.13)⁎⁎ (5.78)⁎⁎
P a g e 20 | 50
(0.48) (1.07)
AFSIZE 0.0089 0.0062
(1.866) (0.77)
SPECNUM 0.0290 0.0162
(1.19) (0.30)
SPECPAIR −0.0339 0.1081
(0.02) (0.17)
GROWTH 0.1919 0.0185
(0.65) (0.01)
LTA −0.1633 −0.1501
(3.87)⁎⁎ (2.19)
OPROA 1.7801 2.0159
(1.92) (2.20)
LEV 0.1189 −0.0281
(0.08) (0.01)
LIQ −0.0193 −0.0096
(0.26) (0.10)
RECV −1.5009 −1.7141
(2.42) (2.77)⁎
INV −0.5279 −0.4329
(0.53) (0.30)
ISSUANCE −0.1775 −0.0619
(0.19) (0.02)
Pseudo R2 0.0544 0.0971 0.0804 0.1187
N 454 436 454 436
P a g e 21 | 50
⁎⁎⁎Represents the 1% significance level (two-tailed).
⁎⁎Represents the 5% significance level (two-tailed).
⁎Represents the 10% significance level (two-tailed).
4.2. Regression results
Table 3 presents the regression results of model (1). In column 1, we do not include any controls. Columns 2 and 3 separately include auditor and client related controls. In column 4, we add all of the control variables. The results show that the coefficients on WR are significantly positive in all specifications, supporting H1. For example, the coefficient on WR of the full model in column 4 is 0.9800 (χ2-statistic = 17.23), indicating that if the outgoing and incoming audit partners have a previous working relationship, then the outgoing audit partner has a higher likelihood of rotating back.19 Quantitatively, the probability of rotating back for outgoing audit partners who have previous working relationships with incoming audit partners is 2.66 times higher than for those audit partners who do not have previous working relationships (odds ratio = 2.66). This suggests that rotations between audit partners with previous working relationships are more likely to be opportunistic.
The only control variables with significant coefficients are GENDERi, EXPERi, and RECVi. The coefficients on GENDERi are significantly positive, indicating that male audit partners are more likely to rotate back after the cooling-off period, which could be attributed to the risky style of males. The coefficients on EXPERi are significantly negative, indicating that audit partners with rich experience are less likely to rotate back after the cooling-off period. This is because audit partners' rich experience has made them more prudent or has helped them accumulate enough clients. The coefficients on RECVi are significantly negative, indicating that audit partners servicing for firms with more receivables are less likely to rotate back after the cooling-off period. Coefficients on other control variables are insignificant, which may be because our sample size is relatively small.
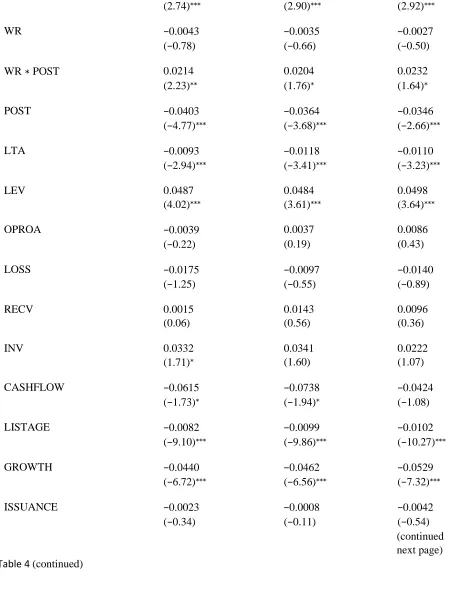
Table 4 reports the regression results of model (2). In Panel A, we directly investigate the effect of mandatory audit partner rotation on audit quality without adding WRi and WR ∗ POST. We then investigate the incremental effect of previous working
19 We also find that outgoing audit partners are more likely to rotate back immediately after the two-year cooling-off period if they have previous working relationships with
P a g e 22 | 50 relationships by adding WRi and WRi ∗ POST in Panel B. There are three columns in both Panels A and B. Each column corresponds to a distinct sample. Column 1 compares the |DAj,t|
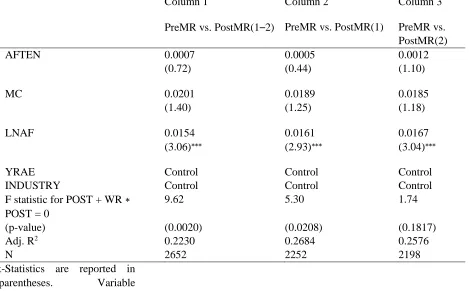
of the years before rotation with the |DAj,t| of the two years after rotation [PreMR vs. PostMR(1–2)]. Column 2 compares the |DAj,t| of the years before rotation with the |DAj,t| of the first year after rotation [PreMR vs. PostMR(1)]. Column 3 compares the |DAj,t| of the years before rotation with the |DAj,t| of the second year after rotation [PreMR vs. PostMR(2)].20
Panel A shows that the coefficients on POST are significantly negative in all three columns (e.g., the coefficient on POST is −0.0252 with a t-statistic of −4.71 in column 1, suggesting that after audit partner mandatory rotation the absolute value of discretionary accrual decreases by 21.07%),21 indicating that the overall audit quality improved after mandatory audit partner rotation.
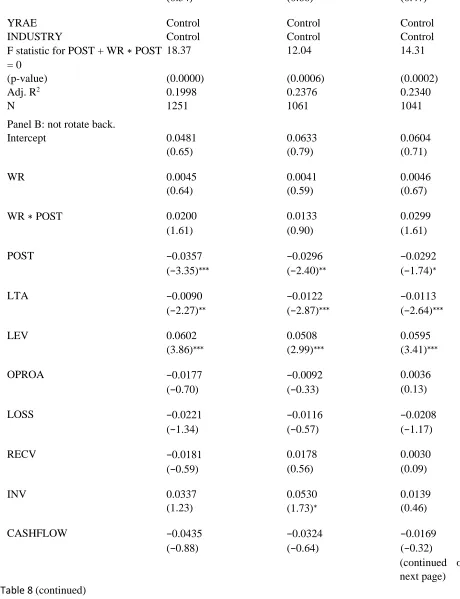
In Panel B, the coefficients on POST are significantly negative in all the columns (−0.0403 with a t-statistic of −4.77, −0.0364 with the t-statistic of −3.68 and −0.0346 with a t-statistic of −2.66 in columns 1, 2 and 3, respectively22), indicating an improvement in audit quality after mandatory audit partner rotation when there are no previous working relationships between the outgoing and incoming audit partners. The coefficients on WRi ∗POST are significantly positive (0.0214 with a t-statistic of 2.23, 0.0204 with a t-t-statistic of 1.76, 0.0232 with a t-t-statistic of 1.64 in columns 1, 2, and 3, respectively), indicating that the improvement in audit quality after mandatory audit partner rotation is significantly smaller when there is a previous working relationship between outgoing and incoming audit partners. As revealed by the F-tests, the coefficients on WR ∗ POST + POST are significantly negative in the first two columns (p-values are much smaller than or equal to 5%). However, the coefficient is not statistically different from zero in column 3 (p-value = 0.1817), suggesting that when there is a previous working relationship between outgoing and incoming audit partners, the audit quality improvement caused by
20 As we have mentioned above, |DA
j,t| is an annual basis measure and each firm-year has its distinct value. For example, in column 1, we compare the |DAj,t| of years before
rotation(i.e., PreMR(1), PreMR(2), PreMR(3), PreMR(4), PreMR(5)) with |DAj,t| of two years after rotation(i.e., PostMR(1), PostMR(2)). 21−21.07%=(−0.0252)/0.1196, where 0.1196 is the mean value of |DA|.
22
P a g e 23 | 50 mandatory audit partner rotation is either reduced or diminished. The findings generally support H2.
Regarding to control variables, the coefficients on LTAj,t, LISTAGEj,t, and GROWTHj,t are significantly negative, indicating higher audit quality for larger firms and firms with longer history and faster growth. The coefficients on LEVj,t and LNAFj,t are significantly positive, indicating that firms with higher leverage and audit fees have a lower audit quality.
4.3. Robustness tests
4.3.1. Alternative measure of audit quality
Following prior studies (e.g., Chen et al., 2009), we check the robustness of our
findings using the industry-median adjusted nonrecurring items (NRIj,t) as an alternative audit quality measurement. According to Chen and Yuan (2004), it is common for Chinese listed firms to manage earnings through non-recurring items, and many studies have used the non-recurring items to measure firms' earnings management and audit quality (Chen & Wang, 2004; Chen et al., 2009). Therefore, we employ the variable of NRIj,t (industry-median adjusted), which was used by Chen et al. (2009), as an alternative audit quality measurement. NRIj,t is calculated as
Table 4
Previous working relationship, mandatory rotation, and audit quality.
Dependent variable: |DA|
Column 1 Column 2 Column 3
PreMR vs. PostMR(1–2) PreMR vs. PostMR(1) PreMR vs. PostMR(2)
Panel A: without interaction terms.
Intercept 0.1464 0.1660 0.1729
(2.60)⁎⁎⁎ (2.79)⁎⁎⁎ (2.81)⁎⁎⁎
P a g e 24 | 50 (−4.71)⁎⁎⁎ (−3.49)⁎⁎⁎ (−2.26)⁎⁎
LTA −0.0092 −0.0117 −0.0110
(−2.93)⁎⁎⁎ (−3.40)⁎⁎⁎ (−3.23)⁎⁎⁎
LEV 0.0484 0.0485 0.0495
(3.97)⁎⁎⁎ (3.61)⁎⁎⁎ (3.60)⁎⁎⁎
OPROA −0.0041 0.0037 0.0081
(−0.23) (0.19) (0.40)
LOSS −0.0176 −0.0094 −0.0149
(−1.26) (−0.54) (−0.93)
RECV 0.0016 0.0145 0.0095
(0.06) (0.57) (0.36)
INV 0.0335 0.0342 0.0226
(1.74)⁎ (1.61) (1.09)
CASHFLOW −0.0610 −0.0730 −0.0428
(−1.72)⁎ (−1.92)⁎ (−1.09)
LISTAGE −0.0082 −0.0099 −0.0102
(−9.14)⁎⁎⁎ (−9.91)⁎⁎⁎ (−10.30)⁎⁎⁎
GROWTH −0.0441 −0.0463 −0.0530
(−6.75)⁎⁎⁎ (−6.58)⁎⁎⁎ (−7.35)⁎⁎⁎
ISSUANCE −0.0029 −0.0013 −0.0046
(−0.42) (−0.17) (−0.60)
AFTEN 0.0009 0.0006 0.0013
(0.92) (0.54) (1.21)
MC 0.0192 0.0186 0.0183
(1.35) (1.25) (1.18)
LNAF 0.0155 0.0160 0.0168
(3.06)⁎⁎⁎ (2.92)⁎⁎⁎ (3.06)⁎⁎⁎
YRAE Control Control Control
INDUSTRY Control Control Control
Adj. R2 0.2215 0.2674 0.2565
N
Panel B: with interaction terms.
2652 2252 2198
P a g e 25 | 50 (2.74)⁎⁎⁎ (2.90)⁎⁎⁎ (2.92)⁎⁎⁎
WR −0.0043 −0.0035 −0.0027
(−0.78) (−0.66) (−0.50)
WR ∗POST 0.0214 0.0204 0.0232
(2.23)⁎⁎ (1.76)⁎ (1.64)⁎
POST −0.0403 −0.0364 −0.0346
(−4.77)⁎⁎⁎ (−3.68)⁎⁎⁎ (−2.66)⁎⁎⁎
LTA −0.0093 −0.0118 −0.0110
(−2.94)⁎⁎⁎ (−3.41)⁎⁎⁎ (−3.23)⁎⁎⁎
LEV 0.0487 0.0484 0.0498
(4.02)⁎⁎⁎ (3.61)⁎⁎⁎ (3.64)⁎⁎⁎
OPROA −0.0039 0.0037 0.0086
(−0.22) (0.19) (0.43)
LOSS −0.0175 −0.0097 −0.0140
(−1.25) (−0.55) (−0.89)
RECV 0.0015 0.0143 0.0096
(0.06) (0.56) (0.36)
INV 0.0332 0.0341 0.0222
(1.71)⁎ (1.60) (1.07)
CASHFLOW −0.0615 −0.0738 −0.0424
(−1.73)⁎ (−1.94)⁎ (−1.08)
LISTAGE −0.0082 −0.0099 −0.0102
(−9.10)⁎⁎⁎ (−9.86)⁎⁎⁎ (−10.27)⁎⁎⁎
GROWTH −0.0440 −0.0462 −0.0529
(−6.72)⁎⁎⁎ (−6.56)⁎⁎⁎ (−7.32)⁎⁎⁎
ISSUANCE −0.0023 −0.0008 −0.0042
(−0.34) (−0.11) (−0.54)
(continued on next page) Table 4 (continued)
P a g e 26 | 50
Column 1 Column 2 Column 3
PreMR vs. PostMR(1–2) PreMR vs. PostMR(1) PreMR vs. PostMR(2)
AFTEN 0.0007 0.0005 0.0012
(0.72) (0.44) (1.10)
MC 0.0201 0.0189 0.0185
(1.40) (1.25) (1.18)
LNAF 0.0154 0.0161 0.0167
(3.06)⁎⁎⁎ (2.93)⁎⁎⁎ (3.04)⁎⁎⁎
YRAE Control Control Control
INDUSTRY Control Control Control
F statistic for POST + WR ∗
POST = 0
9.62 5.30 1.74
(p-value) (0.0020) (0.0208) (0.1817)
Adj. R2 0.2230 0.2684 0.2576
N 2652 2252 2198
t-Statistics are reported in parentheses. Variable definitions:
POST: dummy variable, which equals 1 for the two post-rotation years and 0 for the five pre-rotation years. All other variables are defined in Table 2.
⁎⁎⁎Represents the 1% significance level (two-tailed).
⁎⁎Represents the 5% significance level (two-tailed).
⁎Represents the 10% significance level (two-tailed).
(net profit − operating profit + profit from other operations) / total assets.
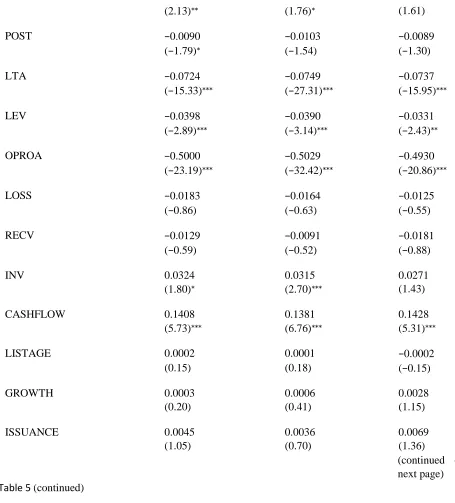
Table 5 reports the regression results of model (2) with NRIj,t as the dependent variable. Consistent with prior analysis, in Panel A, we investigate the effect of mandatory audit partner rotation on audit quality without including WR and WR ∗
P a g e 27 | 50 The results in Panel A of Table 5 show that the coefficients on POST are negative but not significant in all three columns, indicating that audit quality does not improve after mandatory audit partner rotation. This finding is not consistent with what we
find by using |DAj,t| as a proxy for audit quality. The results in Panel B of Table 5 show that the coefficients on POST are negative in all of the three columns, and significant at the 10% level in the first column (coefficients are −0.0090 with a t-statistic of −1.79), providing weak evidence that audit quality improves after mandatory rotation when there is no previous working relationship between outgoing and incoming audit partners. The coefficients on WR ∗ POST are significantly positive in the first and second column and positive but insignificant in the third column. These findings again suggest that the improvement in audit quality after mandatory rotation is significantly smaller when there is a previous working relationship between outgoing and incoming audit partners. In the F-test findings, the coefficients on WR ∗POST + POST are insignificantly different from zero in all three columns (all of the p-values are larger than 0.10). This implies that the audit quality improvement is insignificant when there is a previous working relationship between outgoing and incoming audit partners. The findings in Table 5 provide generally consistent support for H2.
4.3.2. Endogeneity
A potential concern is that our study might be subject to endogeneity problems, especially for model (1). In model (1), whether outgoing audit partners rotate back after the cooling-off period can be determined by factors that are not incorporated into the empirical model. For instance, 1) the outgoing audit partner chooses to come back because s/he is not independent from the client, and the incoming audit partner concedes to her/his demand; 2) the client prefers the outgoing audit partner to come back because s/ he has superior knowledge about the client's affairs compared to the incoming audit partner. These omitted factors can confound the effect of previous working relationships between outgoing and incoming audit partners.
P a g e 28 | 50 equals 1 if the outgoing audit partner is a specialist in client's industry but the incoming audit partner is not, and 0 otherwise. We define industry specialists as partners whose industry-year market share belong to the highest quartile of its distribution (Zerni, 2012). Audit partners' market share are calculated based on clients' total assets. This variable is used to control for an outgoing audit partner's superior knowledge about a client's affairs.
Table 6 presents the regression results after adding the abovementioned variables into model (1). The coefficients loading on WR are significantly positive across all two columns, suggesting that outgoing audit partners are more likely to rotate back if they have previous working relationships with incoming audit partners, which is consistent with H1.
We believe model (2) has fewer endogeneity concerns as mandatory audit partner rotations are exogenous to both firms and auditors (Lennox et al., 2014). However, to check the robustness, we add firm fixed effects into model (2). We report regression
Table 5
Previous working relationship, mandatory rotation, and audit quality
— alternative measure of audit quality.
Dependent variable: NRI
Column 1 Column 2 Column 3
PreMR vs. PostMR(1–2) PreMR vs. PostMR(1) PreMR vs. PostMR(2)
Panel A: without interaction terms.
Intercept 1.4025 1.4389 1.4401
(28.45)⁎⁎⁎ (26.43)⁎⁎⁎ (26.09)⁎⁎⁎
POST −0.0011 −0.0011 −0.0007
(−0.31) (−0.28) (−0.14)
LTA −0.0724 −0.0748 −0.0737
(−26.48)⁎⁎⁎ (−27.34)⁎⁎⁎ (−24.61)⁎⁎⁎
P a g e 29 | 50 (−3.47)⁎⁎⁎ (−3.14)⁎⁎⁎ (−2.55)⁎⁎
OPROA −0.5001 −0.5028 −0.4933
(−32.47)⁎⁎⁎ (−32.44)⁎⁎⁎ (−27.59)⁎⁎⁎
LOSS −0.0183 −0.0160 −0.0129
(−0.89) (−0.62) (−0.56)
RECV −0.0128 −0.0088 −0.0181
(−0.79) (−0.51) (−1.14)
INV 0.0331 0.0320 0.0277
(3.02)⁎⁎⁎ (2.73)⁎⁎⁎ (2.18)⁎⁎
CASHFLOW 0.1410 0.1386 0.1424
(7.09)⁎⁎⁎ (6.78)⁎⁎⁎ (6.32)⁎⁎⁎
LISTAGE 0.0001 0.0001 −0.0002
(0.20) (0.11) (−0.30)
GROWTH 0.0002 0.0005 0.0027
(0.16) (0.34) (1.03)
ISSUANCE 0.0043 0.0034 0.0067
(0.97) (0.67) (1.34)
AFTEN −0.0022 −0.0025 −0.0022
(−3.33)⁎⁎⁎ (−3.46)⁎⁎⁎ (−3.19)⁎⁎⁎
MC 0.0083 0.0060 0.0090
(1.16) (0.76) (1.12)
LNAF 0.0179 0.0188 0.0169
(5.75)⁎⁎⁎ (5.82)⁎⁎⁎ (4.95)⁎⁎⁎
YRAE Control Control Control
INDUSTRY Control Control Control
Adj. R2 0.7148 0.7243 0.7144
N
Panel B: with interaction terms.
2652 2252 2198
Intercept 1.4044 1.4405 1.4424
(16.21)⁎⁎⁎ (26.51)⁎⁎⁎ (16.84)⁎⁎⁎
WR 0.0006 0.0009 0.0008
(0.11) (0.25) (0.14)
P a g e 30 | 50
(2.13)⁎⁎ (1.76)⁎ (1.61)
POST −0.0090 −0.0103 −0.0089
(−1.79)⁎ (−1.54) (−1.30)
LTA −0.0724 −0.0749 −0.0737
(−15.33)⁎⁎⁎ (−27.31)⁎⁎⁎ (−15.95)⁎⁎⁎
LEV −0.0398 −0.0390 −0.0331
(−2.89)⁎⁎⁎ (−3.14)⁎⁎⁎ (−2.43)⁎⁎
OPROA −0.5000 −0.5029 −0.4930
(−23.19)⁎⁎⁎ (−32.42)⁎⁎⁎ (−20.86)⁎⁎⁎
LOSS −0.0183 −0.0164 −0.0125
(−0.86) (−0.63) (−0.55)
RECV −0.0129 −0.0091 −0.0181
(−0.59) (−0.52) (−0.88)
INV 0.0324 0.0315 0.0271
(1.80)⁎ (2.70)⁎⁎⁎ (1.43)
CASHFLOW 0.1408 0.1381 0.1428
(5.73)⁎⁎⁎ (6.76)⁎⁎⁎ (5.31)⁎⁎⁎
LISTAGE 0.0002 0.0001 −0.0002
(0.15) (0.18) (−0.15)
GROWTH 0.0003 0.0006 0.0028
(0.20) (0.41) (1.15)
ISSUANCE 0.0045 0.0036 0.0069
(1.05) (0.70) (1.36)
(continued on next page) Table 5 (continued)
Dependent variable: NRI
Column 1 Column 2 Column 3
PreMR vs. PostMR(1–2) PreMR vs. PostMR(1) PreMR vs. PostMR(2)
P a g e 31 | 50 (−1.97)⁎⁎ (−3.77)⁎⁎⁎ (−2.02)⁎⁎
MC 0.0099 0.0075 0.0099
(0.86) (0.94) (0.87)
LNAF 0.0179 0.0189 0.0168
(3.58)⁎⁎⁎ (5.86)⁎⁎⁎ (3.30)⁎⁎⁎
YRAE Control Control Control
INDUSTRY Control Control Control
F statistic for POST + WR ∗
POST = 0
0.26 0.42 0.22
(p-value) (0.6101) (0.5184) (0.6369)
Adj. R2 0.7156 0.7249 0.7149
N 2652 2252 2198
t-Statistics are reported in parentheses. Variable definitions:
NRI: industry-median adjusted non-recurring items. All other variables are defined as in Table 2.
⁎⁎⁎Represents the 1% significance level (two-tailed).
⁎⁎Represents the 5% significance level (two-tailed).
⁎Represents the 10% significance level (two-tailed).
results in Table 7. Regression results show that coefficients on WR ∗ POST are positive across all of the three columns (but only significant in column 1), suggesting that audit quality improvement is smaller after mandatory rotation when there is a previous working relationship between outgoing and incoming audit partners.
4.3.3. Placebo tests
To corroborate the casual effect of previous working relationships between outgoing and incoming audit partners on audit quality improvement after mandatory rotation, we conduct placebo tests. We bootstrap the data by randomizing the audit partner rotation years so that each rotation is assigned to a “pseudo-event” year. We restrict the randomly assigned year of each rotation belonging to the pre-rotation period. This way, we can ensure that each rotation has a two-year post-rotation period, which is essential to investigate the audit quality improvement after rotation. We then estimate model (2) using the randomized data. This procedure is repeated 1000 times. Untabulated results show that more than 95% of the coefficients on WR
P a g e 32 | 50 treatment and control groups during the post-mandatory rotation period in the absence of treatment. Thus, we conclude that the causal relation we established is reliable.
4.3.4. Other robustness tests
We also perform additional robustness tests to further corroborate our findings. For example, for model (2), to obtain a perfectly controlled experiment, we reconstruct the control group (WR = 0) by adding a requirement that there are no audit partner changes during the post-rotation periods. Untabulated results show that our findings remain qualitatively unchanged. In another example, we split our full sample into two subsamples based on whether audit firms are Big-4 audit firms and re-estimate model (2) using these two subsamples separately. Unreported results show that the negative effect of previous working relationships between rotating partners on audit quality improvement exists in both Big-4 and non-Big-4 subsamples.
5. Additional analyses
5.1. Does rotating back matter?
P a g e 33 | 50 insignificant. These results suggest that the impact of previous working relationships between rotating audit partners on audit quality improvement is more pronounced when outgoing partners rotate back after the
Table 6
Previous working relationship and rotate back — endogeneity problems.
(0.86) (1.08)
WR 0.9734 0.9853
(16.92)⁎⁎⁎ (16.92)⁎⁎⁎
GENDER 0.4269 0.4165
(3.43)⁎ (3.17)⁎
AGE 0.0044 0.0105
(0.05) (0.27)
EDUCATION 0.0299 0.0368
(0.02) (0.03)
EXPER −0.1049 −0.1093
(5.89)⁎⁎ (6.16)⁎⁎
TTENURE 0.0358 0.0379
(0.96) (1.04)
AFSIZE 0.0074 0.0075
(0.99) (1.04)
SPECNUM 0.0163 0.0185
(0.30) (0.38)
SPECPAIR 0.0736 0.1473
(0.07) (0.29)
GROWTH 0.0208 −0.0233
(0.01) (0.01)
LTA −0.1380 −0.1543
(1.75) (2.21)
P a g e 34 | 50
OPROA 2.0046 2.2933
(2.17) (2.87)⁎
LEV −0.0430 −0.0998
(0.01) (0.06)
LIQ −0.0093 −0.0130
(0.09) (0.15)
RECV −1.7000 −1.8430
(2.69) (3.15)⁎
INV −0.4301 −0.4309
(0.30) (0.30)
ISSUANCE −0.0802 −0.1166
(0.04) (0.08)
DEP −0.2008 −0.3320
(0.24) (0.65)
SUPERIOR −0.6107
(3.67)⁎
Pseudo R2 0.1194 0.1309
N 436 436
Wald-statistics are reported in parentheses. Variable definitions:
DEP: outgoing audit partner's economic dependence on a certain client, which is measured as the ratio of one client's audit fees to all clients' audit fees for an outgoing audit partner in a particular year.
SUPERIOR: dummy variable, which equals 1 if outgoing audit partner is a specialist for client's industry while incoming audit partner is not, and 0 otherwise.
All other variables are defined in Table 2.
⁎⁎⁎Represents the 1% significance level (two-tailed).
⁎⁎Represents the 5% significance
P a g e 35 | 50 10% significance level
(two-tailed).
cooling-off period. This is quite interesting as it shows a greater connection between H1 and H2. Specifically, outgoing audit partners intend to rotate back as mandatory rotation brings them a loss of client resources. To rotate back smoothly, outgoing audit partners prefer the incoming audit partners to be close relations and cater to client needs by influencing incoming audit partners' work (H1). This would inhibit the ability of a rotation to result in a fresh perspective and impair audit quality improvement after mandatory rotation (H2). By linking H1 and H2, we could reasonably expect that rotating back indicates outgoing audit partners exert more influence on incoming audit partners' work, thus resulting in greater impairment of audit quality improvement. In other words, the rotations that rotate right back pose major independence threats.
Table 7
Previous working relationship, mandatory rotation, and audit quality
— add firm fixed effects.
Dependent variable: |DA|
Column 1 Column 2 Column 3
PreMR vs. PostMR(1–2) PreMR vs. PostMR(1) PreMR vs. PostMR(2)
Intercept 0.1914 0.2002 0.2025
(3.66)⁎⁎⁎ (3.66)⁎⁎⁎ (3.51)⁎⁎⁎
WR ∗POST 0.0174 0.0166 0.0207
(2.16)⁎⁎ (1.58)a (1.56)b
POST −0.0349 −0.0315 −0.0304
(−4.61)⁎⁎⁎ (−3.36)⁎⁎⁎ (−2.41)⁎⁎
LTA −0.0076 −0.0101 −0.0098
(−2.54)⁎⁎ (−3.04)⁎⁎⁎ (−3.01)⁎⁎⁎
LEV 0.0421 0.0434 0.0440
(3.57)⁎⁎⁎ (3.37)⁎⁎⁎ (3.31)⁎⁎⁎
P a g e 36 | 50
(0.21) (0.59) (0.37)
LOSS −0.0175 −0.0085 −0.0145
(−1.25) (−0.48) (−0.90)
RECV −0.0063 0.0040 0.0030
(−0.27) (0.17) (0.12)
INV 0.0547 0.0565 0.0436
(3.44)⁎⁎⁎ (3.23)⁎⁎⁎ (2.49)⁎⁎
CASHFLOW −0.0661 −0.0740 −0.0453
(−1.85)⁎ (−1.92)⁎ (−1.14)
LISTAGE −0.0079 −0.0096 −0.0099
(−9.22)⁎⁎⁎ (−10.23)⁎⁎⁎ (−10.35)⁎⁎⁎
GROWTH −0.0438 −0.0463 −0.0520
(−6.73)⁎⁎⁎ (−6.67)⁎⁎⁎ (−7.31)⁎⁎⁎
ISSUANCE 0.0000 0.0014 −0.0015
(0.00) (0.19) (−0.19)
AFTEN 0.0004 0.0002 0.0009
(0.40) (0.21) (0.89)
MC 0.0157 0.0124 0.0136
(1.09) (0.81) (0.87)
LNAF 0.0092 0.0101 0.0118
(1.89)⁎ (1.94)⁎ (2.24)⁎⁎
YRAE Control Control Control
FIRM Control Control Control
F statistic for POST + WR ∗
POST = 0
13.17 6.81 4.38
(p-value) (0.000) (0.000) (0.0358)
Adj. R2 0.1982 0.2421 0.2373
N 2652 2252 2198
t-Statistics are reported in parentheses. All variables are defined in Table 2.
a p =
11.50%.
b p =
11.96%.
⁎⁎⁎Represents the 1% significance level (two-tailed).
P a g e 37 | 50
⁎Represents the 10% significance level (two-tailed).
5.2. Final year of outgoing audit partner tenure
Lennox et al. (2014) document that audit adjustments become more frequent during the final year of outgoing audit partner tenure, suggesting that audit quality is improved in the year immediately before mandatory rotation. Here, we investigate whether there is a difference in audit quality between the final year of outgoing audit partner tenure and all other PreMR years, and we further examine the incremental effect of the previous working relationships between outgoing and incoming audit partners. We estimate the following regression model:
where FINAL is a dummy variable which equals 1 if the outgoing audit partner is in the final year of tenure and 0 otherwise. All other variables are defined in model (2).
Results are presented in Table 9. In column 1, we investigate the audit quality improvement in the final year of outgoing audit partner tenure without considering the impact of previous working relationships between rotating partners. Our variable of interest is
Table 8
Previous working relationship, mandatory rotation, and audit quality
— rotate back or not rotate back.
Dependent variable: |DA|
Column 1 Column 2 Column 3
PreMR vs. PostMR(1–2) PreMR vs. PostMR(1) PreMR vs. PostMR(2)
Panel A: rotate back.