Web Components as a measure for estimating
Effort and Size of Web Applications
Sworoop Suhanjan Das#1, Kumar Devadutta*2 Santosh Kumar Swain#3, Sanjay Kumar#4 #
School of Computer Engineering, KIIT University Bhubaneswar, India
*Innovadors Lab, Bhubaneswar, India
Abstract
—
Estimating size and effort is a crucial factor in application development projects and low error margins are a priority. In line with the very fast evolution of Internet technologies, all applications are quickly becoming Web Applications. Thus there is a clear need for an estimation model for these applications' development projects. The objective of this paper is to illustrate a new Web Application cost estimation model that can form the starting point for any development project. The concept of Web components can be well implied to calculate the Web size and effort. In this paper we have taken 10 projects of a software company and have calculated the effort and size using Web components.Keywords
—
Web components, Internal Logical Files, Web building blocks, Web Component Model.
I. INTRODUCTION
The Web is used as the delivery platform for two types of applications: web hypermedia applications and web software applications [1]. A Web hypermedia application is a non-conventional application characterized by the authoring of information using nodes (chunks of information commonly used for developing such applications are HTML, JavaScript and multimedia[10]. Estimating the size of web applications poses new problems for cost analysts. Because hypertext languages (html, xml, etc.), multi-media files (audio, video, etc.), scripts (for animation, bindings, etc.) and web building blocks (active components like ActiveX and applets, building blocks like buttons and objects like shopping carts, and static components like DCOM and OLE) are employed in such applications, it is difficult to use traditional size metrics like source lines of code and function points [2]. Improved size estimating techniques are therefore needed to address the
shortfall. Based on the size estimation, the effort required to complete the project and the duration over which the development is to be carried out are estimated. Based on the effort estimation the cost of the project is computed [8]. The estimated cost forms the basis on which the price negotiations with the customer are made. Estimating time and cost is a crucial factor in application development projects and low error margins are a priority [9]. Recently growth of the web as a delivery environment has given rise to a new research field- Web Engineering, the applications of the engineering principles to develop quality web applications inline with the very first evolution of internet technologies, all applications are quickly becoming web applications. Thus there is a clear need for an estimation model for these applications development projects.
The rest of the paper is organized as follows. In section II, we give a survey of related works, and motivation for our work. The details of the proposed Model are described in section III. Result of the performance evaluation is given in section IV. Section V concludes the paper with future work.
II. RELATED WORK
Sizing software systems can be quite a complex task, if applications developed with new or emerging technologies must be measured using metrics tailored for different technologies/ architectures. This is the case of adapting functional sizing for Object Oriented systems, where Function point [9], OOFP (Object Oriented Function Points [5]), Object Points [6], Use Case Points and Class Points [3] constitutes the most important attempts in defining a measure where an object decomposition of the system is much more natural than a functional one.
problem of sizing web systems from different point of views. Unfortunately, they were found to be quite unfit for providing a reliable metric able to size in an easy and consistent way. So here an attempt was made where web components are used to calculate the effort and size of a project.
III.PROPOSED WORK
Web components are used to represent the size of Web applications. Web components are an extension of function points that take predictors that web applications are sensitive to into account as the size of such applications are being estimate. Web components extend traditional function points to take the following four additional types of objects into account because they require additional effort to incorporate them into web applications:
Multi-media files – size predictors developed to take the effort required to incorporate audio, video and images into applications. Such effort includes the work involved in creating web pages; creating video for the web (MPEG-1&2 files); creating publishable documents for the web; and creating, editing and enhancing complex images for both clients and servers.
Web building blocks – size predictors developed to take the effort required to develop web-enabled fine-grained component and building block libraries and any wrapper code required to either instantiate or integrate them. Such predictors do not count the standard libraries that come as part of your web environment and typically include both Windows and Java components. Instead, they take only the additional active (ActiveX, applets, agents, guards, etc.), fine-grained static (COM, DCOM, OLE, etc.) and course-grain reusable (shopping carts, buttons, logos, etc.) building blocks that you acquire or develop to incorporate into web applications into account for both your client and server.
Scripts – size predictors developed to take the effort required to link html/xml data and generate reports automatically; query ODBC-compliant databases via prompts; integrate and animate applications via predefined logic (via GIF); and direct dynamic web content per customizable pallets, masks, windows and commands (streaming video, real-time 3D, special effects, motion, guided workflow, batch capture, etc.) for both clients and servers.
Links (xml, html and query language lines) – size predictors developed to take the effort required to link applications, integrate them together dynamically and bind them to the database and other applications in a persistent manner.
The base of the estimate is still function points. Rather than replace them, they are extended because they still can be used to accurately estimate the size of Web applications. . To count web components, we evaluate the following twelve sub-components of a web system based upon user requirements and page layouts:
Internal Logical Files – logical, persistent entities maintained by the web application to store information of interest.
Multi-Media Files – physical, persistent entities used by the web application to generate output in multi-media format.
Web Building Blocks – logical, persistent entities used to build the web applications and automate their functionality.
Scripts– logical, persistent entities used by the web application to link internal files and building blocks together in predefined patterns.
Links – logical, persistent entities maintained by the web application to find links of interest to external applications
External Interface Files – logical, persistent entities that are referenced by the web application, but are maintained by another software application.
External Inputs – logical, elementary business processes that cross into the application boundary to maintain the data on an Internal Logical File, access a Multi-Media File, invoke a Script, access a Link or ensure compliance with user requirements.
External Outputs – logical, elementary business processes that result in data leaving the application boundary to meet a user requirements (e.g., reports, screens).
External Queries – logical, elementary business processes that consist of a data “trigger” followed by a retrieval of data that leaves the application boundary (e.g., browsing of data).
Navigation- the total number of pages associated in the web application and the inter web traversal.
Graphical files- the number of files present in the web application which are not multimedia neither animated files. Example- marquee files.
Reusability- degree of reuse planned and executed. .
Based upon the research the proposed metric, Web Components, computes size by considering each of the many elements that comprise the Web application. The metric computes size using Halstead’s equation for volume (that is, a proposed measure of size that is language independent and related to the vocabulary used to describe it in terms of operands and operators) as follows:
V* = N log2(n) = (N1* + N2*) log2 (n1* + n2*) where
N = number of total occurrences of operands and operators n = number of distinct operands and operators
N1* = total occurrences of operand estimator N2* = total occurrences of operator estimators n1* = number of unique operands estimator n2* = number of unique operators estimators
counting conventions. This approach can achieve consistency across organizations and resolve conflicts, because size
estimates are formulated using such standards.
Table 1: Web components predictor lists
Web components predictors Example operands Example operators
Number of building blocks Fine grained components (ActiveX,DCOM, OLE, etc.),
Create, apply, call, dispatch, interface, terminate,widgets
Number of COTS components
(includes any wrapper code) Commercial packages, library routines, objects like shopping carts, … Initiate, terminate, apply, bind, customize, export, wrap, … Number of multimedia files Text, video, sound, 3D objects, plug-ins,
metatags (no graphics files), … Create, cut, paste, clear, edit, animate, broadcast, … Number of object or application
points (or others proposed) # server data tables, # states, # client data tables, percent reuse, … Transform (inputs to outputs), access, generate, Number of xml, sgml, html and
query language lines # lines including links to data attributes # lines including links to data attributes Number of Web components Applets, agents, guards, … Create, schedule, dispatch, … Number of graphics files Templates, pictures, images, … Apply, align, import, export, insert, … Number of scripts (visual language
audio, motion, and so forth)
Macros, containers, … Create, store, edit, distribute, serialize, generalize, … Other
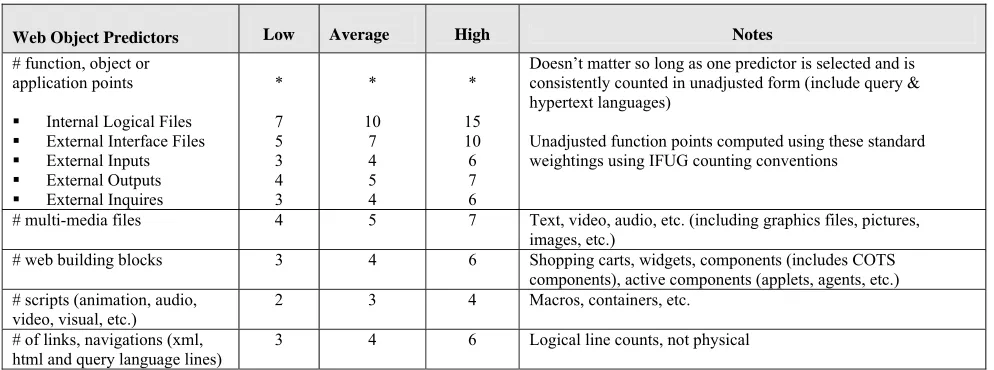
Table 2 – Web Component Calculation Worksheet
Web Object Predictors Low Average High Notes
# function, object or application points Internal Logical Files External Interface Files External Inputs External Outputs External Inquires
* 7 5 3 4 3
* 10
7 4 5 4
* 15 10 6 7 6
Doesn’t matter so long as one predictor is selected and is consistently counted in unadjusted form (include query & hypertext languages)
Unadjusted function points computed using these standard weightings using IFUG counting conventions
# multi-media files 4 5 7 Text, video, audio, etc. (including graphics files, pictures, images, etc.)
# web building blocks 3 4 6 Shopping carts, widgets, components (includes COTS components), active components (applets, agents, etc.) # scripts (animation, audio,
video, visual, etc.) 2 3 4 Macros, containers, etc. # of links, navigations (xml,
html and query language lines)
3 4 6 Logical line counts, not physical
The predictors weight are given in Table 2 Web component calculation worksheet [9]. Using the estimating procedure in Table 3, we compute the number of Web Components. First the number of operands is counted primarily from the information in the web page specification. . Once we have estimated the operands and operators are estimated, they are adjusted according to the suggestions in Table 2 to determine their weightings. Then, the number of adjusted number links
and unadjusted number of function points (or alternative) are added to compute the number of Web Components. In software science terms, this total number represents the Length (L) of the program. Like function points, the key to developing repeatable Volume predictor counts is a well-defined set of counting conventions. We can achieve consistency across organizations and resolve conflicts as size estimates are formulated using such standards. Based on the language in which the application has to be
developed the size is calculated by considering the LEF value[11] of the corresponding script and multiplying it with the Web components
These values are given in International Function Point Users Group (IFPUG) [11]. Traditional cube-root relationship for
Table 3: Estimating procedure
Step Description Example Counting Conventions
1 Count the number of unique operands for the new predictors
(use counting conventions in the Manual to provide guidelines)
Multi-media fies (audio, video, animation, graphics, etc.)
Count each graphic files separately independent of its pixel density (JPEG, etc.) Scripts (macro, distiller, etc.)
Count each script or use case separately independent of the number of actors involved (i.e., we will use the number of actors to determine difficulty rating)
Web building blocks (DCOM, OLE, etc.)
Count each unique building block in the library separately independent of the resources it consumes
2 Count the number of unique operators for the new predictors
(use counting conventions in the Manual to provide guidelines)
Multi-media files (audio, video, animation, graphics, etc.)
Count each unique operation on the files separately (open, close, save, cut, paste, start, clear, etc.)
Scripts (macro, distiller, etc.)
Count each unique scripting operation separately (open, close, start, refresh, search, go (backwards), go (favorites), go (forward), go (hyperlink), etc.)
Web building blocks (DCOM, OLE, etc.)
Count each unique operation on the building blocks separately (align, center, distribute, draw, edit, merge (cells), split (cells), find, add, delete, insert, etc.)
3 Sum the operands and operators and determine the weighting in Table (use the counting conventions in the Manual to provide guidelines)
Multi-media files (audio, video, animation, graphics, etc.) JPEG – low
A2b music, Microsoft picture it - average
PCX Image, XIF: Image, AIFF Audio, Liquid Audio, Steaming Audio/Video – high
Scripts (macro, distiller, etc.) 1 to 3 actors – low 4 to 6 actors – average more than 6 actors – high
Web building blocks (DCOM, OLE, etc.) 1 to 50 – low
51 to 250 – average more than 250 - high
4 Add the weighted number of links (xml, html and query language lines) to the counts
Use logical line counting conventions offered by the Software Engineering Institute to guide the effort
html – low
query lines – average xml – high
5 Compute the raw number of Web Objects (unadjusted for either language or other factors)
The new predictors increase the volume of work to handle multi-media files, scripts and web building block operands and operations as linked together and with the system via xml, html and query languages
6 Compute the number of Web Objects
Sum the predictors and add them to the number of unadjusted function points or alternative
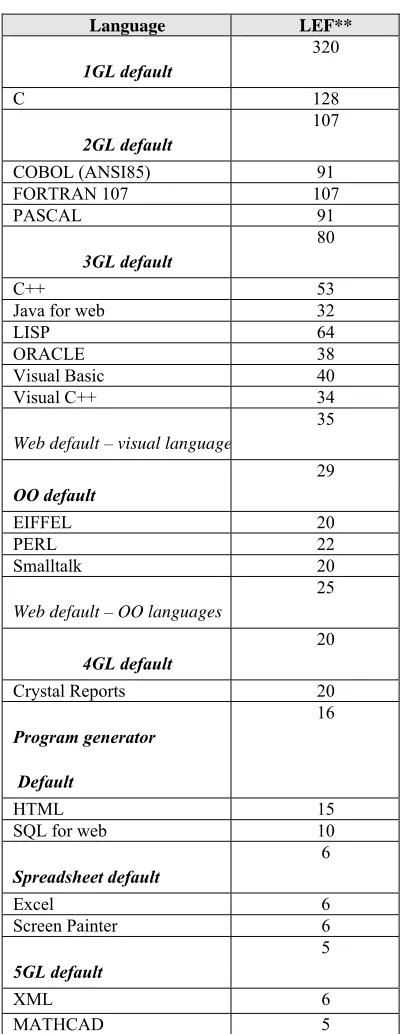
The LEF table is given below:
Table 4: LEF Table
Language LEF**
1GL default
320
C 128
2GL default
107
COBOL (ANSI85) 91
FORTRAN 107 107
PASCAL 91
3GL default
80
C++ 53
Java for web 32
LISP 64 ORACLE 38
Visual Basic 40
Visual C++ 34
Web default – visual language
35
OO default
29
EIFFEL 20 PERL 22 Smalltalk 20
Web default – OO languages
25
4GL default
20
Crystal Reports 20
Program generator
Default
16
HTML 15
SQL for web 10
Spreadsheet default
6
Excel 6
Screen Painter 6
5GL default
5
XML 6 MATHCAD 5
The initial data analysis reveals that the square-root relationship seems to exist for projects smaller than 100 Web components. For larger projects, the cube-root
relationship seems to produce a better fit. Such a variable schedule law relationship is expected because software science scales effort mathematically as a function of length and volume to predict duration. Now that these mathematical issues are out of the way, let’s take a good look at the model that is proposed for estimating Web development costs. The new model is called, Web Component Model because it is an extension of the Cocomo II[ 4] early design model. Its mathematical formulation rests upon parameters from both the Cocomo II and SoftCost-OO software cost-estimating models [4].
n
Effort = A (Π (total web components*LEF))p1 cdi i=1
Where A=constant. p1=power law Cdi=cost drivers
LEF= Language expansion factor The cost drivers [10] include
RCPX: product reliability and complexity (product attributes);
PDIF: platform difficulty (volatility of platform and network servers);
PERS: personnel capability (skills, knowledge and abilities of the workforce);
PREX: personnel experience (the breadth and depth of the team’s experience);
FCIL: facilities (tools, equipment and colocated facilities);
SCED: schedule (degree of risk taken to shorten duration);
TEAM: teamwork (the ability to work synergistically as a team); and
PEFF: process efficiency (streamlined for the business)\
The Web applications can be broadly divided into four categories as given in Table 5 [11]. Each category has its value for A and P1. Based on these categories the effort for corresponding Web projects can be calculated by putting the appropriate values for different Web applications.
Table 5: Web development model parameter values
Categories of web applications A P1 Web-based electronic commerce
2.3 1.05 Financial/trading applications
2.7
1.05 Business-to-business applications
2 1.00 Web-based information utilities
IV.RESULTS
After finding out all the parameters needed to calculate
Effort the model was tested by taking the data of ten web based application of an Indian software company. As an example of calculation procedure the following data were used from one of the Web based electronic commerce application. It should be noted that these data were collected from the SRS document prepared by the
company prior to the start of the developmental stage. Total Web components for rest projects were calculated
in the similar manner and the values are represented in the following table 6. The values of the web components are calculated for all the projects and based on that the effort is calculated it is termed as Effortpred.. To evaluate
the accuracy of the obtained estimations, we used some summary measures, namely MMRE, and Pred(0.25) , which have been widely used in many comparisons to assess the accuracy of software estimation models . In the following, we briefly recall the main concepts underlying the MMRE and Pred(0.25)[9].
The prediction at level 0.25, defined as:
Pred(0.25) = k /N
Table 6: Value of Web Components
Projects Web Components
Project 1 301
Project 2 415
Project 3 470
Project 4 376
Project 5 661
Project 6 580
Project 7 428
Project 8 509
Project 9 433
Project 10 396
where k is the number of observations whose MRE is less than or equal to 0.25. N is the total number of observations. Pred(0.25) is a quantification of the percentage of predictions whose error is less than 25%. A good effort estimation model should have a MMRE≤0.25 and Pred(0.25)≥0.75, meaning that the mean estimation error should be less than 25%, and at least 75% of the estimated values should fall within 25% of their actual values. Comparing the results of the Effortpred and Effortactual we calculate the MRE.Mean
Magnitude of Relative Error (MMRE) is given by: n
MMRE = ( ∑ MRE)/n i=1
After finding out the Effortpred for the 10 projects it is
compared with the Effort act which is determined from
the Company’s data set. The MMRE and Pred(0.25) is calculated and is shown in Table 7.
Table 7: Results
The 301 web component count in represents overall size of the program that would be required for this web application in case of project 1. Now the actual size can be calculated from the Language Expansion Factors listed in Table 4.
The method adopted to calculate size is given by
Size=no of web components *LEF of the script used
Based on the language in which the application has to be developed the size is calculated by considering the LEF value of the corresponding script and multiplying it with the web objects. This values are given in International Function Point Users Group (IFPUG)[11]. For example the Project 1 has 301 web objects and the language used is java. Hence the size is given by:
Size=301*32=9632 LOC
This count includes the volume of work required to program Java scripts and beans on both the client and server assuming that an appropriate Java environment were available.
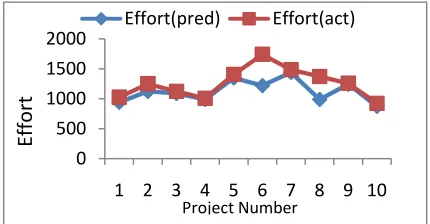
Fig 1 shows the results of the Effort pred and Effortact and
it is evident that the graph coincides at number of points which validates that the result obtained is nearly correct to the actual effort.
0 500 1000 1500 2000
1 2 3 4 5 6 7 8 9 10 Effort(pred) Effort(act)
Project Number
Ef
fort
V. CONCLUSION
The proposed model successfully predicted the effort required to complete different web applications. Web Components were used as the fundamental units used to calculate the effort and size. The MMRE was determined to be .07 and the Pred (0.25) was 80%. The proposed model can be well implemented in various web applications. Bigger web application effort can also be calculated by correct determination of web components. This can be termed as a more specific approach for estimating effort and size. In order to reduce the error rate and increase the prediction rate more parameters can be found out and the size and effort can be calculated.
REFERENCE
[1]B. Kitchenham, E. Mendes, and Travassos. Cross versus within-company cost estimation studies: A systematic review. IEEE Transaction on Software Engineering, 33(5):316–329, 2007.
[2]. S. Di Martino, F. Ferrucci, C. Gravino, and E. Mendes. Comparing size measures for predicting web application development effort: A case study. In Proceedings of Empirical Software Engineering and Measurement, pages 324– 333. IEEE press, 2007.
[3]. G. Costagliola, F. Ferrucci, G. Tortora, and G. Vitiello, “Class point: An approach for the size estimation of object-oriented systems,” IEEE Transactions on Software Engineering, vol. 31, no. 1, pp. 52–74, Jan. 2005.
[4]. B. W. Boehm, C. Abts, A. W. Brown, S. Chulani, B. K. Clark, W. Horowitz, R. Madachy, D. Reifer, and B. Steece, Software Cost Estimation With COCOMO II. New Jersey: Prentice Hall, 2000. [5] Mendes, E., and Mosley, N. ,“Investigating Early Web Size Measures for Web Cost Estimation”, Proc. ACOSM 2000, Sydney, Australia.
[6] Mendes, E., and Counsell,S.,”Web Metrics Estimating Design And Authoring Effort”, Proc. IFPUG 2001 Conference.
[7] Cowderoy, A.J.C., 2000. “Measures of size and complexity for web-site content”, Proc. Combined 11th ESCOM Conference and the 3rd SCOPE conference on Software Product Quality, Munich, Germany, 423--431.
[8] Cleary, D. 2000. “Web-based development and functional size measurement”. Proc. IFPUG 2000Conference.
[9]L. Baresi and S. Morasca, “Three Empirical Studies on Estimating the Design Effort of Web Applications”, Transaction on Software Engineering and Methodology, 16(4), 2007.
[10] G. Costagliola, S. Di Martino, F. Ferrucci, C. Gravino, G. Tortora, G. Vitiello, “A COSMIC-FFP: Approach to Predict Web Application Development Effort”, Journal of Web Engineering 5(2), 2006, pp. 93-120.