Scholarship@Western
Scholarship@Western
Electronic Thesis and Dissertation Repository
12-6-2017 10:30 AM
Rendering real-time dashboards using a GraphQL-based UI
Rendering real-time dashboards using a GraphQL-based UI
Architecture
Architecture
Naresh Eeda
The University of Western Ontario Supervisor
Madhavji, Nazim H.
The University of Western Ontario The University of Western Ontario Graduate Program in Computer Science
A thesis submitted in partial fulfillment of the requirements for the degree in Master of Science © Naresh Eeda 2017
Follow this and additional works at: https://ir.lib.uwo.ca/etd Part of the Software Engineering Commons
Recommended Citation Recommended Citation
Eeda, Naresh, "Rendering real-time dashboards using a GraphQL-based UI Architecture" (2017). Electronic Thesis and Dissertation Repository. 5136.
https://ir.lib.uwo.ca/etd/5136
This Dissertation/Thesis is brought to you for free and open access by Scholarship@Western. It has been accepted for inclusion in Electronic Thesis and Dissertation Repository by an authorized administrator of
i
With the increase in the complexity of the systems being built and demand in the quality of
service by the customers, developing and providing highly efficient real-time systems is one
of the biggest challenges today for software enterprises. BluemixTM ─ IBM’s cloud offering
implemented on Cloud Foundry, an open source “Platform as a Service” (PaaS), is an
example of such a system. Currently, there are approx. 26 infrastructural services running in
the background from where the data is fetched and is rendered on different dashboards of the
system. However, the system suffers from performance issues.
This thesis focuses on the front-end and business-logic technologies with an aim to improve
the performance of web applications. This thesis proposes and implements a GraphQL-based
UI architecture which can be integrated into any of the new/existing web applications to
boost the performance by fetching only the client-specific data faster i.e. the client specifies
the server about the exact data to be fetched thereby avoiding over-fetching or under-fetching
of the data.
We also integrate and implement the proposed architecture into the existing Bluemix system
and explore the key performance improvements of the real-time dashboards. This
architecture implements caching and asynchronous loading for serving the required data to
display the dashboards in the Bluemix console fast and incrementally loading the data. This
thesis paves the way for further work in the performance improvement of the web
applications. The test results of this architecture’s implementation on the Bluemix Usage
Dashboard show that the Real data renders 245% faster and the Switching Account 153%
faster than the existing system.
Keywords
GraphQL, Dashboards, Performance, Bluemix, Real-time, Web Sockets, Data Streaming,
ii
Acknowledgments
First, I would like to express my profound gratitude to my advisor Dr. Nazim H Madhavji,
for the continuous support of my master’s program and research, for his patience, motivation,
and immense knowledge. It was his supervision and guidance that helped me to decide my
research path and walk through it. His planned regular meetings and presentations taught me
to read papers and analyze them.
I am grateful to IBM (International Business Machines Corporation) for giving me the
opportunity to do part of my research in their premises through an internship program. My
sincere thanks to Jon Bennett, Senior Software Engineer – Bluemix UI, for being an excellent
supervising mentor at IBM who not only guided me throughout the internship but also in my
Master’s research.
I thank my fellow lab mates, Nikita Sokolov, Darlan Arruda and Ibtehal Noorwali, for the
stimulating discussions during our group meetings and presentations, for the sleepless nights
we were working together before deadlines, and for all the fun we have had in the last few
years. It was our lab environment that made the whole research thing smooth and thought
provoking.
Last but not the least, I would like to thank my family for supporting me spiritually
iii
Table of Contents
Abstract ... i
Acknowledgments... ii
Table of Contents ... iii
List of Figures ... vi
Chapter 1 ... 1
1. Introduction ... 1
1.1 Performance ... 1
1.2 UI Development ... 2
1.3 Research Question ... 2
1.4 Solution Approach ... 4
1.5 Key Research Results ... 4
1.6 Novelty ... 5
1.7 Structure of the thesis ... 5
Chapter 2 ... 6
2. Background and Literature Review ... 6
2.1 Related Work ... 6
2.2 Background ─ IBM Bluemix ... 7
2.3 Account Usage Dashboard ... 8
2.4 Client-side Technologies and Communication Protocols ... 10
2.5 Analysis of client-side technologies... 10
2.5.1 React ... 10
2.5.2 Regular HTML and jQuery ... 11
2.5.3 Vue ... 11
iv
2.5.5 Redis ... 13
2.6 Analysis of Communication Protocols ... 13
2.6.1 SOAP ... 14
2.6.2 Remote Procedure Call ... 15
2.6.3 Apache Thrift ... 15
2.6.4 gRPC ... 15
2.6.5 REST ... 16
2.6.6 GraphQL ... 16
2.7 Discussion ... 19
Chapter 3 ... 21
3. Research Methodology... 21
Chapter 4 ... 23
4. Proposed Architecture ... 23
4.1 Technologies ... 24
4.2 New Usage Dashboard ... 30
Chapter 5 ... 35
5. Validation and Results ... 35
5.1 Research Results ... 35
5.2 Validation ... 36
Chapter 6 ... 39
6. Implementation ... 39
6.1 GraphQL Components ... 39
6.1.1 GraphQL Server ... 39
6.1.2 Connector ... 44
6.1.3 Model ... 46
v
6.1.5 Query Resolvers ... 47
6.1.6 Data Resolvers ... 49
Chapter 7 ... 53
7. Conclusion and Future Work ... 53
References ... 54
vi
List of Figures
Figure 1: Bluemix’s Architecture ... 3
Figure 2: Account Usage Dashboard ... 10
Figure 3: MVC Pattern... 12
Figure 4: Front-End Technologies (Pelletier, 2015) ... 20
Figure 5 GraphQL-based UI Architecture ... 23
Figure 6 Sample Redux state management code ... 25
Figure 7: React Performance ... 26
Figure 8: Data Fetching with REST... 27
Figure 9: Data Fetching with GraphQL ... 28
Figure 10 GraphQL Subscription Server-Side Pub-Sub Configuration ... 29
Figure 11 Binding the Subscription Server with the GraphQL engine ... 29
Figure 12 Binding GraphQL queries with React components ... 30
Figure 13 Bluemix Architecture ... 31
Figure 14 Redux Workflow ... 32
Figure 15 Bluemix UI state change user actions ... 33
Figure 16 Redux and React Components... 34
Figure 17 Loading times of Current Usage Dashboard vs New Usage Dashboard ... 37
Figure 18 Comparison of the previous and the present loading times ... 37
vii
Figure 20 Message bus data source format ... 45
Figure 21 GraphQL connector with a REST endpoint ... 46
Figure 22 GraphQL Schema ... 47
Chapter 1
1.
Introduction
In this section, we introduce the two most common problems associated with enterprise
applications development and the research needed to tackle these problems.
With increase in the complexity of the systems being built and the demand in the quality
of service by the customers, developing and providing highly available and efficient
systems is one of the biggest challenges today for software enterprises. IBM’s BluemixTM
is an example of such a system, IBM’s cloud offering implemented on Cloud Foundry
(Bernstein, D., 2014) - an open source “Platform as a Service” (PaaS). IBM Canada is
centrally involved in the evolution and improvement of Bluemix, for example, with
respect to availability, efficiency, extensibility, and customizability of the software
services running on Bluemix. Currently, there are approximately 26 infrastructural
services running in the background.
1.1
Performance
Website characteristics/metrics indicate if a website is successful or not. These metrics
are measured based on different parameters such as the website access speed, availability,
security, and usability. Of these, performance metric plays a crucial role in attracting new
customers and retaining existing users. It strongly influences the number of transactions
being performed on the website. It is therefore necessary to identify and focus on the
factors that influence the performance of a website (Monideepa, Tarafdar et al., 2008).
Some of the common performance related issues arise due to poorly written code,
inefficient database design and SQL queries, poor load distribution, network strength, and
dependency of web application on Virtual Machines. (360Logica Web Performance,
2017)
The impact of web performance on business success has been demonstrated many times
Amazon: 100 ms delay caused a 1% drop in revenue.
Google: 400 ms delay caused a 0.59% decrease in search requests per user
Yahoo!: 400 ms delay caused a 5-9% decrease in traffic.
Bing: 2 seconds delay caused a 4.3% drop in revenue per user.
Mozilla made their download page 2.2 seconds faster and was rewarded with an
increase of 15.4% in downloads.
Google Maps reduced the file volume by 30% and observed a 30% increase in
map requests.
Netflix enabled gzip on the server; simply by this single action pages became
13-25% faster and saved 50% of traffic volume!
Shopzilla succeeded in reducing the loading time from 7 down to 2 seconds,
whereby the conversion rate increased by 7-12%, they observed a 25% increase in
page requests, they were able to retire 50% of their servers, thus saving energy
costs.
AOL observed the number of page views on several websites. While the fastest
users requested 7-8 pages, the slowest only viewed 3-4.
1.2
UI Development
Developing User Interfaces (UI) for enterprise applications is complicated because of the
large business data that the system should fetch, process, manipulate and render. With the
recent advancements in the web development technologies, business logic is being
coupled with the UI. The demand for a faster data manipulation has become a matter to
concern to increase the User Experience (UX). Thus, integrating and coupling the data
into the UI is always a focus in UI development.
Therefore, there is a need for a new technique for improving the performance of existing
applications in retrieving the data faster from the backend data sources.
1.3 Research Question
“How do we design and develop high performance web applications?”
Thus, this thesis focuses on improving the performance of the existing applications by
implementing a novel GraphQL-based UI architecture that enables efficient retrieval of
data from backend data sources and creation of high-performance real-time dashboards.
To evaluate the performance improvement made by this architecture, we implement the
architecture by integrating it into the existing Bluemix architecture and explore the key
performance improvements.
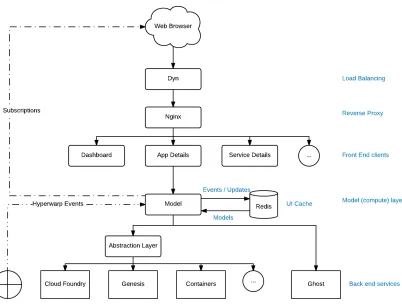
Figure 1: Bluemix’s Architecture
Figure 1 represents the existing GhoST (Bluemix’s message bus) architecture. Once a
request is triggered from the browser, it is handled by the load balancer – Dyn. Dyn
reroutes the request to different servers ensuring that all the servers are equally loaded
with the number of incoming requests. The request is then sent to the reverse proxy –
26 services running on top of CloudFoundry in the backend. Examples of these services
are: Genesis, Containers, and Billing. All these services push data onto a message bus
called as the GhoST. Thus, GhoST acts an abstraction layer on top of all the data sources.
Front end services like Dashboard, App Details, Service Details etc. consume data from
this message bus and return the data to the front end. Each front-end service might
consume data from one or more backend data sources that push data onto the message
bus.
1.4 Solution Approach
Our research emphasizes on improving the performance of the web applications by (i)
making the data retrieval faster from the backend data sources using multiple parallel
asynchronous queries for a single request from the client and (ii) storing and caching the
state of the User Interface (UI) elements. Initially, a wide range of modern front-end
technologies and communication protocols, listed in section 2.3, have been studied and
analyzed to integrate in the proposed architecture to boost the performance of web
applications. A prototype was then implemented based on the shortlisted technology
stack as a proof of concept for the architecture proposed. We finally implemented and
integrated the proposed architecture into the existing IBM Bluemix console to compare
the differences in performance before and after updating the architecture.
1.5 Key Research Results
There has been a significant boost in the performance of the Bluemix console after
replacing the existing workflow with the proposed architecture. Our recorded loading
times indicate that the usage information section loads, on an average, 245% faster and
the account switching is done 153% faster than the existing system. The updated system
has been tested with and without page caching, and hosting different number of
applications in Bluemix under different user accounts as mentioned in Figure 18. All the
tests show that this architecture contributed to a significant performance boost in the
1.6 Novelty
The novelty of this architecture lies in splitting a single HTTP request from the client into
multiple asynchronous calls and incremental loading of the UI elements thereby reducing
the number of calls between the client and server systems, securely caching the state of
the UI elements based on the user logged-in session thereby rendering the UI
instantaneously instead of hitting the backend data sources multiple times, and rendering
the skeleton UI elements even before the actual data is available.
1.7 Structure of the thesis
Chapter 1 of this document gives an outline of the thesis’s motivation, goals and
objectives, and our contributions. Chapter 2 presents a literature review and an analysis
of the existing technologies for data retrieval, consumption and presentation. Chapter 3
gives the details of the research methodology followed while conducting this research. A
detailed explanation of the proposed architecture is presented in Chapter 4. Validation of
the proposed architecture on the existing IBM Bluemix system and the results of the
research are described in Chapter 5. Implementation details of the architecture are
described in Chapter 6. Chapter 7 summarizes the thesis research work and specifies the
Chapter 2
2.
Background and Literature Review
In this section, we present the background about the existing Bluemix system and the
underlying architecture. We present an overview of the existing literature on boosting
enterprise applications performance and focus on a specific component of Bluemix ─
Usage Dashboard, as our research platform.
In the last 10 years, there has been a great deal of modification and introduction of new
technologies. Thereafter, web has been the area of intense focus and research of today
because of its unimaginable future. The impact of open-source and the versatility of the
web are accessible and outspread radically into every sector regardless of the hardware or
software platforms used by engineers, developers and designers.
2.1 Related Work
There has been a significant amount of research done on improving the performance of
web applications. The research is spread across multiple components such as efficiently
storing/caching the data in Relational/NOSQL databases (Ghosh, R et al., 2006),
improving the data transfer time (Myers et al., 2007, and improving the user experience
by updating only a part of the web page without reloading the entire page (Paulson,
2005).
MapJAX a data-centric framework accelerating the call back time of Ajax (set of web development technologies to make web applications more interactive and dynamic)
applications and data transfer times was proposed by Myers to replace asynchronous
Remote Procedure Calls. Vingraleka et al. (1999) developed a fast and reliable HTTP
service Web++ for improving the response times by dynamically replicating web resources over multiple servers.
There has been decent research on reducing file size as it contributes to boosting the
performance of web applications. Tools such as YUI Compressor, Page Speed and JSMin
(2008) proposed ten techniques for improving the display speed of the web pages. These
include optimizing and resizing images, JavaScript files and minimizing the number of
backend interactions.
Web caching is another area of focus for improving the performance. Ramaswamy et al.
(2007) demonstrated that embedding cache can significantly boost the performance of the
edge cache networks. In the proxy-based caching, the edge server (refers to client-side
proxies, server-side reverse proxies, or caches within a content distribution network
(CDN)) helps in increasing the scalability and reduces the client response latency. Luo et
al. (2008) presented a form-based proxy-caching framework for database-backed web
servers.
2.2 Background ─ IBM Bluemix
As a test platform, to validate the architecture and technology stack proposed in this
thesis, we implement the architecture over the existing IBM’s cloud platform – Bluemix.
The current system suffers from performance issues. For example, the loading time of the
user’s application dashboard increases significantly with increase in the number of
applications being hosted: e.g., 2.10 sec. for 10 applications to approximately 45 sec. for
64 applications. There are other such dashboards in the Bluemix console, e.g.: Resource
Usage Dashboard and User Profile Dashboard. There is thus pressure on the organization
to improve performance figures.
Besides this, there are monitoring concerns (e.g., False positive misleading the user to believe the system is working properly, delayed some systems need updates in real-time without a delay, and possibly missing alerts could result in missing important information related to systems health) while the applications are running on Bluemix,
shown on the system’s dashboard. This system is complicated as there are multiple
instances of each of the 26 services deployed globally e.g.: Sydney, London, Rome, and
Dallas (and numerous other dedicated installations not shown). Examples of
macro-services are: CloudFoundry – an opensource cloud platform; MCCP – a multi cloud
support system for managing and administering processes that support SaaS services.
(Abe, N et al., 2006)
Underlying the monitoring aspects are metrics that play a foundational role in defining
data to be captured (Basili, V.R. et al., 2007) (e.g., CPU utilization, Mean Response
Time, etc.) for analysis and alerting agents upon violation of conditions. Thus, on the
Bluemix dashboard, there is an application called “Grafana”, which is a gateway for
capturing specific metrics. Examples are: inbound and outbound call times and error
rates; return code (e.g., 200 for normal, 400 for an error, 500 for a serious error);
application crashed flag; up-time; CPU and memory utilisation; spikes in CPU or in
memory; etc. One can click on any one of the services and visualize the underlying
measures described above. Grafana thus helps in checking the health of the system.
Beyond this, there are logs where staff dive into (as charts may not point to all the
malfunctions) to manually check if something has gone wrong. This is a typical pattern
during monitoring by the Bluemix staff.
While many services are monitored, the staff are concerned that: “All of this is art than
science at the moment. When things go bad, the ‘peaks’ on the graphs shoot off and the
support teams manually validate whether this is real or not. As there are multiple
instances of each of these services, things get complicated. At the moment, we do not do
very much with this data, we do not do alerts properly, do not analyze data properly, …
and should be able to do much more on this monitoring space”*. There is thus a strong
desire to investigate Bluemix with a view to bringing order to the lack of rigor in
applications monitoring.
*This information is interpreted from discussion with the IBM Bluemix UI Console team,
IBM Canada Lab, Toronto, Canada.
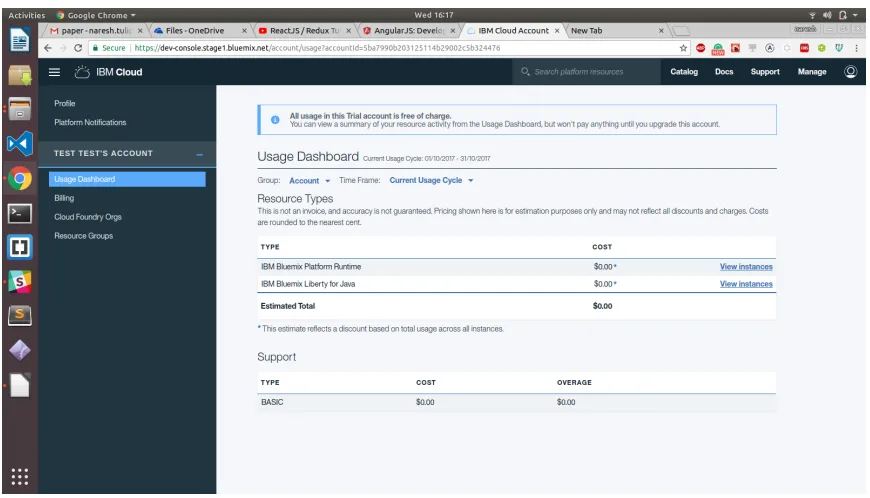
2.3 Account Usage Dashboard
Usage dashboard enables the account owner or a billing manager for an organization to
containers in their organizations. They can either select a particular region or all regions
to view the service consumption and runtime GigaByte-hours.
Navigating to the Account ─> account_name ─> Usage Dashboard will open the Usage
Dashboard page. Billing managers can see the details for only the organizations in which
they are billing managers.
At the end of each billing cycle, the account owner is charged based on the total usage of
all resources incurred across all the organizations in their account. An account owner can
filter the usage summary by region and organization. They can also click a month to see
the usage for that month. One can select All Organizations from the Organization list to
see the usage for all organizations in the account. Figure 2 represents the existing
Account Usage Dashboard UI.
Implementation: The current system is developed using DOJO ─ an open source modular JavaScript library. DOJO is used in developing cross-platform JavaScript applications
and websites quickly. The key features of DOJO help in providing APIs that will work
across all the browsers by abstracting their differences. However, the existing Usage
Dashboard has certain drawbacks as listed below:
The existing UI waits until all the data is received and loaded into the
components. If a user has multiple organizations, the UI will wait until all the data
associated with those organizations is fetched.
Page renders all at once after the data is received. Earlier DOJO versions had a
Figure 2: Account Usage Dashboard
Therefore, there is a need for a new technique for improving the performance of existing
applications.
2.4 Client
-
side Technologies and Communication Protocols
One of the most common problems across many systems and applications is efficiently
fetching the data from the backend data sources and rendering it on the User Interface.
Although there has been intense research and progress (Chaudhuri, S et al., 2007; Van,
Aken et al., 2017) on optimizing data storage and retrieval techniques for the past 15
years, very less emphasis was put on JavaScript frameworks. However, the emphasis is
slightly moving towards optimizing the data processing and presentation layer recently.
(Few, S et al., 2008).
2.5 Analysis of client
-
side technologies
2.5.1 React
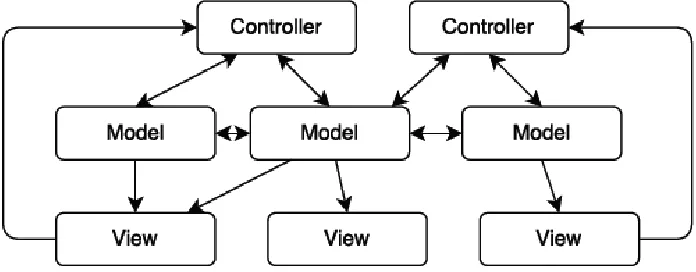
Model–view–controller (MVC) is a software architectural pattern for implementing user
Model (central component managing the data, logic and rules of the application), View
(representation of the information) and Controller (component accepting the inputs and
converting them to commands for the model or view). This is done to separate internal
representations of information from the ways information is presented to, and accepted
from, the user. The MVC design pattern decouples these major components allowing for
efficient code reuse and parallel development (Ping, Y et. al., 2009).
React (Gackenheimer, 2015) performs specific, well defined operations which represents
view component in MVC architecture for both web and mobile applications. It permits
developers to provide a detailed graphical representation of a view which is directly
proportional to the model representing state. When there is any data manipulation in the
model, React has a capability to update its relevant Presentational / UI elements.
A Document Object Model (DOM) is a cross-platform and language-independent
application programming interface that treats an HTML, XHTML, or XML document as
a tree structure wherein each node is an object representing a part of the document
(Document Object Model, Wikipedia). React does this very effectively. When there is
any change in the data /model, using JavaScript a virtual DOM is built. This newly
generated DOM replaces with the current actual DOM in the browser which makes React
to be robust. There are many alternatives to React, two of which are listed below.
2.5.2 Regular HTML and jQuery
A traditional approach of developing websites is by using JavaScript, jQuery, HTML and
CSS (Dalmasso, I et al., 2012). However, this approach is rarely in use because of its
limitations ─ the imperative nature of altering the DOM and the complexity to keep track
of the current state of the website. Furthermore, this approach does not offer the latest
DOM manipulation technique ─ componentization that helps in code reusability and
modularity.
This is another recent front-end library and a great competitor to React (Passalia, A
2017). It is a progressive, incrementally-adoptable JavaScript framework for building the
UI. It uses the traditional web development approach and enables the use of templates.
Vue’s compact size, intuitive API, component-based approach, and blazing fast core,
make Vue.js a great solution to craft our next front-end application. However, Vue is
relatively new in the market and the least matured of the other JavaScript frameworks and
is being developed by only one person with help from the community (Koetsier, J 2016).
We chose for React because of the large scale of our web application: the component
nature of React allows a very clear structure for large projects, is more easily testable and
promotes code reuse. It also is more popular than Vue and has a very healthy ecosystem.
Another reason for our choice is that our client (IBM) showed interest in expanding the
Bluemix to also include a mobile application in the future. React, through React-Native,
would easily allow much of the web-application code to be reused for an eventual
2.5.4 Redux
A problem that arises when using React is how to share data among different
components. Traditionally, this would give rise to a MVC pattern. However, in practice it
is found that the MVC pattern is not able to handle the high level of complexity
introduced by larger web applications. Figure 3 illustrates this pattern:
The problem is that in traditional web application MVC, each component has its own
associated model. Furthermore, many views might depend on a certain model and models
might have interdependencies. As indicated in Figure 3, as the web application scales
complexity soon becomes very high as the interdependencies between controllers,
models, and views become very hard to track. The Flux architecture (Gackenheimer, C
2015) is a solution to this proposed by Facebook in 2014, and it attempts to solve these
issues by putting more constraints on the flow of information through a web application.
Redux (Farhi, O 2017) is the most popular implementation of this architecture, and we
decided to use this in our web applications in order to manage the complexity of shared
data. An overview of the redux pattern can be seen in Figure 4.
The core feature of Flux architecture is unidirectional data flow. A view never directly
changes state, it has to dispatch an action which indirectly triggers the change of state
through the reducer. The reducer is a simple pure function which takes the current state
and an action and returns the new state. The Redux state acts as a single source of truth
for shared data. Use of Redux greatly improves the structure and predictability of data
flow in our web applications (Ubbink, et al., 2017).
2.5.5 Redis
The cache provider (Redis (Xu, M et al., 2014) by default) is used to reduce the workload
of the server when handling requests.
In particular, the memoisation is used to cache data that is commonly queried or is
particularly computationally heavy to retrieve. An example is the previous months
resource usage invoice of a Bluemix customer. Using the cache, we store the usage bill of
the customer for the previous months in the currently logged in session as it will never
change.
2.6 Analysis of Communication Protocols
There are several research papers on web services and the communication between
a performance review of Representational State Transfer Protocol and Simple Object
Access Protocol based web services by Tihomirovs, J et al., 2016, REST is shown to
have better performance.
Maeda, K, 2012 researches the performance of serialization and concludes that binary
serialization can be much more effective than text serialization formats such as XML or
JSON. Popic, S et al., 2012; Sumaray, A et al., 2016 presents results of binary and text
base serialization on mobile platforms and confirms that a binary serialization is faster on
mobile platforms as well.
The microservice architecture has recently become a popular evolution of the SOA
design pattern. The microservice architecture has been studied and reviewed in papers
from different angles. Villamizar, M et al., 2015 presents a case study where the
performance of different microservice architectures compared to monolithic applications
with the same functionality.
Messina presents a review of design pattern closely related to the microservice
architecture and gives a good overview of the design problems one must face when
opting for a microservice architecture (Messina, et al., 2016).
The communication technologies presented in this section are chosen because they are
widely used in the industry and they all have some degree of cross platform support.
2.6.1 SOAP
One of the cross-platform protocol for communication over Internet is Simple Object
Access Protocol (SOAP). To encapsulate messages and to define how to transmit and
receive them XML is used by SOAP. Though SOAP is not tied to any application layer
for data transmission HTTP has become the most commonly used (Grabis, J et al., 2016).
The SOAP architecture can be divided into three parts: Service providers, service registry
and service consumer. The SOAP service which maps data from storage into SOAP
messages will be created by service provider and it also provides a description of the
communicate with them will be exposed by service registry and then the service
consumer can access the registry to find out which services are available and
communicate with that service using SOAP messages (Belqasmi, F et al., 2012).
2.6.2 Remote Procedure Call
A procedure call from one process to another over a network is called remote procedure
call (RPC). There are frameworks built specifically to allow for cross platform RPCs
though most modern programming languages has the support for RPC built in. To
make cross platform calls possible data resources, procedures, their input parameters and
expected outputs in a language independent Interface Definition Language (IDL) will
be described by these frameworks. The server and client code which implements the
procedures in different programming languages, on different machines can then be
generated by procedures in the IDL. Remote calls are made by a client who calls the
locally implemented procedure, the message is then packed together with the parameters
and sent to the server which has implemented the same procedure. The procedure will be
executed by server and sends a response with the result (Bershad et al., 1990).
2.6.3 Apache Thrift
One of the framework for cross language application communication is Thrift. In addition
to above, Thrift also functions as a communication protocol for remote procedure calls
between web services. Thrift is not completely platform independent as it is a
framework. It has support for 14 different languages, including Java, C#, C++,
JavaScript, Python and PHP. The JSON and binary are serialization alternatives which
are present across all languages in the Thrift framework. Thrift has support for both
HTTP and raw TCP as transportation layers. (Apache Thrift Documentation, 2017)
2.6.4 gRPC
Just like Thrift, gRPC is also a framework for cross platform remote procedure
calls. Protocol Buffers are used both as a serialization format for messages and also as an
gRPC framework is available in 10 different languages, including Java, C#, C++,
JavaScript and Python. gRPC has support for the newly released HTTP 2 protocol, but
can also use TCP as its transportation layer. (Wang, X et al., 1993)
2.6.5 REST
Representational state transfer (REST) or RESTful web services is an architectural style
for communication between computer systems on the web. Unlike SOAP, REST web
services are not tied to any specific transportation protocol or serialization method.
(Christensen, J et al., 2009) The transportation of data is done over HTTP and the data is
serialized to either JSON, HTML or XML which has become the most widely used
alternatives.
An individual uniform resource identifier (URI) is used to access the data resources in
REST. These resources can be identified with a unique URL when REST is implemented
with HTTP as a means for transportation. HTTP verbs such as GET, POST, PUT and
DELETE are used to manage the Resources. All the operations pre-defined by the HTTP
methods — GET, PUT, POST & DELETE are available in the REST architecture for
using and managing the resources. A GET request that uniquely identifies a specific
resource is sent to the REST architecture to fetch data. A POST message is sent to the
REST architecture to add/update information on the data resource. As REST is
lightweight and can be adopted in any language, it has become one of the most
popular alternatives to communication between web services.
2.6.6 GraphQL
When Facebook built its mobile applications, they needed a data-fetching API powerful
enough to describe all of Facebook, yet simple enough to be easy to learn and use by their
product developers. They then developed GraphQL in 2012 to fulfill this need. Currently,
it powers hundreds of billions of API calls a day (Byron, L 2015).
GraphQL is a query language for APIs, and a server-side runtime for executing queries
Facebook in 2012 before being publicly released in 2015. It is a generic query language
which implies that it is not bound or tied to a particular storage engine or a specific
database. Instead, it is backed by our existing code.
Why GraphQL?
Back in 2012, Facebook began an effort to rebuild their native mobile applications. Their
android and iOS applications were thin wrappers around views of their mobile website.
However, as the Facebook’s mobile applications became more complex, they suffered
poor performance and frequently crashed. They evaluated all their options for delivering
News Feed data to their mobile applications, including RESTful server resources and
FQL tables (Facebook's SQL-like API) but there were large differences in the data they
needed to render in the mobile applications and the server queries that were required.
They needed a new way to think of data not in terms of resource URLs, secondary keys,
or join tables; but in terms of a graph of objects and the models that ultimately were used
in their applications like JSON. This inspired them to develop a new project that
ultimately became GraphQL.
Sample GraphQL Query
Key Features of GraphQL
No over fetching or under fetching of data: XML RPC, SOAP, REST and gRPC always either over fetch or under fetch the data needed by the client but GraphQL
only fetches the data specified by the client. It fetches only the data needed,
nothing more nothing less.
One endpoint: Unlike REST, where the client needs to consume resources from different endpoints, GraphQL has only one endpoint - /graphql. This eliminates
the need of remembering different endpoints to consume different data sources.
Example:
For a REST web service, there could be multiple endpoints as below for different
GET and POST operations:
o GET /books/:id GET /authors/:id
GET /books/:id/comments POST /books/:id/comments
But, in GraphQL, we only need one endpoint, “/graphql” for all types of requests
Multiple resources in one request: GraphQL supports merging queries for different data sources into one query thereby allowing the client to fetch data from
multiple resources in just one request thereby eliminating the number of HTTP
calls.
GraphiQL: GraphQL provides powerful developer tools like GraphiQL- an
in-browser integrated development environment for faster application development
and debugging.
Evolve APIs without versioning: Since GraphQL has only one endpoint, this eliminates the necessity of informing the clients about any changes in the API
versions as the endpoint will still remain the same.
In REST web service, whenever a new version evolves, the client has to update
his code to consume resources from the modified URI.
GET /books/v1/:id
GET /books/v2/:id
But in GraphQL, it will always be
/graphql
Self-Documenting: GraphQL automatically generates documentation for the APIs based on the comments provided during development. This establishes a
consistent documentation pattern across all projects.
2.7 Discussion
Developing web applications with the use of HTML (Hyper Text Markup Language),
CSS (Cascading Style Sheet) and core JavaScript (Scripting Language) in the
presentation layer is rarely in use and is considered traditional. The demand for dynamic
and more interactive web grew exponentially with the advancements in the web. As a
result, the data-access layer of web was a focus point in web application development.
Now, the design and development trend has been changing every year, and emphasis has
been given to performance, security, cost and efficiency to achieve a better user
experience. There has been a rise of different JavaScript frameworks and libraries to
maintain these aspects. However, a rapid change in the development platform has brought
a paradox in selecting the right technologies for developers.
On the other hand, there are technologies that support methods such as: (i) polling,
actively sampling the status of an external device by a client program as a synchronous
activity (Langendoen, K et al., 1997); (ii) interrupts, a signal to the processor emitted by
hardware or software indicating an event that needs immediate attention (Langendoen, K
et al., 1997); and (iii) subscriptions for real-time monitoring (Cherukuri, R 2010). But
none of the existing technologies, except GraphQL (Apollo Developers Blog, 2016), has
features which enable accurate and efficient streaming of data useful for visualizing
real-time characteristics of a system. Examples features of GraphQL are: Live (notify the
Blog, 2016); and deferred querying (specifying that some part of the query can arrive
later) (Apollo Developers Blog, 2016).
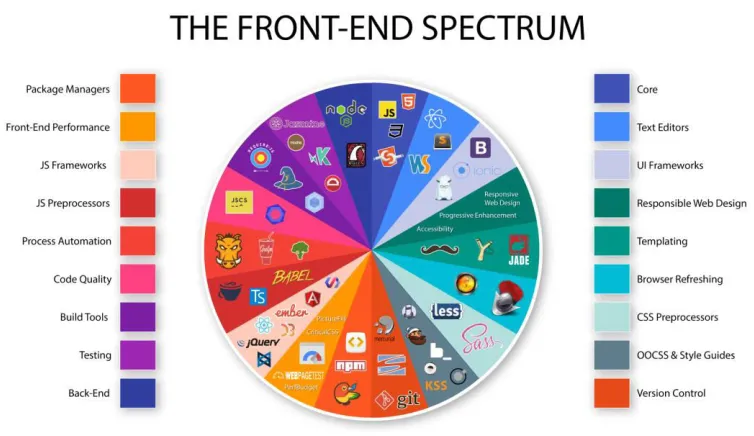
Figure 4: Front-End Technologies (Pelletier, 2015)
Figure 4 represents a subset of the list of front-end technologies, Package managers,
JavaScript frameworks, Build Tools, Testing tools, Version control tools, UI frameworks,
and a variety of other tools currently available and used in the web application
development. This figure is to illustrate the rise in the number of frameworks and
Chapter 3
3.
Research Methodology
We conducted this research in three increasingly sophisticated stages:
In the preliminary stage, we performed a literature review of the existing works on
rendering real-time dashboards, various front-end technologies, communication protocols
and web services available in the market. We then shortlisted a few technologies, based
on the literature results, to develop initial prototypes. We first developed a
Proof-Of-Concept (POC) to check the integration of these technologies into the existing products.
For the POC, we initially implemented an abstract REST endpoint on the Bluemix
development server’s message bus to capture the data being generated. We then designed
a GraphQL Schema based on the data format being generated by the REST endpoint as a
response to the webservice consumption calls. We then implemented a GraphiQL layer to
test the correctness of the results being fetched by the GraphiQL queries. The result of
this phase gave us an insight into the technology stack and algorithms to be used for the
actual system implementation.
In the intermediate stage, we evolved the preliminary prototype into a transitional
prototype. We updated the preliminary POC’s GraphQL layer to consume the real-time
data being pushed on to the message bus. We then implemented a React layer in the
front-end and GraphQL subscriptions using the in-built Publish-Subscribe system. We
rendered the raw data on the UI, being received by the GraphQL layer, using the created
react components. We automated the process of triggering GraphQL mutations to publish
events on the subscription channels to validate the working on WebSockets and the data
being pushed onto the UI. We then integrated Redux into the front-end layer to store the
states of the react components and a Redis cache to store the frequently queries
parameters.
In the advanced stage, we integrated the Bluemix IAM Token authentication and created
thee the performance based on the mirrored data and conditions from the production
environment. We updated the dashboard rendering technique with the caching capability
based on the logs from production. We explicitly induced multiple applications to the
dashboard given by the Bluemix staff as opposed to our toy examples. This helped us
validate the performance of our rendering. We also explored for new metrics that might
help capture the additional parameters for faster rendering of the UI. We are continuously
monitoring and validating the architecture based on the inputs from the stakeholders. In
future, for the metrics work, we intend to create and use an instrument and the GQM
(Basili, V.R. et al., 1994) method to gather data from the stakeholders and customers,
identifying Goals, related Questions, and Metrics. We shall then implement and integrate
the metrics with the existing metrics capturing gateway —“Grafana”.
This, three-stage incremental paradigm has built-in risk management because the later
Chapter 4
4.
Proposed Architecture
In this section, we present a model to boost an application’s performance and the
motivation of selecting a specific set of technologies to implement it.
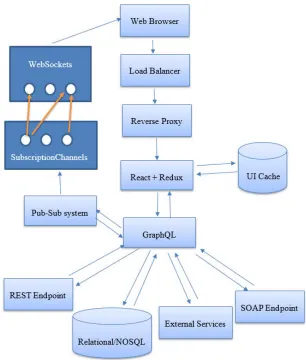
Figure 5 GraphQL-based UI Architecture
Figure 5 represents our proposed GraphQL-based UI Architecture. This architecture
starts with creating a GraphQL-layer on top of all the existing backend data sources of a
endpoint, SOAP endpoint, message bus or a combination of any or all of these data
sources. We then integrate a store management technology in the front end to store the
states of the application elements, a DOM rendering mechanism for rendering the UI
components, a UI caching technology to cache the web pages, and a socket-based
subscription channel between the client and server systems. We therefore implement this
architecture using the technologies listed in section 4.1 because of their efficiency
compared to other technologies in the section 2. Integrating GraphQL into the
architecture brings in all the advantages listed in section – key features of GraphQL.
Also, we will now be able to split a single request triggered by the client into multiple
requests after hitting the GraphQL layer as proposed in the architecture. We design and
store the states of all the components that are to be rendered on the UI using Redux and
bind its values with the smart React components. As opposed to the existing method of
rendering all the data at once, we incrementally load the data onto the UI without having
to wait for the other queries to complete their execution. We bind components of the UI
to specific queries and render them as soon as a response is received. This allows us to
asynchronously load the data onto the UI. Also, having the initial component skeleton
stored in the redux helps us in rendering the dummy components i.e. the UI elements
without the actual data to be rendered as soon as the request i received. This improves the
user experience by displaying the web page almost instantaneously.
4.1 Technologies
React + Redux: Based on our analysis of different technologies listed in Section 2.2 and
2.3, React + Redux and GraphQL proved to be the most efficient technology stack for
implementing the new architecture. React is not just the UI, it is a framework. Redux can
be integrated into React thereby enabling the state management. (SourceToad, 2015)
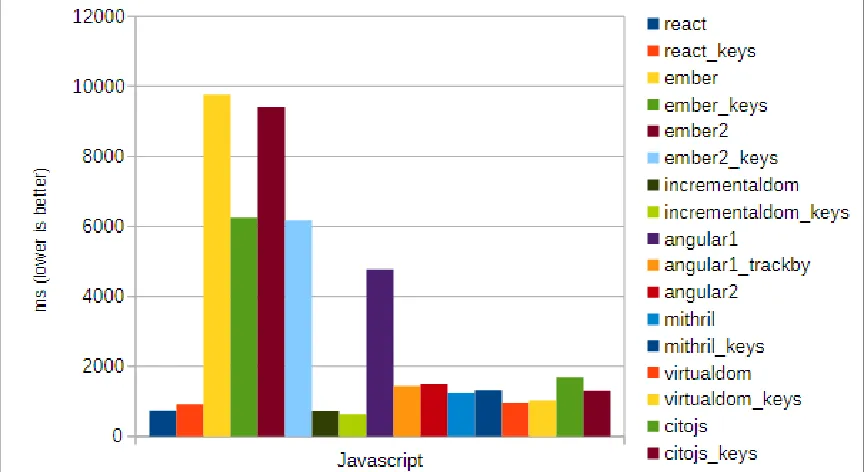
Since React creates its own virtual DOM, it gives enormous flexibility and amazing gain
in the performance. Figure 7 represents the performance of React compared to the other
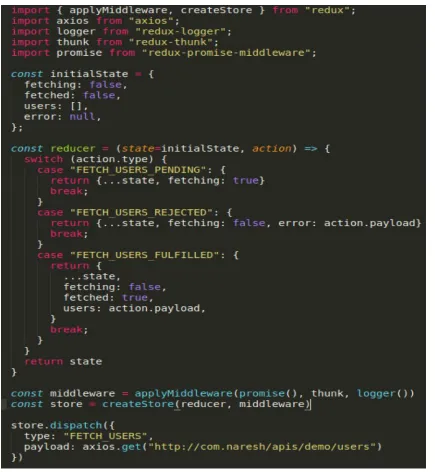
Figure 6 Sample Redux state management code
Figure 6 represents a sample code for the functioning of the Redux store management.
The initial state of the components is stored in an object– initialState with default values.
The reducer function listens to the actions triggered by the smart components on the UI
and performs the associated actions and updates the state of the values in the store.
Figure 7: React Performance
Figure 7 illustrates the significant performance provided by the use of React technology
compared to the other front-end technologies.
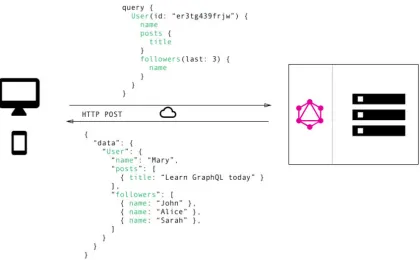
GraphQL: GraphQL, on the other hand, can help in efficiently fetching the data. Figure
7 and Figure 8 represent a scenario on how data fetching is dealt using REST APIs and
GraphQL. With REST APIs, we typically gather the data using multiple calls to different
endpoints. In Figure 7, the first call fetches the initial user data, the second call fetches
the posts for a user and third call retrieves a list of followers per user. However, there is
no explicit control to the user on restricting the parameters to be fetched. On the other
hand, in Figure 8, GraphQL allows the user to send a single query to the GraphQL server
specifying the exact parameters to be fetched. The server then responds with a single
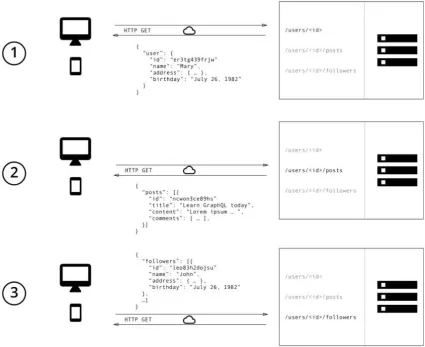
Figure 8: Data Fetching with REST
Figure 8 represents the number of calls made using REST web service to fetch the user
related data that include user information, user posts and their followers. It had to make
three calls to three different endpoints to get the complete user related information.
However, Figure 9 illustrates the advantage of implementing GraphQL which retrieves
the same information as REST but in just one HTTP call by merging all the parameters
Figure 9: Data Fetching with GraphQL
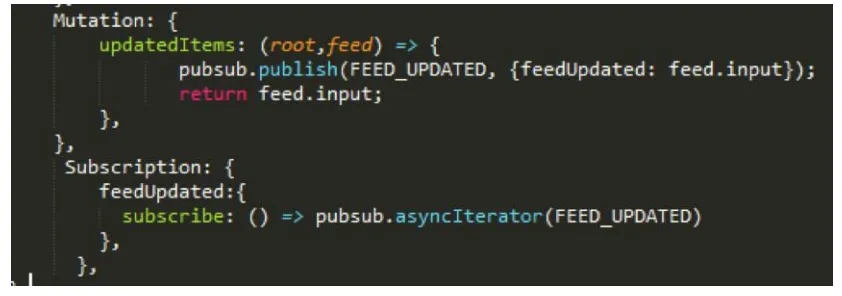
Publish-Subscribe: GraphQL subscriptions are based on a simple publish-subscribe
system. In the GraphQL server-side subscriptions package, when a client makes a
subscription, we simply use a map from one subscription name to one or more channel
names to subscribe to the right channels. The query (subscription query) will be executed
every time some data/event is published to one of these channels. We think a common
pattern will be to publish mutation/update results to a channel, so a subscription can send
a new result to clients whenever a mutation happens.
GraphQL Subscriptions: Publish-Subscribe based subscriptions help in getting real
time updates from a backend data source and send it to the clients when a specific event
occurs. They are usually implemented using Web Sockets ─ a steady connection held by
the server to the clients. (Apollo GraphQL, 2016) Each client opens a steady connection
those events get triggered, the server pushes the data through the connection established
earlier with the clients.
Figure 10 GraphQL Subscription Server-Side Pub-Sub Configuration
Figure 10 represents the server side pub-sub engine configuration that will be bound onto
a web socket.
Figure 11 Binding the Subscription Server with the GraphQL engine
Figure 11 represents the mutation- insert/update operation triggering a publish message
Figure 12 Binding GraphQL queries with React components
Figure 12 represents the code binding the GraphQL subscriptions query with the react
components in the front-end i.e. client page.
4.2 New Usage Dashboard
Based on the technologies shortlisted, we designed the following GraphQL-based UI
Figure 13 Bluemix Architecture
Figure 13 represents the updated Bluemix console system after integrating our proposed
architecture. We created a layer – “Bluemix.Graph” model on top of the message bus
thereby having only one endpoint to any of the services below. We also bound a Redis
cache with the model to store the frequently accessed but no changed pages in the same
session for rendering the UI components instantly.
This architecture has the following key features:
The application is now React, Redux and GraphQL-based
o Since we are invoking multiple asynchronous calls and binding each of the
results to separate components on the UI, the data gets rendered at a
component level rather than waiting for one large data set from the
backend data source. Also, since the state skeleton is already stored in
Redux, skeleton components are rendered immediately after the request
trigger.
There are no blocking requests
o We overcome the problem of blocking requests in the existing applications
by splitting a single HTTP request into multiple sub queries internally
without having a dependency between each of those queries.
As soon as a request is sent from the client to the server, the data from the cache (Redis)
is loaded initially while the live data is being fetched from the GraphQL Server. Each
component on the UI has a corresponding state stored in the Redux. When the live data
from the GraphQL server is received, the redux store and the redis cache are updated with
the live data. Any changes in the component state of the redux store will immediately
reflect the changes in the UI.
State Change: Figure 14 is a React + Redux ecosystem, the workflow usually is:
1. The UI is defined by the state tree and the associated action callbacks are defined
through “props” attribute.
2. Action Creator normalizes all the user actions such as clicks, reload etc
3. The actions (resultant redux actions) are then sent to a reducer. The actual application logic is implemented by the reducer.
4. The state tree is then updated by the reducer and dispatched to a store where it is stored.
5. The UI is then updated based on the new store tree in the store.
Based on this ecosystem workflow, we designed and integrated the front end react +
redux components architecture to the existing Bluemix Architecture. Figure 15 represents
the various actions that a user can trigger on the applications being hosted ─ Open URL,
Stop App, Restart App, Rename App, and Delete App.
Whenever a user clicks on one of these actions, an action event is triggered and
dispatched to the action creators (both synchronous and asynchronous). The reducer then
updates the state tree with the new states in the store. The changes in the state are
reflected on the UI by applying on the delta. Figure 15 represents the list of actions that
can be triggered on a running service. All these actions will trigger a state change in the
redux store management.
Figure 16 Redux and React Components
Figure 16 represents the Redux and React configuration in the Bluemix. The react
components are categorized as Smart and Dumb components. Smart components are
those components that trigger actions for change in state and re-render themselves as
soon as an action is triggered. However, dumb components only render the data that is
passed to them as input source. They do not trigger any actions or interact with the state
Chapter 5
5.
Validation and Results
In this section, we present the process of validating the proposed architecture and the
results of this research.
It is mandatory, for any research in the domain of Software Engineering, to select a form
of validation that is appropriate for the type of research and the method used to obtain the
result. Analysis for a formal model/empirical model, evaluation for a descriptive model,
experience for a qualitative model and Persuasion for a technique are some examples of
the different types of the software engineering research validation.
A typical software engineering research result falls into one of the following types ─
Procedure/Technique, Qualitative or Descriptive model, Empirical model, Analytic
model, Tool, Specific solution or a Report (Mary, Shaw., 2003).
5.1 Research Results
As a result of our research, we were successful in creating a GraphQL-based UI
architecture and implementing it on a real-time system to validate the model. We could
achieve a significant performance boost by:
Decreasing the number of HTTP requests by introducing a GraphQL middle tier layer.
Instead of invoking multiple HTTP calls to the different backend data sources, we
only make a single HTTP call and split the call into multiple GraphQL calls
internally thereby allowing asynchronous streaming of data from multiple
backend data sources which cannot be done using the traditional HTTP protocol.
Rendering the skeleton components on the UI even before the data is available. We store the states of the components in a Redux store and render the skeleton
soon as a request is triggered. This helps in providing an optimistic UI to the user
i.e. showing a response as soon as a request is received.
Loading the components asynchronously before all the requests are complete. We build the entire UI using components and bind each of them with a different
query to the backend systems. This allows us in executing multiple queries in
parallel and decoupling the dependency between the components. Components
render the data as soon as they receive from the query without having to wait for
the result from other queries which are slower.
Integrating Redis cache to make the subsequent page loads fast.
We perform a MD5 of the session token and the URI requested and store the
components states in a Redis cache. This allows us to render the data
instantaneously from the cache instead of hitting the backend systems again and
again even though the data does not change during the session.
Implementing GraphQL data management to make view switching faster.
5.2 Validation
The proposed GraphQL-based UI architecture in Figure 5 is generic and can be integrated
into any of the existing web applications. To validate our proposed architecture, we
implemented and integrated the GraphQL-based UI architecture into the existing Usage
Dashboard system of the Bluemix cloud. We analyzed and recorded the performance
improvements in the usage information section loading time and account switching time
in the Usage dashboard. We also analyzed the performance of loading the cached web
pages whose values do not change in the same session.
Our recorded loading times indicate that the usage information section loads 245% faster
Figure 17 Loading times of Current Usage Dashboard vs New Usage Dashboard
Figure 17 represents the comparison of the load times between the existing usage
dashboard and the new usage dashboard after implementing the GraphQL-based UI
architecture. Real data in the existing system renders after 43.61 seconds while the new
GraphQL-based dashboard renders the same data within 17.79 seconds which is 245%
faster.
Figure 18 represents the tests performed on the Usage Dashboard using different user
accounts, with and without caching pages in a session, and switching accounts. These
results clearly indicate that there is a significant increase in the performance of the
Chapter 6
6.
Implementation
In this section, we present the details of implementing the architecture and configuring
the GraphQL server.
The core component of improving the performance is introducing a GraphQL layer in
between the front-end and the back-end systems.
6.1 GraphQL Components
A GraphQL server is made up of 5 distinct components. Of these, few are common to any
data accessing applications while the others are specific and unique to GraphQL. We will
start with the common components and later dwell into the GraphQL-specific concepts
and its implementation.
6.1.1 GraphQL Server
GraphQL Server is a flexible, community driven, production-ready HTTP GraphQL
server plugin for Node.js. It works with any GraphQL schema built with GraphQL.js,
Facebook’s reference JavaScript execution library, and you can use GraphQL Server with
all popular JavaScript HTTP servers, including Express, Connect, Hapi, Koa, Restify,
and Lambda.
GraphQL server supports all the common semantics for sending GraphQL requests over
HTTP. This enables us to query the GraphQL server from popular clients like Relay and
Apollo. It also supports certain extensions to this protocol that enable the client to send
multiple GraphQL operations in a single request.
Installation
We use npm package manager to install the required packages that best match our server
Examples:
To install Express: npm install graphql graphql-server-express
To install Restify for REST APIs: npm install graphql graphql-server-restify
To install KOA server: npm install graphql graphql-server-koa
To install Hapi server: npm install graphql graphql-server-hapi
Adding a GraphQL Endpoint
We configure a GraphQLOptions object and register it with the GraphQL server.
GraphQLOptions object has the properties listed below:
graphiql: If set to true, an interactive graphical in-browser IDE for GraphQL is loaded.
schema: This is a mandatory property. It is an instance of the GraphQLSchema present in the GraphQL.js and maps the data definitions with our query
parameters.
context: Information that is useful during a query execution. Checking the current logged in user is a canonical example of this property. Request object is passed as
the context the graphql() function present in the GraphQL.js/src/execute.js if no
explicit context value is set.
rootValue: This property is used in resolving root fields defined in our schema. It represents the top of our metaphorical graph of data. This value is passed to the
graphql() present in the GraphQL.js/src/execute.js.
pretty: If set to true, the JSON response will be pretty-printed.
formatError: This property helps in formatting any errors that might arise while fulfilling a GraphQL operation. The default spec-compliant formatError function
extensions: An optional function for adding additional metadata to the GraphQL response as a key-value object
Sample code to configure GraphQL server
graphQLServer.use ('/graphql', _bodyParser2.default.json(), graphqlHTTP({
schema: executableSchema,
graphiql: true,
context: {},
extensions ({ document, variables, operationName, result }) {
return { runTime: Date.now() - startTime };
}
}));
Sample code to connect with Express
import bodyParser from 'body-parser';
import { graphqlExpress } from 'graphql-server-express';
import express from 'express';
var app = express();
app.use('/graphql', bodyParser.json(), graphqlExpress({ schema: myGraphQLSchema }));
app.listen(8080);
Sending Requests
GraphQL Server accepts both the GET and POST requests.
For POST Requests: All POST requests are sent like a JSON body to the GraphQL
server. Each request either contains a query or an operationName or both (in case of a
named query) and may contain variables.
Sample POST request:
{
"query": "query aTest($arg1: String!) { test(who: $arg1) }",
"operationName": "aTest",
"variables": { "arg1": "me" }
A batch of queries can be requested by simply sending a JSON-encoded array of queries.
Sample code for batch of queries in one request:
[
{ "query": "{ testString }" },
{ "query": "query q2{ test(who: \"you\" ) }" }
]
For GET Requests: A GET request must pass query and optionally variables and
operationName in the URL.
Sample GET Request
GET
/graphql?query=query%20aTest(%24arg1%3A%20String!)%20%7B%20test(who%3A%20%24ar g1)%20%7D&operationName=aTest&variables=me
GraphiQL
GraphiQL is a graphical interacive in-browser IDE for GraphQL.
Installing GraphiQL
npm install --save graphiql
GraphiQL with Express (Web framework for Node.js):
import { graphiqlExpress } from 'graphql-server-express';
app.use('/graphiql', graphiqlExpress({
endpointURL: '/graphql',
}));
GraphiQL with Connect (Web framework for Node.js):
import { graphiqlConnect } from 'graphql-server-express';
app.use('/graphiql', graphiqlConnect({
endpointURL: '/graphql',
}));
GraphiQL with Hapi (Web framework for Node.js):
server.register({
register: graphiqlHapi,
options: {
path: '/graphiql',
graphiqlOptions: {
endpointURL: '/graphql',
},
},
});
GraphiQL with KOA (Web framework for Node.js):
import { graphiqlKoa } from 'graphql-server-koa';
router.get('/graphiql', graphiqlKoa({ endpointURL: '/graphql' }));
Figure 19 GraphiQL Interface — An in-browser IDE for GraphQL
Below listed are the components required for configuring and exposing data through a
GraphQL µ-service.
1. Connector
3. Schema
4. Query Resolver
5. Data Resolvers
6.1.2 Connector
This component is responsible for the configuration and creation of methods responsible
for connecting with the data sources. The data sources can be anything i.e. relational
databases, NOSQL databases, REST APIs, SOAP APIs or a blend of all these data
sources.
Sample Code:
We implement a GraphQLConnector class that adds the core functionality for all
GraphQL connectors.
Class Properties
o apiBaseUri
o cacheExpiry
o cacheExpiry
o headers
Class Methods
o addBluemixToken(req)
o addIMSToken(imsUserId, imsToken)
o get(endpoint)
o post(endpoint [, body [, options]])
o put(endpoint [, body [, options]])
Internal Dependencies
o Request: an instance of request-promise used to make all HTTP requests.
o Redis: It is an instance of @console/console-platform-key-value-store.
o Loader: It is an instance of DataLoader. This is the library we use for
fetching data and avoiding sending a bunch of duplicate requests to a data
source during a single request to GraphQL.