Scholarship@Western
Scholarship@Western
Electronic Thesis and Dissertation Repository
1-24-2016 12:00 AM
Surface Modification of Electrode Materials for Lithium-Ion
Surface Modification of Electrode Materials for Lithium-Ion
Batteries
Batteries
Biwei Xiao
The University of Western Ontario
Supervisor
Prof. Xueliang (Andy) Sun
The University of Western Ontario
Graduate Program in Mechanical and Materials Engineering
A thesis submitted in partial fulfillment of the requirements for the degree in Doctor of Philosophy
© Biwei Xiao 2016
Follow this and additional works at: https://ir.lib.uwo.ca/etd Part of the Other Materials Science and Engineering Commons
Recommended Citation Recommended Citation
Xiao, Biwei, "Surface Modification of Electrode Materials for Lithium-Ion Batteries" (2016). Electronic Thesis and Dissertation Repository. 4366.
https://ir.lib.uwo.ca/etd/4366
This Dissertation/Thesis is brought to you for free and open access by Scholarship@Western. It has been accepted for inclusion in Electronic Thesis and Dissertation Repository by an authorized administrator of
The development of lithium-ion batteries (LIBs) has been hampered by the intrinsic limitations
of the electrode materials. High-performance LIBs demand electrode materials with fast
lithium/electron diffusion rate, stable surface chemistry and high specific capacity. Surface
modification by atomic layer deposition (ALD) is an essential method to optimize the
performance of the electrode materials. The research in this thesis aims at achieving
high-performance LIBs via surface modification and understanding the mechanisms via synchrotron
radiation.
Firstly, by applying ALD FePO4 on LiNi0.5Mn1.5O4 (LNMO), we successfully alleviated the
electrolyte decomposition under high voltage by using the electrochemically active FePO4 as
a buffer layer. By coating the high energy Li1.2Mn0.54Co0.13Ni0.13O2 (HENMC) with AlPO4, we
demonstrated higher thermal resistance compared with the most widely used Al2O3 as the
coating material.
The irreversible phase change in cathode materials is an intrinsic property that is difficult to be
addressed by simple coating, therefore, we extended the practice of ALD to accurately control
the surface composition by post annealing TiO2 coated LNMO. We demonstrated the
effectiveness of creating a surface layer of spinel TiMn2O4-like structure and Ti-doped LNMO
sub-surface, which protect the material surface from the electrolyte attack and prevent the
intrinsic phase change simultaneously.
To understand how the structure evolves, we used synchrotron radiation to study the behavior
of HENMC in the initial cycle and 450th cycle in an in-situ manner. The in-situ X-ray
absorption (XAS) has been demonstrated to be an outstanding method to track the change of
transition metals while the cell is under operation. We found that the Ni and Co have lost their
electrochemical activity after long-term cycling due to the phase segregation.
We also studied the surface behaviors of graphene nanoribbons (GNRs) synthesized from
chemically unzipped carbon nanotubes and the correlation with the electrochemical
performance used as anode materials. We found that defects, surface area and surface
ii
understandings to achieve high-performance LIBs.
Keywords
Lithium nickel manganese oxide, Lithium nickel manganese cobalt oxide, Iron phosphate,
Aluminum phosphate, Titanium dioxide, Atomic layer deposition, Graphene nanoribbons,
iii
Co-Authorship Statement
1.
Title: Unravelling the Role of Electrochemically Active FePO4 Coating by Atomic Layer
Deposition for Increased High-voltage Stability of LiNi0.5Mn1.5O4 Cathode Material
Authors: B. Xiao, J. Liu, Q. Sun, B. Wang, M. Banis, D. Zhao, Z. Wang, R. Li, X. Cui, T.-K.
Sham and X. Sun
The final version of this manuscript has been published in Advanced Science, 2015, 1500022
Biwei Xiao: carried out all of the experiments; finished the draft with following modifications
Jian Liu: carried out the ALD process and helped revise the manuscript
Qian Sun: helped organize the experiment and discuss the results
Biqiong Wang: helped run synchrotron XPS at the PGM beamline of CLS
Dong Zhao: helped run the XAS at the SGM beamline of CLS
Zhiqiang Wang: helped discuss the synchrotron results
Ruying Li: helped organize experiments
Xiaoyu Cui: helped discuss the XPS results
T.-K Sham: helped organize the synchrotron results
Xueliang Sun: supervisor, helped organize the whole story and funding supports.
2.
Title: Highly Stable Li1.2Mn0.54Co0.13Ni0.13O2 Enabled by Novel Atomic Layer Deposited
AlPO4 Coating
Authors: B. Xiao, B. Wang, J. Liu, K. Kaliyappan, Q. Sun, M. Banis, G. Dadheech, M. Balogh,
iv
Biwei Xiao: carried out all of the experiments; finished the draft with following modifications
Biqiong Wang: carried out following ALD process and helped revise the manuscript
Jian Liu: carried out the ALD process and helped revise the manuscript
Karthikeyan Kaliyappan: helped material synthesis and revise the manuscript
Qian Sun: helped organize the experiment and discuss the results
Mohammad N. Banis: helped XRD results collection and revise the manuscript
Gayatri Dadheech: helped organize the experiment and revise the manuscript
Michael Balogh: helped HRTEM training
Mei Cai: helped organize the experiment and revised the manuscript
Ruying Li: helped organize experiments
T.-K Sham: helped organize the synchrotron results
Xueliang Sun: supervisor, helped organize the whole story and funding supports.
3.
Title: Atomic-scale Manipulation of Spinel Lithium Nickel Manganese Surface by
Tetrahedrally-coordinated Ti as High Performance Cathode Material
Authors: B. Xiao, H. Liu, J. Liu, Q. Sun, B. Wang, K. Kaliyappan, Y. Liu, C. Langford, R. Li,
T.-K Sham, G. Botton, M. Cai and X. Sun
The final version of this manuscript has been submitted for publishing
Biwei Xiao: carried out all of the experiments; finished the draft with following modifications
Hanshuo Liu: carried out HAADF-STEM measurements and related discussions, contributed
v
Qian Sun: helped organize the experiment and discuss the results
Biqiong Wang: helped with ALD process
Karthikeyan Kaliyappan: helped collect samples and discussions
Yulong Liu: helped carry out the XRD measurements
Ruying Li: helped organize experiments
Tsun-Kong Sham: helped organize the synchrotron results
Gianluigi Botton: helped organize the HAADF-STEM results
Mei Cai: helped organize the manuscript
Xueliang Sun: supervisor, helped organize the whole story and funding supports
4.
Title: Insight into the Structure Evolution of Li-rich NMC via In-situ X-ray Absorption
Spectroscopy
Authors: B. Xiao, M. Banis, Q. Sun, Y. Liu, M. Cai, T.-K Sham, R. Li and X. Sun
The final version of this manuscript is under preparation
Biwei Xiao: carried out all of the experiments; finished the draft with following modifications
Mohammad N. Banis: helped carry out in-situ XAS measurement and following data analysis
Qian Sun: helped data analysis
Yulong Liu: carried out the XRD measurements
Mei Cai: helped organize the experiments
vi
Xueliang Sun: supervisor, helped organize the whole story and funding supports
5.
Title: Graphene Nanoribbons Derived from the Unzipping of Carbon Nanotubes: Controlled
Synthesis and Superior Lithium Storage Performance
Authors: Biwei Xiao, Xifei Li, Xia Li, Biqiong Wang, Craig Langford, Ruying Li and Xueliang
Sun
The final version of this manuscript has been published in Journal of Physical Chemistry C,
2014, 118. 881-890
Biwei Xiao: carried out all of the experiments; finished the draft with following modifications
Xifei Li: helped organize the experiments and revised the manuscript
Xia Li: helped FTIR and BET measurement
Biqiong Wang: helped RAMAN data collection
Craig Langford: helped revise the manuscript
Ruying Li: helped organize the experiments
Xueliang Sun: supervisor, helped organize the whole story and funding supports
6.
Title: Surface Behaviors and Modifications of Cathode Materials for Lithium-ion Batteries
Authors: Biwei Xiao and Xueliang Sun
The final version of this manuscript is to be submitted for publishing
Biwei Xiao: wrote the whole review
vii
I hear and I forget. I see and I remember. I do and I understand.
- Xunzi
不闻不若闻之,闻之不若见之,见之不若知之,知之不若行之,学至于行之而止
矣。
viii
Acknowledgements
This Ph.D work was accomplished in Dr. Sun’s Nanomaterials and Energy Lab at the
University of Western Ontario in London, Canada. I would like to thank everyone that has
helped me throughout the past five years.
I would like to express my sincere gratitude to my supervisor Prof. Xueliang (Andy) Sun, a
professor at the Department of Mechanical & Materials Engineering of University of Western
Ontario, Canada Research Chair, Fellow of the Canadian Academy of Engineering and the
Royal Society of Canada. Dr Sun’s dedication to the lab, his diligence, brilliance, patience and
kindness have greatly inspired me. I’m really grateful to Dr. Sun for allowing to work in
General Motors as an intern for two summers. Without Dr. Sun’s continuous support and
encouragement, I would not have been able to accomplish my Ph.D work.
I would also like to thank Mrs. Ruying (Kathy) Li, she is the wife of Dr. Sun and a research
engineer in our lab. I cannot forget her maternal care to me and her patient help to my life and
my research, she was always the one I seek comfort when I feel depressed and frustrated. The
incentive talks have been a strong support for me in the past five years.
I am also grateful to Dr. Mei Cai, a technical fellow and a lab manager of the General Motors
(GM). She provided me with the opportunities to carry out internships in GM during the
summers of 2015 and 2016. The experience in GM helped me gain knowledge of the
connections between academic to industry, it will benefit my career without any doubt. I also
appreciate my GM supervisor Mrs. Gayatri Dadheech and other GM colleagues, Dr. Mahmoud
Abdelhamid, Dr. Qiangfeng Xiao, Dr. Xingcheng Xiao, Dr. Li Yang and Mr. Michael Balogh
et al. for their help in training and discussing.
Sincerely thanks to Prof. Tsun-Kong Sham, Dr. Yun-Mui Yiu and Dr. Zhiqiang Wang in the
Department of Chemistry for their help in my synchrotron radiation-related work. I would also
like to acknowledge the beamline scientists of Canadian Light Sources (CLS), Dr. Ning Chen,
Dr. Yongfeng Hu, Dr. Qunfeng Xiao, Dr. Xiaoyu Cui et al. for their kind help throughout those
sleepless days and nights in CLS. Thanks to Prof. Gianluigi Botton and Miss Hanshuo Liu
ix
the Department of Mechanical and Materials Engineering for their valuable advices towards
my Ph.D work. I would also like to thank the examiners of my thesis defense, Dr. Yang Song,
a professor in the Department of Chemistry at UWO, Dr. Robert Klassen, a professor in the
Department of Mechanical and Materials Engineering at UWO and Dr. Jun Lu, a scientist from
the Argonne National Lab of US, for their careful examination on my thesis and helpful
discussions and suggestions.
I am also indebted to my colleagues at University of Western Ontario throughout the past five
years. I would like to thank Dr. Qian Sun, Dr. Xifei Li, Dr. Jian Liu, Dr. Mohammad N. Banis
and Ms. Biqiong Wang for their training, fruitful discussions and patience in helping me run
ALD samples. I would also like to extend my appreciations to other colleagues, Dr. Hao Liu,
Dr. Jiajun Wang, Dr. Shuhui Sun, Dr. Gaixia Zhang, Dr. Dongsheng Geng, Dr. Jinli Yang, Dr.
Dongniu Wang, Dr. Yongliang Li, Dr. Yongji Tang, Dr. Yu Zhong, Dr. Liang Li, Dr. Dawei
Wang, Mr. Hamid N. Banis, Dr. Kun Chang, Mr. Craig Langford, Mr. Adam Riese, Mr.
Stephen Lawes, Dr. Niancai Cheng, Dr. Karthikeyan Kaliyappan, Dr. Yuhai Hu, Dr. Xia Li,
Dr. Hossein Yadegari, Mr. Wei Xiao, Mr. Yulong Liu, Dr. Qizheng Li, Mr. Andrew
Lushington, Ms. Zhongxin Song, Mr. Yang Zhao, Mr. Jianneng Liang, Dr. Weihan Li, Mr.
Jiwei Wang, Mrs. Fei Sun, Mr. Heng Xiang, Ms. Xiaoting Lin, Mr. Changhong Wang, Mr. Ali
Abdulla, Mrs. Minsi Li and other visiting scholars and students to our group. It was a
tremendous honor to work with such a dynamic and professional group of people, you have
made my life and research enjoyable and pleasant.
Thanks to the funding support from the Natural Science and Engineering Research Council of
Canada (NSERC), the Canada Research Chair Program (CRC), the Canada Foundation for
Innovation (CFI), Canadian Light Source (CLS) at the University of Saskatchewan, University
of Western Ontario (UWO) and GM. Without them the work would not have been possible to
be finished.
Last but not least, I would like to extend my most sincere gratitude to my parents Mr. Bo Xiao,
Mrs. Mingqiong Wu and my younger twin brother Mr. Feng Xiao. Five years away from home
x
encouragements. I love you all!
Biwei Xiao
CMLP 1325, University of Western Ontario
xi
Table of Content
Abstract ... i
Co-Authorship Statement... iii
Acknowledgements ... viii
Table of Content ... xi
List of Tables ... xvi
List of Figures ... xvii
List of Appendices ... xxiv
List of Abbreviations ... xxv
Chapter 1 ... 1
1 Background Review ... 1
1.1 General Introduction ... 1
1.2 Surface Behaviors of Cathode Materials ... 4
1.2.1 Surface Phase Reconstruction ... 4
1.2.2 Stress-induced Cracking ... 12
1.2.3 Electrolyte Decomposition and Transition Metal Dissolution... 14
1.2.4 Electrical/Li-Ion Conductivity ... 16
1.3 Roles of Surface Modifications ... 18
1.3.1 Surface Modification as Phase Transition Blocker ... 18
1.3.2 Surface Modification as A Mechanical Buffer Layer ... 22
1.3.3 Surface Modification as HF Scavenger ... 23
1.3.4 Surface Modification as Metal-oxygen Bond Stabilizer ... 25
1.3.5 Surface Modification as Electronic/Li+ Conductivity Accelerators ... 26
1.4 Methods of Cathode Materials Surface Modifications ... 32
xii
1.5.1 Theoretical Prediction ... 34
1.5.2 Graphene Nanoribbons as Anode Material for Lithium-ion Batteries... 35
1.6 Thesis Objectives ... 36
1.7 Thesis Organizations ... 37
References ... 38
Chapter 2 ... 65
2 Experimental Methods and Characterization Techniques... 65
2.1 Experimental methods ... 65
2.1.1 Synthesis of LiNi0.5Mn1.5O4 Nanoparticles via Hydrothermal Route ... 65
2.1.2 Atomic Layer Deposition of Amorphous FePO4 onto LiNi0.5Mn1.5O4 Nanoparticles ... 66
2.1.3 Atomic Layer Deposition of TiO2 onto LiNi0.5Mn1.5O4 Followed by Heat-treatment ... 67
2.1.4 Synthesis of Li1.2Mn0.54Co0.13Ni0.13O2 Nano-particles via A Modified Pechini Method ... 68
2.1.5 Atomic Layer Deposition of AlPO4 onto Li1.2Mn0.54Co0.13Ni0.13O2 Nano-particles ... 69
2.1.6 Synthesis of Graphene Nanoribbons via the Chemical Unzipping of Carbon Nanotubes ... 70
2.2 Characterization Techniques ... 70
2.2.1 Physical Characterization Methods... 70
2.2.2 Electrochemical Measurements ... 76
Chapter 3 ... 79
3 Unravelling the Role of Electrochemically Active FePO4 Coating by Atomic Layer Deposition for Increased High-voltage Stability of LiNi0.5Mn1.5O4 Cathode Material 79 3.1 Introduction ... 80
3.2 Experimental ... 81
xiii
3.2.3 Characterization Methods ... 82
3.2.4 Electrochemical Measurements ... 83
3.3 Results and Discussion ... 83
3.3.1 Morphology and Structural Characterization... 83
3.3.2 Electrochemical Characterization ... 87
3.3.3 XANES Studies ... 90
3.4 Conclusion ... 94
Acknowledgement... 94
References ... 95
Supporting Information ... 101
Chapter 4 ... 107
4 Atomic-scale Manipulation of Spinel Lithium Nickel Manganese Oxide Surface by Tetrahedrally-coordinated Ti as High Performance Cathode Material ... 107
4.1 Introduction ... 108
4.2 Experimental ... 110
4.2.1 Materials Preparation ... 110
4.2.2 Characterization Methods ... 110
4.2.3 Electrochemical Measurements ... 111
4.3 Results and Discussions ... 112
4.3.1 Structure Investigation ... 112
4.3.2 Electrochemical Performance Study ... 120
4.4 Conclusions ... 128
Acknowledgement... 129
References ... 130
xiv
5 Highly Stable Li1.2Mn0.54Co0.13Ni0.13O2 Enabled by Novel Atomic Layer Deposited
AlPO4 Coating ... 148
5.1 Introduction ... 149
5.2 Experimental ... 150
5.2.1 Materials Synthesis ... 150
5.2.2 Characterization Methods ... 151
5.2.3 Electrochemical Measurements ... 152
5.3 Results and Discussions ... 152
5.4 Conclusions ... 167
Acknowledgement... 167
References ... 168
Supporting Information ... 174
Chapter 6 ... 178
6 Insight into the Structure Evolution of Li-rich NMC via In-situ X-ray Absorption Spectroscopy ... 178
6.1 Introduction ... 179
6.2 Experimental ... 180
6.2.1 Materials Synthesis ... 180
6.2.2 Characterization Methods ... 180
6.2.3 Electrochemical Measurement ... 181
6.3 Results and Discussions ... 182
6.3.1 In-situ XAS Measurement of the Initial Cycle ... 185
6.3.2 In-situ XAS Measurement of the 450th Cycle ... 188
6.4 Conclusions ... 192
Acknowledgement... 192
xv
Chapter 7 ... 200
7 Graphene Nanoribbons Derived from the Unzipping of Carbon Nanotubes: Controlled Synthesis and Superior Lithium Storage Performance ... 200
7.1 Introduction ... 201
7.2 Experimental ... 202
7.2.1 Materials Synthesis ... 202
7.2.2 Characterization Methods ... 203
7.2.3 Electrochemical Measurements ... 203
7.3 Results and Discussions ... 204
7.4 Conclusion ... 216
Acknowledgement... 217
References ... 217
Supporting Information ... 224
Chapter 8 ... 225
8 Conclusions and Future Perspective ... 225
8.1 Conclusions ... 226
8.2 Perspectives... 229
xvi
List of Tables
Table 1.1 Lithium ions diffusion in various categories of typical cathode materials ... 17
Table 3.1 Potentials of the oxidation/reduction peaks of the first CV scan, the capacity
retentions and Rs after 100 charge/discharge cycles ... 88
xvii
List of Figures
Figure 1.1 Schematic illustration of the working principle of a Lithium ion battery ... 2
Figure 1.2 (a) The cost components of a representative graphite/NMC333 battery in 2013; (b)
voltage vs capacity chart of main cathode materials (LNMO: LiNi0.5Mn1.5O4, LMO:
LiMn2O4, LFO: LiFePO4, NMC: LiNi1/3Co1/3Mn1/3O2 up to 4.3 V, NCA:
LiNi0.8Co0.15Al0.05O2) (c) crystal structure of LiFePO4 (d) crystal structure of LiMn2O4 and
(e) crystal structure of LiCoO2 ... 3
Figure 1.3 (a) Compositional phase diagram of LiMnO2-LiNiO2-LiCoO2; (b) reconstructed
surface layer after 1st cycle within 2.0-4.7 V; (c) Degradation mechanism of Ni-rich
LiNi0.5Co0.2Mn0.3O2... 7
Figure 1.4 (a) Proposed phase changes in a lithium rich NMC under different cutting-off
voltages; (b) Typical charge/discharge curves of lithium rich NMC showing voltage decay;
(c) HAADF Z-contrast image and XEDS maps showing non-uniform distribution of elements
in a cycled lithium-rich NMC particle. (d) Low magnification STEM-HAADF images and
corresponding [010] zone axis SAED patterns of the lithium rich cathodes after different
cycles... 10
Figure 1.5 SEM images of LiNi0.8Co0.15Al0.05O2 particle cracking after (a) 1; (b) 2; (c) 3; (d)
4 electrochemical cycles; (e) Schematic illustration of the segregation consequences of cracks
towards the lithium ions diffusion ... 13
Figure 1.6 Schematic illustration of the Mn-Li exchange model mechanism for the deposition
of Mn on graphite in a graphite/LiMn2O4 cell ... 16
Figure 1.7 Lithium diffusion paths and activation energies calculated via density function
theory (DFT) of (a) layered, (b) spinel and (c) olivine structures ... 17
Figure 1.8 (a) High-resolution HAADF image indicating an Al-rich surface on the LiMn2O4
xviii
1.2 0.2 0.6 2 2 3 1.2 0.2 0.6 2
their corresponding lattice images ... 22
Figure 1.10 (a) XAS results of different LNMO samples and standard manganese oxides; (b)
Cyclic stability tests of LNMO with various FePO4 coating thicknesses ... 24
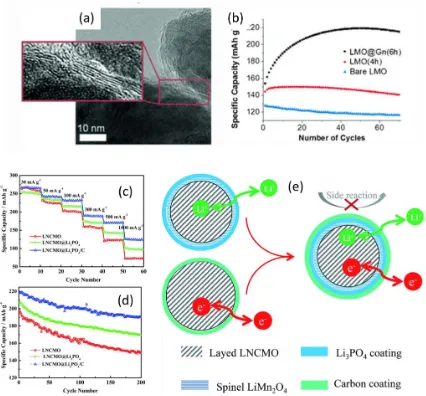
Figure 1.11 (a) Porous Graphite coating of LiMn2O4; (b) Discharge capacity of porous
graphite coated LiMn2O4 with a voltage range of 2.4-4.3 V (c) Rate capability test and (d)
Stability test of the LNCMO, Li3PO4 coated LNCMO and Li3PO4/C coated LNCMO; (e)
Mechanism of the hybrid coating ... 28
Figure 1.12 XPS spectra of (a) Al 2p and (b) P 2p of AlPO4 coated LiCoO2; (c) schematic
illustration of the AlPO4 surface modification mechanism ... 30
Figure 1.13 Calculated average voltages for oxides and fluorides versus voltages estimated
from experimental formation enthalpies ... 31
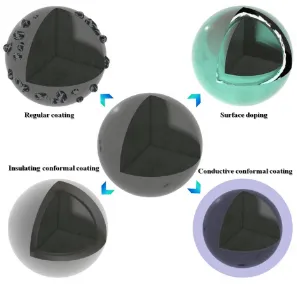
Figure 1.14 Possible ways of surface modification ... 32
Figure 1.15 Schematic illustration of (a) ALD process of Al2O3 synthesis and (b) MLD
process of alucone synthesis ... 34
Figure 1.16 Flow chart of the thesis organization... 38
Figure 2.1 (a) Oven used for hydrothermal synthesis; (b) Teflon-lined autoclaves for
hydrothermal synthesis ... 66
Figure 2.2 Savannah 100 ALD system (Cambridge Nanotech, USA) ... 67
Figure 2.3 Process of the modified Pechini’s method synthesis of Li1.2Mn0.54Co0.13Ni0.13O2 69
Figure 2.4 Field emission scanning electron microscope (Hitachi S-4800) ... 71
Figure 2.5 (a) JEOL 2010F high-resolution TEM and (b) FEI Titan Cubed 80-300 kV
microscope equipped with a Gatan Image Filter Quantum-965 spectrometer ... 72
xix
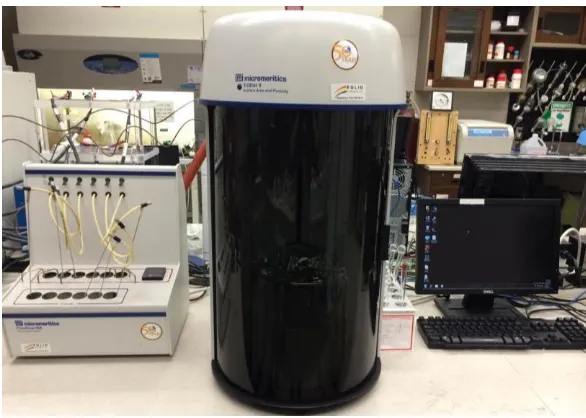
Figure 2.8 A Micromeritics Brunauer-Emmett-Teller surface area analyzer ... 74
Figure 2.9 A Thermo Instruments SDT Q600 Thermogravimetric/Differential Scanning Calorimetry analyzer ... 75
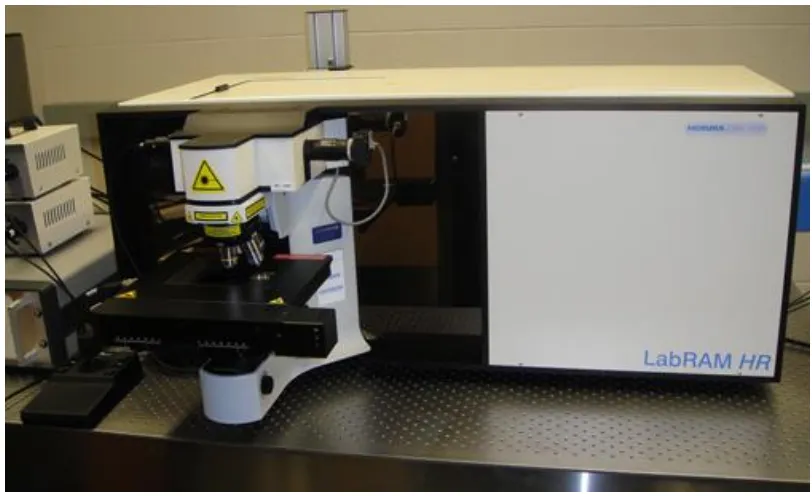
Figure 2.10 HORIBA Scientific LabRAM HR Raman spectrometer system ... 75
Figure 2.11 (a) Beamlines at the Canadian Light Source; (b) a photo of the Canadian Light Source ... 76
Figure 2.12 Photo of the glovebox used for cell assembly ... 77
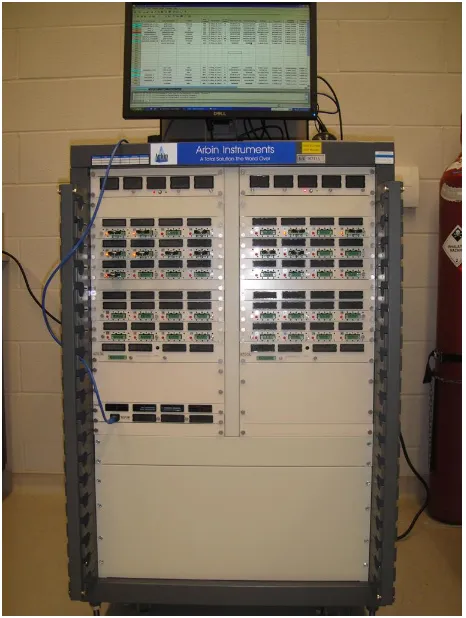
Figure 2.13 Arbin BT2000 battery testing station ... 77
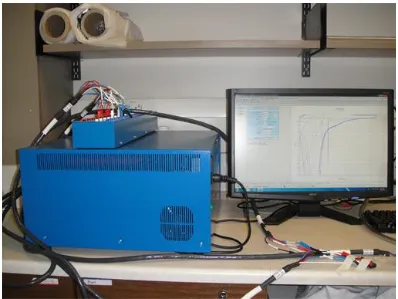
Figure 2.14 A multichannel potentiostat 3/Z (VMP3) ... 78
Figure 3.1 (a) Raman spectra and (b) P 2p XPS spectra of LNMO-n ... 84
Figure 3.2 FESEM images of (a) LNMO-0 and (b) LNMO-20; (c) HRTEM images of LNMO-20 (inset: Electron diffraction patterns of the LNMO-20 along the [110] zone axis) 86 Figure 3.3 (a) First charge/discharge curves; (b) Cycling stability under 0.5C; (c) Rate capabilities; (d) Cyclic voltammetry of the LNMO-n samples ... 89
Figure 3.4 (a) Electrochemical impedance spectra (EIS) of the LNMO-n samples (Solid lines: Fitted spectra); (b) A possible equivalent circuit. ... 90
Figure 3.5 (a) XANES Mn L3,2-edges of LNMO-20, LNMO-20 cycled, LNMO-0, LNMO-0 cycled, and standard MnO, Mn2O3, MnO2; (b) Fe L3-edges of standard FePO4, LNMO-20 and LNMO-20 after 100 battery cycles collected in TEY mode ... 92
xx
2 2
LNMO/250TiO2A ... 112
Figure 4.2 EELS map taken from a LNMO/250TiO2 particle. (a) HAADF-STEM image of
the LNMO/250TiO2 particle. (b) EELS map for the LNMO/250TiO2 particle (Ti: green; Mn:
red). (c, d) EELS spectra integrated from the corresponding areas shown in (b). ... 113
Figure 4.3 XRD patterns of (a) bare LNMO, LNMO/250TiO2 and LNMO/250TiO2A... 114
Figure 4.4 (a) HAADF-STEM image of LNMO/250TiO2A particle acquired near the surface,
the corresponding region is shown in the inset image. (b, c) Atomic-resolution
HAADF-STEM images showing the lattice structure of the outermost layer and the inner region of the
particle, respectively. (d, e) Processed images corresponding to the HAADF-STEM images
shown in (b, c) with a band-pass filter applied. (f, g) Simulated HAADF images of LiMn2O4
and TiMn2O4. ... 115
Figure 4.5 (a) XANES spectra of Ti K edges of LNMO/250TiO2 and LNMO/250TiO2A
collected at FLY mode (inset: enlarged pre-edge regions; schematics showing tetrahedral and
octahedral Ti); (b) EELS spectra of the Mn M-edge and Li K-edge on the surface and bulk;
(c) EELS depth profile of the LNMO/250TiO2A particle from the surface to the bulk. ... 116
Figure 4.6 (a) Stability test at 0.5C under room temperature; (b) Stability test at 0.5C under
55oC; (c) 1st and 350th charge/discharge curves under RT; (d) Rate capability test at 0.1, 0.5,
1, 2, 5 and 0.1C under RT; (e) CV curves of the first cycle normalized by active materials
weight; (f) Plots of the polarization potentials of the Mn3+/Mn4+, Ni2+/Ni3+ and Ni3+/Ni4+
redox couples calculated based on the CV curves; All of the spectra are based on sample:
Bare LNMO, LNMO/5TiO2A, LNMO/25TiO2A and LNMO/50TiO2A; ... 120
Figure 4.7 (a) EIS of bare LNMO and LNMO/25TiO2A after initial charge to 5V; inset: an
equivalent-circuit simulation model; (b) Structure of LNMO showing the lithium ions
diffusion path ... 123
Figure 4.8 XANES spectra of the bare LNMO, LNMO/25TiO2A, bare LNMO after 350
charge/discharge cycles and LNMO/25TiO2A after 350 charge/discharge cycles in (a) Mn
xxi
the bare LNMO and LNMO/25TiO2A after 350 charge/discharge cycles. ... 125
Figure 5.1 (a) SEM image and (b) XRD pattern of the pristine Li1.2Mn0.54Co0.13Ni0.13O2
particles prepared using the modified Pechini’s method ... 153
Figure 5.2 (a-f) EDS mapping of Co, Mn, Ni, Al, P and Al-P overlapping of HENMC-20AP
(g) STEM image of the EDS mapping region (inset: XAS spectra of P L3,2 edges of
HENMC-AP (Black) and standard AlPO4 (Red)) and (h) HRTEM image of the HENMC-20AP
showing the coating layer ... 154
Figure 5.3 Soft XAS data of (a) HENMC Co L3,2 edges and (b) HENMC-20AP Co L3,2 edges
fitted to standard CoO and LiCoO2 (c) Mn L3,2 edges (the HENMC-20AP sample is fitted to
the HENMC sample and standard MnO) (d) Ni L3,2 edges (L3 edges are marked with yellow
color and L2 edges are marked with purple color) (e) O K edge (all of the XAS results in this
figure are collected at total electron yield (TEY) mode) and (f) HRTEM image showing the
different phases in the HENMC-20AP sample (inset: Fast Fourier Transform patterns) ... 156
Figure 5.4 Cyclic voltammetry of (a) pristine HENMC (b) HENMC-5AP (c) HENMC-10AP
(d) HENMC-20AP ... 158
Figure 5.5 (a) Cyclic stability performance; (b) Coulombic efficiencies; (c) First cycle
charge/discharge curves; (d) 40th cycle charge/discharge curves of the samples ... 161
Figure 5.6 EIS profiles of the samples (a) after initial charge and (b) after 6th charge (inset: A
simulated equivalent circuit) ... 162
Figure 5.7 XPS results of F 1s of (a) Pristine HENMC electrode (b) HENMC-20AP electrode
(c) Cycled pristine HENMC electrode (d) Cycled HENMC-20AP electrode and XPS results
of C 1s of (e) Pristine HENMC electrode (f) HENMC-20AP electrode (g) Cycled pristine
HENMC electrode (h) Cycled HENMC-20AP electrode ... 163
Figure 5.8 DSC curves of pristine HENMC, HENMC-Al2O3 and HENMC-AP ... 166
Figure 5.9 Schematic illustration of the mechanisms of performance improvement by AP
xxii
50th, 100th, 200th, and 449th cycle; (c) dQ/dV curves of the initial cycle and (d) dQ/dV curves
of the 449th cycle ... 182
Figure 6.2 Schematic illustration of the in-situ cell ... 183
Figure 6.3 Charge/discharge voltage versus time of the in-situ first cycle under 1/10 C and
450th cycle under 1/20 C ... 184
Figure 6.4 In-situ XANES measurement of initial cycle Mn K-edges during (a) charging and
(b) discharging; Co K-edges during (c) charging and (d) discharging and Ni K-edges during
(e) charging and (f) discharging; ... 185
Figure 6.5 In-situ XANES measurement of the 450th cycle Mn K-edges during (a) charging
and (b) discharging; Co K-edges during (c) charging and (d) discharging and Ni K-edges
during (e) charging and (f) discharging; ... 190
Figure 7.1 FE-SEM images of the pristine CNTs and GNRs series: Pristine CNTs;
(b)GNRs-5min; (c)GNRs-30min; (d)GNRs-1h; (e)GNRs-2.5h; (f)GNRs-5h; (g)GNRs-10h;
(h)GNRs-20h... 205
Figure 7.2 TEM images of CNTs during different unzipping stages: (a) Etched CNTs; (b)
Partially unzipped CNTs; (c) Fully unzipped CNTs; (d) Stacked GNRs ... 207
Figure 7.3 Schematic diagrams of (a)Pristine CNTs; (b) Etched CNTs; (c) Partially unzipped
CNTs; (d) Fully unzipped CNTs; (e) Stacked GNRs fragments ... 207
Figure 7.4 (a) Raman spectra of the pristine CNTs and GNRs; (b) Plot of the ID/IG ratio and
surface area; (c) TGA curves of pristine CNTs and GONRs; (d)FTIR of GNRs-oxide-5h and
GNRs-5h ... 210
Figure 7.5 Charge/discharge profiles of (a) Pristine CNTs; (b) GNRs-5min; (c) GNRs-5h;
(d) GNRs-20h; (e) GONRs-5h with a current density of 100 mA/g; (f) Discharge capacity
and coulombic efficiency versus cycle numbers of pristine CNTs and GNRs/GONRs at a
xxiii
(d) GNRs-20h; (e) GONRs-5h with a current density of 100 mA/g; (f) Discharge capacity
and coulombic efficiency versus cycle numbers of pristine CNTs and GNRs/GONRs at a
current density of 100 mA/g ... 215
Figure 7.7 Schematic diagrams of insertion of lithium ions into (a) CNTs (b) GNRs (c)
xxiv
List of Appendices
Appendix I: PERMISSION FROM JOHN WILEY AND SONS ... 231
xxv
List of Abbreviations
2D: two-dimensional
3D: three-dimensional
A
AB: Acetylene black
AC: Alternating current
ALD: Atomic layer deposition
B
BET: Brunauer–Emmett–Teller
C
CCEM: Canadian Centre for Electron Microscopy
CE: Coulombic efficiency
CFI: Canada Foundation for Innovation
CLS: Canadian Light Sources
CNTs: Carbon nanotubes
CRC: Canada Research Chair
CV: Cyclic voltammetry
D
DEC: Diethyl carbonate
xxvi
DMC: Dimethyl carbonate
DSC: Differential scanning calorimetry
E
EDS: Energy dispersive spectroscopy
EELS: Electron energy loss spectroscopy
EIS: Electrochemical impedance spectroscopy
EMC: Ethylmethy carbonate
EXAFS: Extended X-ray absorption fine structure
F
FTIR: Fourier-transformed infrared spectroscopy
FLY: Fluorescence yield
FYI: Fluorescence yield
G
GM: General Motors
GNRs: Graphene nanoribbons
H
HAADF: High-angle annular dark-field imaging
HENMC: High energy lithium nickel manganese cobalt oxide
xxvii
I
ICE: Initial coulombic efficiency
L
LFP: Lithium iron phosphate
LIB: Lithium ion battery
LMO: Lithium manganese oxide
LNMO: Lithium nickel manganese oxide
LMRNMC: Lithium manganese rich nickel manganese cobalt oxide
LUMO: Lowest unoccupied molecular orbital
M
MCMB: MesoCarbon MicroBeads
MLD: Molecular layer deposition
MWCNTs: Multi-walled carbon nanotubes
N
NCA: Lithium nickel cobalt aluminum oxide
NMC: Lithium nickel manganese cobalt oxide
NMP: N-Methyl-2-pyrrolidone
NSERC: National science & engineering research center
xxviii
PC: Propylene carbonate
PE: Polyethylene
PEDOT: Poly(3,4-ethylenedioxythiophene)
PP: Polypropylene
PPy: Polypyrrole
PT: Polythiophene
PVDF: Polyvinylidene fluoride
S
SAED: Selected area electron diffraction
SEI: Solid electrolyte interphase
SEM: Scanning electron microscopy
SGM: Spherical grating monochromator
STEM: Scanning transmission electron microscopy
SXRD: Synchrotron X-ray diffraction
SXRMB: Soft X-ray microcharacterization beamline
T
TEY: Total electron yield
TEM: Transmission electron microscopy
xxix
TMA: Trimethy aluminum
TMPO: Trimethyl phosphate
TOF-SIMS: Time-of-flight secondary ion mass spectrometry
U
UWO: University of Western Ontario
V
VLSPGM: Variable line spacing plane grating monochromator
X
XANES: X ray absorption near edge spectroscopy
XAS: X ray absorption spectroscopy
XPS: X ray photoelectron spectroscopy
Chapter 1
1
Background Review
1.1
General Introduction
The abusive consumption of fossil fuels releases greenhouse gases like carbon dioxide and
methane to the atmosphere and traps heat, causing global warming. With regard to these
impacts, the development of sustainable energy is exceptionally imperative. Renewable
energies will not have the anticipated impact unless we find an efficient way to store and
use the electricity produced by them. Therefore, high-performance energy-storage devices
with high energy and power density are highly demanded for electricity-consuming
products. Electrochemical batteries have been considered as the most qualified candidate,
taking into account the safety, power density, cost, longevity and efficiency, rechargeable
lithium-ion batteries (LIBs) are hitherto the most successful technique. The extensive
application of LIBs not only resides in the vast portable electronics market, but also
expedites the revolution of electrical vehicles. Although LIBs-driven hybrid vehicles are
already commercially available in some companies, much more efforts are yet required to
devote in order to achieve the energy density, safety and cost as the United States Advanced
Battery Consortium Goals for Advanced Batteries for EVs – CY 2020 Commercialization
has stated.[1-5]
LIBs have attracted massive attention after being commercialized by SONY in 1991 due
to their high energy density, good performance and long cycling life compared to
conventional Ni-H, Ni-Cd, and Pb-acid batteries,[6] the drastically growing demand for
LIBs during the last two decades have stimulated enormous investigations on the
development of high performance electrode materials. A practical LIB usually comprises
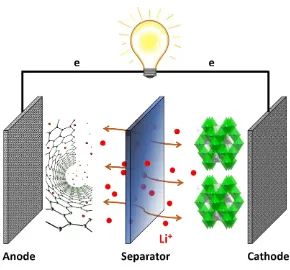
three functional components, the cathode, anode and electrolyte. Figure 1.1 shows a
schematic illustration of the working principle of a Lithium-ion battery, where lithium ions
de-intercalate from the cathode materials and migrate through the separator to the anode
materials during discharge, electron flows along the external circuit and power up devices,
system, where LiCoO2 was the cathode material and the lithium metal was the anode
material. The charge/discharge cycle was achieved on the basis of lithium intercalation and
de-intercalation from the LiCoO2 layered structure. The metallic lithium was later replaced
by carbonaceous materials in secondary LIBs due to safety issues. In addition to the
carbonaceous materials, a myriad of other materials were reported to be eligible as anode
materials, such as Sn, Si, Li4Ti5O12, metal oxides etc.[7] In sharp contrast to the diversity
of anode materials, the cathode materials are much less developed, even though the
intercalation chemistry has been comprehensively studied over centuries, the categories of
cathode materials are rather scarce.[8]
Figure 1.1 Schematic illustration of the working principle of a Lithium ion battery
Primary groups of cathode materials include the layered LiCoO2, spinel LiMn2O4,
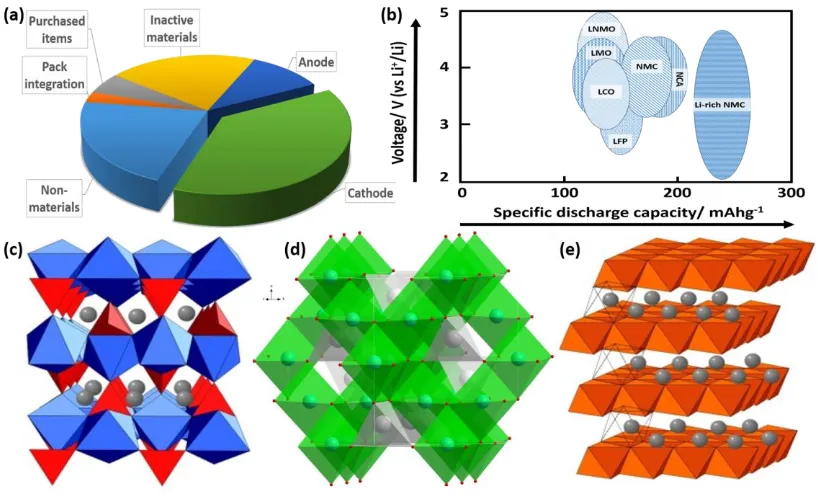
poly-anion LiFePO4 and their derivatives. Fig. 1.2a shows the cost components of a
representative graphite/NMC333 (LiNi1/3Mn1/3Co1/3O2 – a derivative of LiCoO2) cell in
2013 according to the United States Department of Energy,[9] within the six major parts
of a battery, the cathode costs 38%, the most critical reasons are the difficulty of materials
current LIBs market. Hence, the relatively slow development of cathode materials is the
major barrier for future low-cost LIBs. Six main types of cathode materials are illustrated
in Figure 1.2b based on the specific discharge capacity vs voltage. Energy density of a
specific type of cathode material is calculated on voltage multiplying capacity, therefore,
in order to achieve high energy density, researchers are looking for cathode materials that
offer either high voltage or high discharge capacity. The chart shows two cathode materials
that are of great potential. The spinel LNMO with a working capacity of around 120 mAhg
-1 and a voltage of 5 V and the Li-rich NMC with a working capacity of around 250 mAhg
-1 and a voltage of 4 V. Figure 1.2c-e show the crystal structures of typical cathode
materials: olivine LiFePO4, spinel LiMn2O4 and layered LiCoO2.
Figure 1.2 (a) The cost components of a representative graphite/NMC333 battery in
2013; (b) voltage vs capacity chart of main cathode materials (LNMO: LiNi0.5Mn1.5O4,
LMO: LiMn2O4, LFO: LiFePO4, NMC: LiNi1/3Co1/3Mn1/3O2 up to 4.3 V, NCA:
LiNi0.8Co0.15Al0.05O2) (c) crystal structure of LiFePO4 (d) crystal structure of LiMn2O4
and (e) crystal structure of LiCoO2
In order to maximize the efficiency of a cathode material, researches have been dedicated
and the modification of existing materials.[10-14] While all of these directions have been
under rigorous investigation, the topic will always end up with a critical concern – the
materials surface. The surface is where lithium ions or electrons diffusion ends in the
material and transfer into the electrolyte or conductive agents, thus the majority of the side
reactions happen here due to non-equilibrium diffusion.[15, 16] Attempts of surface
modification aimed at adjusting the surface chemical or physical properties have been
made within the past decades, but the underlying mechanisms have not yet been fully
unraveled. In this chapter, we present a comprehensive review of surface modification
methods on cathode materials by starting with an understanding of the fundamental origins
of the surface behaviors, followed by possible explanations to how surface modification
work and a prospect of advanced surface modification methods.
1.2
Surface Behaviors of Cathode Materials
1.2.1
Surface Phase Reconstruction
1.2.1.1
Layered LiMeO
2(Me = Co, Mn, Ni)
Owing to the considerable voltage and capacity and easy scalability, LiCoO2 has been
registered as the most successful cathode material so far. Layered LiCoO2 belongs to a
rhombohedral space group R3̅m with edge-sharing CoO6 octahedra, which gives CoO2
sheets.[17] Lithium ions reside in between the CoO2 sheets so that the electrochemical
deintercalation forms LixCoO2.[18] Despite the theoretical capacity of LiCoO2 is
calculated to be 272 mAhg-1, in practical, LiCoO2 can only be deintercalated to Li0.5CoO2
within a cut-off voltage of 4.5 V, hence only half of the theoretical capacity can be
reversible.[18] The reason is that LiCoO2 undergoes phase transition from layered to
quasi-spinel (QS) structure when half of the lithium is deintercalated. It is suggested that the
transition is due to the migration of Co ions into Li planes because of the higher thermal
diffusivity.[19] Dahn et al. initially reported the synthesis of QS-LiCoO2 (or in some cases
written as Li1+yCo2O4) in space group Fd3̅m at low temperature (400 oC), the
thermodynamic stability of which is lower than that of layered LiCoO2.[20] Various
approaches to synthesizing LiCoO2 with both layered and quasi-spinel configurations were
shows much lower capacity and higher polarization than layered LiCoO2, thus turning out
to be an inferior candidate for battery materials.[20] X-ray absorption near-edge spectra
(XANES) confirmed that there are intermediate phases between the layered and spinel
structures due to the higher oxidation state of spinel LiCoO2,[22] it was thereafter found to
be LixCo1-x[Co2]O4 by Thackeray et al.[23]
The formation of spinel phase in layered LiCoO2 was found to initiate from the surface and
extends to the bulk upon intensive cycling, extended voltage window and operation under
high temperature. Transmission electron microscopy (TEM) studies revealed that there are
dislocations and internal strains within the lattice of LiCoO2 even at low cycle numbers,
the accumulation of these defects is directly responsible for long term capacity fade.[24,
25] The presence of strains indicates that the interlayer spacing within LiCoO2 lattice has
been changed, which is in accordance with the in-situ X-ray diffraction (XRD) study
carried out by Dahn et al.[19] A recent study found that post-thermal treatment of LiCoO2
forms a thin spinel LixCo2O4 film on the surface and improves the performance
significantly since the spinel phase is strongly conductive.[26] This report is however
contradictive to previous studies, probably due to the different formation mechanisms of
this phase.
The layered to spinel phase change has also been observed in other species of metal oxide
cathodes such as LiNiO2 and LiMnO2, which are iso-structures of layered LiCoO2 as shown
in Figure 1.3a.[27-29] Each of these ending members of LiMeO2 (Me = Ni, Co, Mn)
possesses its unique advantages as a cathode material. Nevertheless, other than the
structural transition, these materials suffer from severe Jahn-Teller distortion, which is
another chief factor of the capacity decay.[30, 31] In the case of LiNiO2, the low spin Ni3+
ion has a 𝑡2𝑔6 𝑒𝑔1 electronic configuration, the Jahn-Teller distortion can be induced by the
eg energy level, resulting in the structural destruction due to internal stress.[31] Earliest
observation of the Jahn-Teller distortion of LiNiO2 was reported by Delmas et al. in
1995.[30] Two Ni-O bond lengths with 1.91Å and 2.09 Å were found to exist in LiNiO2
by employing extended x-ray absorption fine structure (EXAFS). Unlike Ni3+, the
electronic configuration of Co3+ can be expressed as 𝑡2𝑔6 , with one less valence electron,
of this, plenty of efforts have been dedicated to the investigation of dopants induced
suppression, such as Al, Co, Mn, Cr etc.[32, 33] The fundamental principle is to lower the
concentration of the Jahn-Teller effective ions, for instance, doping LiNiO2 with Co to
form LiCo0.5Ni0.5O2 has been suggested to change the Ni electronic configuration from
𝑡2𝑔6 𝑒𝑔1 to 𝑡2𝑔6 𝑒𝑔2, which is Jahn-Teller inactive.[34, 35]
The attempts of doping fundamental layered metal oxides introduce numerous derivatives,
which are of remarkable value now. Among them, LiNixMnyCo1-x-yO2 (NMC) and
LiNi0.8Co0.15Al0.05O2 (NCA) have found applications in current electrical vehicles. The
high operational voltage and specific capacity have made these materials outperform many
Figure 1.3 (a) Compositional phase diagram of LiMnO2-LiNiO2-LiCoO2 (Reproduced
from ref. [41] with permission, copyright 2015 Wiley-VCH); (b) reconstructed surface
layer after 1st cycle within 2.0-4.7 V (Reproduced from ref. [37] with permission,
copyright 2014 Nature Publishers); (c) Degradation mechanism of Ni-rich
LiNi0.5Co0.2Mn0.3O2 (Reproduced from ref. [42] with permission, copyright 2014
Wiley-VCH)
Within the category of NMC layered cathode materials, LiNi1/3Mn1/3Co1/3O2 with a ratio
of 1:1:1 (NMC111) has been most studied since it combines the rate performance of
LiCoO2, safety of LiMnO2 and capacity of LiNiO2 as has been illustrated in Figure 1.3a,
the surface reconstruction upon aggressive exposure to electrolyte has, however, also been
reported in these materials, as shown in Figure 1.3b.[37] In an attempt to achieve high
focus in recent years. The rich Ni content in the material, however, involves safety issues
and preparation difficulty.[42] Due to the close ionic radii and charge with Li+, Ni2+ in
Ni-rich NMC materials has been found to show very high degree of interlayer mixing with the
Li+, which results in strong phase segregation and capacity fade.[43] Figure 1.3c shows a
schematic illustration of the degradation mechanism of a LiNi0.5Co0.2Mn0.3O2 (NMC523)
material. In this study, different degradation mechanism from NMC111 was proposed,
specifically, O3 to O1 phase transformation was supposed to be the major reason of
capacity fade in NMC111 due to the formation of stacking fault. However, no such phase
transformation was observed in NMC523, probably due to the higher Ni-Li site exchange
since the Ni percentage in NMC523 is much higher. These studies have unambiguously
pointed out that the stabilization of Ni in Ni-rich NMC cathodes is the key to stabilized
performance. A possible strategy is to design a Ni rich bulk and Mn rich surface NMC
material, this gradient concentration has proven to be effective in controlling the surface
Ni disorder.[44-46]
1.2.1.2
Layered Lithium-rich Oxides Layered LiMeO
2(Me = Co,
Mn, Ni)
Lithium-rich layered oxides are controversially recognized as either the solid solutions or
nano-domains of Li2MnO3 (monoclinic, C2/m) and LiMeO2 (Me = transition metals)
(rhombohedral, R3̅m).[47] The crystalline structure of a typical Li-rich layered NMC
material is shown in Figure 1.4a(i), lithium ions occupy part of the transition metals and
result in off-stoichiometric lithium content compared with conventional NMC based
materials.[48, 49] It has drawn much attention because of the high capacity (above 250
mAhg-1) and high voltage. Dissimilar with other layered materials, this material shows an
anomalous voltage plateau at ~4.5 V during the first charge, where all of the transition
metals should have reached their final oxidation state. Early researches speculated that the
mysterious charge plateau was originated from the removal of lithium and oxygen, but
direct observation was not reported until 2006.[50] By using in situ differential
electrochemical mass spectrometry (DEMS), P. Bruce et al. found that there was O2 release
when the material was initially charged to above 4.2 V. The lithiation/de-lithiation process
is charged to a cutoff voltage of 4.2 V, the whole process resembles a conventional NMC
that the lithium ions from the lithium ion layer are removed. However, at a voltage above
4.2 V, the lithium ions that reside in the octahedrally coordinated transition metal layer get
extracted, associated with the loss of O2-, which is subsequently oxidized to O2 and is
responsible for the “anomalous plateau”. The oxygen vacancies de-stabilize the transition
metals, in particular Ni ions, resulting in the diffusion of transition metals into the lithium
ion layers and form a spinel phase that blocks lithium ions transportation.[51] Once the O2
gas is released, a series of side reactions take place. Yabuuchi et al. combined synchrotron
X-ray diffraction (SXRD), X-ray absorption spectroscopy (XAS), X-ray photoelectron
spectroscopy (XPS) and time-of-flight secondary ion mass spectroscopy (TOF-SIMS) to
investigate the surface behaviours of Li2MnO3-LiCo1/3Ni1/3Mn1/3O2. The released O2 may
undergo oxygen reduction reaction at the material surface and form Li2CO3 which is
responsible for the disappearance of the reversible capacity of the surface redox reactions
during the first several cycles.[52] On the other hand, O2 gas facilitates the decomposition
of electrolyte under high voltage and results in undesirable solid electrolyte interphase
(SEI) growth, low initial coulombic efficiency and impedance buildup. In addition, O2
release potentially increases the risk of battery thermal runaway and leads to safety
concern.[53, 54]
Aside from the oxygen formation, severe voltage decay has also been observed in this type
of cathode materials as has been shown in Figure 1.4b. The voltage decay leads to the drop
of cell energy density,[55] it is supposed to be the major factor that should be addressed in
order to commercialize lithium rich NMC. Gu et al. examined the phase distribution of
Li1.2Ni0.2Mn0.6O2 and found that Ni was highly inhomogeneous, as shown in Figure 1.4c,
whereas the Mn was rather uniform. This observation proves that phase segregation exists
in cycled Li-rich layered materials, which is possibly the reason of low capacity and poor
rate capability.[56-58] The sluggish lithium diffusion across the surface caused by the
phase segregation is directly responsible for the voltage decay, therefore strategies aimed
at suppressing voltage fade are mostly focused on surface phase change suppression. In
addition, corrosion induced pits are often found in heavily cycled particles and the
formation of these pits evidently happens on specific crystallographic facets. The surface
diffraction spots are always observed in extensively cycled particles, as can be seen from
Figure 1.4d, which is also an evidence of cation migration.
Figure 1.4 (a) Proposed phase changes in a lithium rich NMC under different
cutting-off voltages; (Reproduced from ref. [51] with permission, copyright 2013 Royal
Society of Chemistry); (b) Typical charge/discharge curves of lithium rich NMC
American Chemical Society) (c) HAADF Z-contrast image and XEDS maps showing
non-uniform distribution of elements in a cycled lithium-rich NMC particle.
(Reproduced from ref. [56] with permission, copyright 2013 American Chemical
Society) (d) Low magnification STEM-HAADF images and corresponding [010] zone
axis SAED patterns of the lithium rich cathodes after different cycles (Reproduced
from ref. [60] with permission, copyright 2015 American Chemical Society)
1.2.1.3
Spinel LiMn
2O
4The spinel type LiMn2O4 belongs to space group symmetry of Fd3̅m, in which Mn shows
an average valence of 3.5, indicating the coexistence of Mn3+ and Mn4+.[61] However, the
equilibrium can be easily broken by Li+ insertion or temperature change, causing the
Jahn-Teller distortion of Mn3+ at the octahedral sites. The onset of Jahn-Teller distortion at 4.0
V has been regarded as the principal origin of capacity loss.[62, 63] Study on the surface
structure of LiMn2O4 revealed that the net valence differs from the bulk, with more Mn3+
in presence due to the non-equipoised dynamics of Li+ insertion (C-rate controlled) and
extraction (diffusion-controlled) at the surface.[64, 65] This was suggested to result in the
formation of Li2Mn2O4, which is much less electrochemically reactive.[66] Nonetheless,
the phase transition from cubic to tetragonal induced by the Mn3+ Jahn-Teller distortion
was speculated to generate phase boundary at the particle surfaces and thwart the diffusion
of Li+. Similar with the strategies of doping alien elements in layered LiMeO
2, the doping
of LiMn2O4 has also been a vastly studied topic aimed at suppressing the Jahn-Teller
distortion.[61, 65] Of the various doping elements, introducing Ni to form P4332
LiNi0.5Mn1.5O4 is the most successful one, due to the electrochemical reactivity of Ni2+ and
the disappearance of Mn3+.[67] Furthermore, the incorporation of Ni2+ provides two
voltage plateaus at about 4.7 V (Ni2+/Ni3+, Ni3+/Ni4+), making it a very promising high
power cathode material. Even though trace Mn3+ was reported in oxygen-deficient
LiNi0.5Mn1.5O4-δ with space group Fd3̅m, the Jahn-Teller distortion is much more
1.2.2
Stress-induced Cracking
Mechanical cracking is most reported in anode materials that suffer from tremendous
volume expansion upon lithiation, such as Si and Sn. The cathode materials, however, are
also found to develop cracks upon high rate cycling when the lithium ions do not have
sufficient time to diffuse homogeneously, ending up with extra stress in particles.[71, 72]
On a brittle cathode material, the C-rate that initiates cracks decreases with increasing
particle size.[73, 74] The internal stress of electrode materials during preparation and phase
change (such as Jahn-Teller distortion, O2 release) induced stress can also help develop
cracks at the materials bulk and keep propagating.[75] In addition, if the volume expansion
of cathode materials is non-elastic deformation, it will lose contact with binders and
conductive carbon, forming gaps in between. The occurrence of cracks segregates part of
the materials from the electrolyte and leads to the increase of impedance and subsequent
battery failure. An in-situ SEM study on LiNi0.8Co0.15Al0.05O2 shows direct visual evidence
of the cracks development and separation of active materials from electrolyte, as shown in
Figure 1.5a-d. Surprisingly, such cracks development started even from the first cycle,
indicating that the prevention of cracking in cathode materials is very necessary. A
schematic diagram showing the segregation consequence of the cracking towards lithium
diffusion is presented in Figure 1.5e. Zhang et al. investigated the crack formation on
lithium rich layered Li[Li0.2Ni0.2Mn0.6]O2.[76] Micro-cracks were found in deeply cycled
particles due to the large strain caused by simultaneous removal of lithium and oxygen,
ending up with pulverized surface structures. The surface Mn ions were found to have been
reduced as revealed by electron energy loss spectroscopy (EELS), indicating the break of
Figure 1.5 SEM images of LiNi0.8Co0.15Al0.05O2 particle cracking after (a) 1; (b) 2; (c)
3; (d) 4 electrochemical cycles; (Reproduced from ref. [77] with permission, copyright
WILEY-VCH 2013) (e) Schematic illustration of the segregation consequences of
1.2.3
Electrolyte Decomposition and Transition Metal Dissolution
1.2.3.1
Electrolyte Decomposition
Electrolytes for LIBs are generally liquid or solid with electrical conductivity below 10-10
S/cm and lithium ion conductivity above 10-4 S/cm.[78] Organic carbonate esters based
blends, including ethylene carbonate (EC), diethylene carbonate (DEC), propylene
carbonate (PC), dimethylene carbonate (DMC) and ethylmethyl carbonate (EMC) are
widely used as electrolyte solvents,[79] LiPF6 is the common salt currently.[80] The
operation voltage windows of these solvents are typically from 1.0 V to 4.7 V vs.
Li/Li+,[81, 82] therefore any cathode materials that require a voltage cutoff value above
4.7 V (in practical 4.5 V due to the catalytic effect of cathode materials) inevitably involve
the oxidation decomposition of electrolyte. The consequence of the electrolyte
decomposition is the formation of a passivation SEI layer, comprising inorganic salts such
as Li2CO3, LiF, and organic species like poly(ethylene carbonate).[83-85] Due to the
oxidation nature of the metal oxide cathode materials, the decomposition of electrolyte may
be accompanied with gas evolution such as CO2.[86-88] The SEI layer is normally
electrically insulating yet lithium conductive.[89, 90] Much efforts have been dedicated to
expanding the electrolyte redox window, such as the fluorination of solvents in order to
lower the highest occupied molecular orbital (HOMO) and lowest occupied molecular
orbital (LUMO) of organic carbonate esters.[91] The SEI formation causes irreversible
capacity loss at the first several cycles, in this sense, it is unfavorable to the battery
performance.
The intricacy of SEI growth is far from being resolved thus far.[84] Despite the capacity
consumption during the electrolyte decomposition, the oxidation of electrolyte on the
surface of cathode materials requires continuous electron transfer,[78, 92] the electrically
insulating layer can keep the electrolyte from being further oxidized, an SEI layer with
certain thickness and considerable stability is therefore desired.[79, 93] In order to mitigate
the electrolyte decomposition, the introduction of sacrificial electrolyte additives has been
extensively reported.[94] As the electrolyte decomposition mechanisms on anode and
cathode are reduction and oxidation reactions respectively, the additive selection is distinct.
Lithium bos(oxalato) borate (LiBOB), glutaric anhydride, 2,5-dihydrofuran,
γ-butyrolactone, 2-(Pentafluorophenyl)-tetrafluoro-1,3,2-benzodioxaborole,
1,1-Difluoro-1-alkenes, vinyl ethylene carbonate, tris_hexafluoro-iso-propyl_phosphate et al. have been
reported as suitable additives for cathode materials.[95-102] The inspirational role of SEI
has motivated researchers to develop the surface coating technique, i.e., instead of
generating an SEI layer, an artificial layer is intentionally deposited onto electrode
particles.[103]
1.2.3.2
Transition Metal Dissolution
Nonetheless, the decomposition issue is not the only problem that pertains to the
electrolyte. Practically, there are traces of moisture in the electrolyte or on the surface of
cathode materials. The LiPF6 salt may undergo the reaction: LiPF6⇌ LiF + PF5, followed
by the hydrolysis of PF5: PF5 + H2O → POF3 + 2HF according to Aurbach and Heider’s
theory.[88, 104] The HF from the hydrolysis of PF5, along with the inherent HF in the
LiPF6 salt, triggers obscure side reactions on the cathode materials.[79, 105, 106] Taking
spinel LiMn2O4 as an example, it was found that cathode materials containing more Mn3+
tend to suffer from higher manganese dissolution into the electrolyte.[107, 108] The Mn3+
tends to undergo a disproportional reaction: 2Mn3+ → Mn2+ + Mn4+, where the Mn4+
remains on the material surface and Mn2+ dissolves into the electrolyte. Aoshima and
colleagues studied the mechanism of capacity fading in manganese spinels and concluded
that the dissolved Mn2+ tend to form a layer of MnF2 and ramsdellite-Li0.5MnO2 on the
surface of cathode, and another layer of metal Mn on the anode, the synergetic deterioration
of both cathode and anode is responsible for the capacity fading.[66, 109-111] A more
recent study by Kanno and coworkers found that the dissolution of Mn also differs
according to the crystal planes exposed to the electrolyte, the (110) plane was found to be
less stable than the (111) plane.[106] The dissolution of Mn is, however, more intense in
cathode materials that work under higher voltage such as LiNi0.5Mn1.5O4 and high
operation temperatures.[112] The side effect of the Mn dissolution, aside from the loss of
active materials, also involves the degradation of the anode part. An “ion-exchange model”
was proposed to explain the reaction of Mn on the anode surface as shown in Figure
by exchanging with the Li+ in the SEI, it becomes Mn-rich and the lithium diffusion
channels are often blocked by the Mn and thus results in impedance growth.
Figure 1.6 Schematic illustration of the Mn-Li exchange model mechanism for the
deposition of Mn on graphite in a graphite/LiMn2O4 cell (Reproduced from reference
[111] with permission, Copyright 2013 Nature Publishers)
1.2.4
Electrical/Li-Ion Conductivity
The kinetics of lithium and electrical diffusion in cathode materials are critical factors
during the electrochemical process. The conduction phenomena of Li-ion batteries has
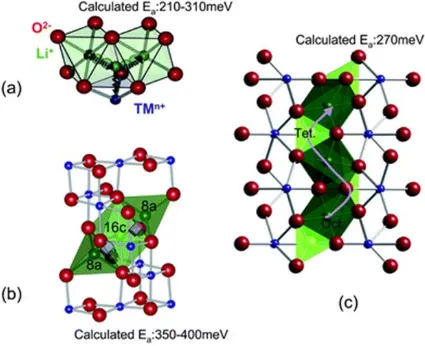
been comprehensively reviewed by Fisher et al.[16] and Park et al.[113] The lithium ions
diffusion paths in typical layered, spinel and olivine structures and their activation energies
are illustrated in Figure 1.7 adopted from Meng’s review, details are summarized in Table
1.1.[114] Depending on the diffusion paths and activation energy, various cathode
Figure 1.7 Lithium diffusion paths and activation energies calculated via density
function theory (DFT) of (a) layered, (b) spinel and (c) olivine structures (Reproduced
from ref. [114] with permission, copyright 2009 Royal Society of Chemistry)
Table 1.1 Lithium ions diffusion in various categories of typical cathode materials
Material Structure Diffusion path Activation barrier Dimensions
LiMeO2 Layered Oct.→Oct. 210-310 meV 2D
LiMn2O4 Spinel Tet.→Oct.→ Tet. 350-400 meV 3D
1.3
Roles of Surface Modifications
1.3.1
Surface Modification as Phase Transition Blocker
1.3.1.1
Surface Doping Design
Bulk doping on cathode materials has been studied over decades, the aim of this process is
to control the phase change or enhance the diffusion rate within a particle. However, bulk
doping elements, usually Ti, Al and so on, are normally electrochemically inactive,
restricting the doping to the material surface has therefore become a prevalent topic since
minimum capacity sacrifice is expected in this scenario. Cho had conducted tremendous
work on the surface protection of LiCoO2 and in most of the cases, the metal ions in the
coating oxide materials, such as Al, Zr and Sn were speculated to have migrated into the
near surface lattice of the cathode materials, forming a solid solution.[115-118] His early
work in 2000 showed that when the surface of LiCoO2 was slightly doped with Al, the c
axis would have 1.7% shift during the first cycle whereas the ones with solid solution on
the surface showed only 0.14%, which was also observed in their later report on Zr doped
surface. This opinion was however opposed by Dahn et al. when they conducted a ZrO2
coating study on LiCoO2 with careful examination on the structural change, no difference
was observed on the coated and bare samples.[119, 120] Therefore, closer investigation on
the mechanism through which surface doping works to suppress the phase reconstruction
is needed. Recently, Park et al. reported another possible explanation.[121] MgO was
deposited onto the surface of LiCoO2 followed by heat treatment under different
temperatures. Before electrochemical cycling, the structure remained exactly the same on
both the near surface and bulk. However, when the material was cycled, extra diffractions
can be observed on the non-coated areas and the bulk, these weak reflections were
supposed to be lithium and vacancy ordering, which were not observed in the coated
region. Therefore, they concluded that the incorporation of Mg into the LiCoO2 actually
occupied the Li sites instead of Co sites and this is the reason why it did not undergo any
phase transition. Similar with this study, Cho also reported another possible design of
surface solid solution recently, they used Ni2+ ions to reside in the Li slabs on the near
surface of LiNi0.62Co0.14Mn0.24O2 with a thickness of about 10 nm. This material showed
study of Cabana and coworkers has adopted Al2O3 to modify the surface of LiMn2O4
nanoparticles and found that an expitaxially grown Mn3+-depleted phase was formed on
the surface as shown in Figure 1.8a. The replacement of Mn3+ by non-soluble Al3+ on the
surface has reduced the risk of surface destruction and resulted in significant performance
enhancement. Similar study has also been reported by Amine and co-workers.[123]
Figure 1.8 (a) High-resolution HAADF image indicating an Al-rich surface on the
LiMn2O4 nanoparticle; (b) Stability test of the bare LiMn2O4 and Al-modified
LiMn2O4 under 55 oC. (Reproduced from ref. [124] with permission, copyright 2014
American Chemical Society)
When it comes to the issue of Jahn-Teller distortion caused phase transitions, surface
doping design often shows very apparent improvement. Taking LiMn2O4 as an example,
as has been discussed above, the Jahn-Teller distortion is most intense at the material
surface where the charge equilibrium is always broken by the lithium diffusion. With
respect to this, many researchers believe that modifying only the surface of LiMn2O4 to
replace part of the Jahn-Teller active ions can help avoid performance fade at lowest
expense of capacity loss.[125] Chung et al. adopted a coating material composed of
LiM0.05Mn1.95O4 (M = Co, Ni) to deposit onto the surface of LiMn2O4.[126] The slightly
doped LiM0.05Mn1.95O4 was supposed to be able to suppress the Jahn-Teller effect. Similar
speculation was also proposed by Xiong et al.[127] They found that when Al2O3 coated