Bayesian Validation of the Indirect Immunofluorescence Assay and Its
Superiority to the Enzyme-Linked Immunosorbent Assay and the
Complement Fixation Test for Detecting Antibodies against
Coxiella
burnetii
in Goat Serum
Michael Muleme,a,bJohn Stenos,bGemma Vincent,bAngus Campbell,cStephen Graves,bSimone Warner,dJoanne M. Devlin,a Chelsea Nguyen,bMark A. Stevenson,aColin R. Wilks,aSimon M. Firestonea
Asia-Pacific Centre for Animal Health, Faculty of Veterinary and Agricultural Sciences, The University of Melbourne, Parkville, Australiaa
; Australian Rickettsial Reference Laboratory, Geelong, Australiab
; The Mackinnon Project, Faculty of Veterinary and Agricultural Sciences, The University of Melbourne, Werribee, Australiac
; AgriBio Laboratory, Department of Economic Development, Jobs, Transport and Resources (DEDJTR), Bundoora, Australiad
Although many studies have reported the indirect immunofluorescence assay (IFA) to be more sensitive in detection of
antibod-ies to
Coxiella burnetii
than the complement fixation test (CFT), the diagnostic sensitivity (DSe) and diagnostic specificity (DSp)
of the assay have not been previously established for use in ruminants. This study aimed to validate the IFA by describing the
optimization, selection of cutoff titers, repeatability, and reliability as well as the DSe and DSp of the assay. Bayesian latent class
analysis was used to estimate diagnostic specifications in comparison with the CFT and the enzyme-linked immunosorbent assay
(ELISA). The optimal cutoff dilution for screening for IgG and IgM antibodies in goat serum using the IFA was estimated to be
1:160. The IFA had good repeatability (
>
96.9% for IgG,
>
78.0% for IgM), and there was almost perfect agreement (Cohen’s
kappa
>
0.80 for IgG) between the readings reported by two technicians for samples tested for IgG antibodies. The IFA had a
higher DSe (94.8%; 95% confidence interval [CI], 80.3, 99.6) for the detection of IgG antibodies against
C. burnetii
than the
ELISA (70.1%; 95% CI, 52.7, 91.0) and the CFT (29.8%; 95% CI, 17.0, 44.8). All three tests were highly specific for goat IgG
anti-bodies. The IFA also had a higher DSe (88.8%; 95% CI, 58.2, 99.5) for detection of IgM antibodies than the ELISA (71.7%; 95%
CI, 46.3, 92.8). These results underscore the better suitability of the IFA than of the CFT and ELISA for detection of IgG and IgM
antibodies in goat serum and possibly in serum from other ruminants.
C
oxiella burnetii
causes Q fever in humans as well as abortions,
stillbirths, and infertility in ruminants (
1–5
). The organism
replicates in the placenta of infected ruminants, reaching a level of
up to 10
9bacteria per gram of placenta tissue (
4–6
).
C. burnetii
organisms are shed in an extremely high concentration in birth
fluids, placental tissues, and membranes of aborted fetuses as well
as in milk, urine, and feces of infected ruminant animals around
the parturition period (
4
,
5
). The high concentration of
C. burnetii
organisms shed in tissues, fluids, and excreta of infected
rumi-nants is the primary source of human infections (
7
).
Caprine and ovine infections have been reported to result in
severe placentitis and consequently in shedding of higher
num-bers of
C. burnetii
organisms than infections of cattle (
8
). Studies
have also revealed that goats and sheep shed higher quantities of
C.
burnetii
in feces, vaginal mucus, and birth tissues than other
live-stock (
9
). Thus, the risk of human transmission is higher when
infections occur in herds of small ruminants than when they occur
with other livestock. Unsurprisingly, the majority of reported
large outbreaks of Q fever have been associated with infected
sheep and goat flocks, including a major outbreak of more than
4,000 human Q fever cases in the Netherlands that was linked to
sheep and goat farms with over 50 animals (
9–14
). Infection with
C. burnetii
can be asymptomatic in many animals and may be
detected in ruminants only when infection causes abortions and
reproductive abnormalities in pregnant animals (
1
). Delay in
di-agnosis in livestock slows the implementation of appropriate
con-trol strategies, thus increasing the risk of human infection.
Coxiellosis in animals can be diagnosed through microscopic
examination of stained tissues, culture, detection of
C. burnetii
DNA using PCR, and detection of antibodies to
C. burnetii
in
blood and milk (
15
,
16
). The microscopic diagnosis of coxiellosis
is mainly undertaken on placental tissues using
Stamp-Macchia-vello coloration or Giemsa stain. The organism can be cultured in
cells, embryonated hen eggs, or cell-free media (
15
,
17
). However,
microscopy and culture are expensive and require biosafety level 3
facilities. Furthermore, microscopic examination of stained
tis-sues for
C. burnetii
detection is reported to have poor specificity
because
C. burnetii
can be confused with other organisms such as
Chlamydia
and
Brucella
(
17
). The culturing of
C. burnetii
is slow
and has been reported to be unsuccessful using samples from
Received21 December 2015Returned for modification15 February 2016 Accepted14 April 2016
Accepted manuscript posted online27 April 2016
CitationMuleme M, Stenos J, Vincent G, Campbell A, Graves S, Warner S, Devlin JM, Nguyen C, Stevenson MA, Wilks CR, Firestone SM. 2016. Bayesian validation of the indirect immunofluorescence assay and its superiority to the enzyme-linked immunosorbent assay and the complement fixation test for detecting antibodies againstCoxiella burnetiiin goat serum. Clin Vaccine Immunol 23:507–514. doi:10.1128/CVI.00724-15.
Editor:M. F. Pasetti, University of Maryland School of Medicine Address correspondence to Michael Muleme, [email protected]. Supplemental material for this article may be found athttp://dx.doi.org/10.1128 /CVI.00724-15.
Copyright © 2016, American Society for Microbiology. All Rights Reserved.
on August 17, 2020 by guest
http://cvi.asm.org/
some individuals despite their being positive by PCR, serology,
and microscopy, suggesting that culturing is an unreliable method
for
C. burnetii
detection (
18
).
PCR methods of detecting
C. burnetii
DNA are widely
consid-ered to be highly sensitive (
19
). However, the relatively short
pe-riod of time during which ruminants shed
C. burnetii
in feces,
milk, vaginal mucus, and urine (
5
,
9
) limits the suitability of PCR
for the detection of
C. burnetii
infection. For example, goats
ex-perimentally infected with
C. burnetii
were reported to shed the
bacterium for 14 days in vaginal swabs, 52 days in milk, and 20
days in feces (
5
). Another study in naturally infected dairy cattle
generated reports of scenarios where shedding occurred by one
route and not the others, with only 6.4% of the infected animals
shedding the organism by all the three shedding routes (vaginal
mucus, feces, and milk) (
15
). Therefore, PCR detection of
C.
bur-netii
from milk, feces, and vaginal swabs should be attempted only
within a short period before and after parturition and should be
used alongside other diagnostic methods.
Antibodies to
C. burnetii
in ruminants and humans have been
reported to remain in circulation for long periods, thus making
serological diagnosis a reliable method of detecting exposure to
the organism. Antibody titers in vaccinated dairy cattle were
re-ported to remain four times as high as titers in unvaccinated cattle
for at least 20 months (
20
). Furthermore, antibodies detected
fol-lowing acute Q fever in human patients in the Netherlands were
reported to persist for at least a year after the initial diagnosis (
20
,
21
). IgM and IgG antibodies to phase 1 and phase 2 antigens of
C.
burnetii
are used to interpret the course of
C. burnetii
infection in
animals and humans (
22–24
). Recent infections can be identified
by detection of IgM phase 2 antibodies, which appear early in the
course of the disease. Persisting or chronic infections can be
iden-tified by detection of IgG antibodies, thus making serology very
useful in detection of
C. burnetii
infection and epidemiological
investigations (
23
,
24
). Limitations of serology for the diagnosis of
coxiellosis include an estimated delay of 2 to 3 weeks between
exposure and seroconversion, whereas
C. burnetii
DNA can be
detected in peripheral blood cells within days of exposure, with
results for seronegative animals being detectable by PCR on blood
samples (
22
,
25
). Early detection of
C. burnetii
DNA before
sero-conversion has not been reported in ruminants, however. In
ex-perimental infections with
C. burnetii
in goats, the earliest
PCR-positive blood samples were obtained 28 days after exposure (
26
).
Paired samples collected 4 weeks apart should be obtained to
en-sure that seronegative animals are diagnosed appropriately (
27
,
28
). The occurrence of seronegative animals shedding
C. burnetii
beyond the 4-week period during which seroconversion might be
expected to occur could be due to lack of sensitivity of the
sero-logical tests rather than to a true absence of antibodies in infected
animals (
9
,
29
). Indeed, some of these studies have used a
mixed-antigen enzyme-linked immunosorbent assay (ELISA) that has
been reported to lack sensitivity for IgG phase 2 antibodies (
30
).
Further studies are therefore necessary to investigate the
occur-rence of seronegative animals shedding
C. burnetii
in excreta.
The World Organisation for Animal Health (OIE)
recom-mends the complement fixation test (CFT) for serological
diagno-sis of coxiellodiagno-sis in animals (
31
) despite this assay being widely
reported to have very low diagnostic sensitivity (DSe) (
32
) and to
have nonspecific reactions on some samples leading to
uninter-pretable results. The indirect immunofluorescence assay (IFA) is
the human reference test (
27
,
33
) and has been reported to have a
diagnostic sensitivity of between 98% and 100% and a diagnostic
specificity (DSp) of 95%. The ELISA is reported to have a similarly
high specificity but a lower sensitivity than the IFA in diagnosing
human Q fever using serum samples (
33
,
34
).
A number of studies have reported that IFA and ELISA are
more sensitive than CFT for diagnosis of coxiellosis in ruminants
(
32
,
35–37
). As yet, estimates of DSe and DSp have not been
pub-lished for the IFA for use in ruminants. The OIE guidelines for the
validation of diagnostic tests (
38
) require a clear description of the
optimization process and setting of cutoff values as well as
estab-lishing the analytical and diagnostic performance of the assay for
any given diagnostic purpose. Bayesian latent class analysis has
been reported to provide reliable estimates of DSe and DSp in
situations where the reference test (the “gold standard”) is
imper-fect, as is the case with diagnosis of coxiellosis, where the reference
test (CFT) is known to have poor DSe (
32
,
39
). In this study, we
aimed to validate the indirect immunofluorescence assay for
de-tection of antibodies to
C. burnetii
in goat serum in infected herds,
as well as for declaring freedom of disease in herds of unknown
infection status. The specific objectives included using Bayesian
latent class analysis to estimate the DSe and DSp of the IFA in
detecting antibodies against
C. burnetii
in goat serum.
MATERIALS AND METHODS
Development of an IFA for detection of antibodies againstC. burnetiiin goat serum.Microscope slides were coated with phase 1 (Henzerling strain from the Australian Q vax vaccine) and phase 2 (Nine Mile)C. burnetiiantigens grown in Vero cells as previously described (40). Fluo-rescein-labeled anti-goat IgG and anti-sheep IgM (KPL, USA) were used to detect IgG and IgM antibody-antigen complexes, respectively, as de-scribed previously (41). All samples and conjugates were diluted in 2% casein–phosphate-buffered saline (PBS) to limit nonspecific binding. All samples and controls were tested in duplicate on every slide.
Briefly, serum samples made to a starting dilution of 1:40 and 2-fold serial dilutions of 1:40 were incubated with antigen in duplicate for a period of 40 min at 37°C before unbound serum was removed by washing with 10% PBS. Secondary conjugated antibodies were applied for a period of 40 min at 37°C, and then unbound antibodies were removed by wash-ing with 10% PBS. The slides were observed uswash-ing UV light microscopy at ⫻400 magnification. Seropositive samples were identified by the presence of fluorescence, while negative samples produced no fluorescence.
We obtained 12 goat serum samples from New Zealand (NZ [a coun-try declaredC. burnetii-free by the OIE]) for negative controls and used 2 goat serum samples from a knownC. burnetii-positive farm that we had pretested and found to have positive CFT titers (16 and 32) for positive controls. All the negative-control sera also tested negative using CFT (Se-rion Vi(Se-rion) and ELISA (IDEXX Q fever antibody ELISA kit).
To establish an initial dilution cutoff value for goat serum, we tested 2-fold serial dilutions of 1:5 to 1:160 of all the negative-control sera with conjugate at a 1:50 dilution. The 1:50 conjugate dilution was established using checkerboard dilutions of the conjugates within the recommended manufacturer’s range of 1:10 to 1:100. The lowest dilutions of conjugate and negative-control sera that did not produce fluorescence were chosen as the initial cutoff dilutions for a true positive sample.
Serum samples were then collected from 84 randomly selected goats in a 250-goat herd in Victoria, Australia. (All applicable international, na-tional, and institutional guidelines for the care and use of animals were followed. All procedures performed in studies involving animals were in accordance with the ethical standards of the University of Melbourne [University of Melbourne Animal Ethics Committee approval number 1413118].) The herd had previously tested positive forC. burnetii anti-bodies in serum using CFT testing and had also tested positive forC. burnetiiDNA in air samples, vaginal swabs, and placenta samples using
on August 17, 2020 by guest
http://cvi.asm.org/
PCR (42). There were also 22 laboratory-confirmed human cases of acute Q fever associated with the farm (42). Two-fold serial dilutions of the serum samples, from 1:40 to 1:40,960, were prepared and tested in dupli-cate using the IFA to determine the endpoint titer above which no anti-bodies toC. burnetiiwere detected in each of the samples. A starting dilution of 1:40 was previously published as optimal for detectingC. bur-netiiantibodies in goat serum using IFA (32).
Analytical performance of the developed IFA for detection of anti-bodies againstC. burnetiiin goat serum.To assess the reliability of in-teroperator readings, each of the wells of the 84 serum samples from the randomly selected goats and of the 14 control serum samples was read by two technicians (43) and the level of agreement beyond that expected due to chance effects alone was estimated using Cohen’s kappa test statistic (⌲) (44). In total, 1,280 wells were read in duplicate (364 for the phase 1 IgG test, 364 for phase 2 IgG, 276 for phase 1 IgM, and 276 for phase 2 IgM). To assess the robustness and repeatability of the test, 32 of the 84 serum samples from the randomly selected goats were retested after 3 months of storage at 4°C and⌲values were estimated for the paired samples. Kappa values were interpreted according to the Landis and Koch descriptors, with⌲ⱕ0 considered to represent poor agreement, 0⬍ ⌲ⱕ 0.20 slight agreement, 0.20⬍ ⌲ⱕ0.40 fair agreement, 0.40⬍ ⌲ⱕ0.60 moderate agreement, 0.60⬍ ⌲ⱕ0.80 substantial agreement, and 0.80⬍ ⌲ ⬍1.00 almost perfect agreement (45).
Comparison of the diagnostic performances of the IFA, CFT, and ELISA methods for detecting antibodies againstC. burnetiiin goat se-rum.The 12 negative-control sera and the 84 field samples from the in-fected herd were tested using the CFT and a commercially available ELISA (IDEXX CHEKIT). The CFT was used as it is configured to detect IgG and IgM antibodies to phase 2C. burnetii. This testing was performed at the Victorian State Government veterinary diagnostic laboratory (AgriBio, Department of Economic Development, Jobs, Transport and Resources [DEDJTR]).
A IDEXX CHEKIT ELISA kit was used to detect IgG antibodies to phase 1 and phase 2C. burnetiiin all serum samples according to the manufacturer’s instructions. The IDEXX ELISA kit was modified to detect IgM antibodies by replacing the anti-ruminant IgG conjugate with mouse anti-sheep IgM monoclonal antibody (clone 25.69; isotype IgG1 from AbD Serotec) and peroxidase-conjugated sheep anti-mouse IgG, as pre-viously described (36). The plates were blocked with 10 mg/ml bovine serum albumin (BSA)–PBS. All sera and conjugated antibodies were di-luted in 5 mg/ml BSA–PBS– 0.05% Tween 20. The anti-sheep IgM was used at the optimum dilution of 1:600 (see Table S1 in the supplemental material). The anti-mouse IgG was used at the optimum dilution of 1:3,000 (see Table S1), while control and test serum samples were used at a dilution of 1:400. To determine the cutoff value for the IgM ELISA, the negative-control NZ sera were tested at the optimum serum and conju-gate dilutions and their absorbance was measured at 450 nm. The mean optical density (OD) values and standard deviations (SD) of the results from the known negative samples were calculated. Corrected OD (COD) values were then calculated using the following formula:
COD⫽
共
ODsample⫺ODblank兲
共
ODpositive⫺ODblank兲
(1)
where ODsamplerepresents the mean OD of two ELISA plate wells
con-taining the same sample, ODblankrepresents the mean OD of the two
ELISA plate wells containing only the diluent (5 mg/ml BSA–PBS), and
ODpositiverepresents the mean OD of the two ELISA plate wells containing
diluted positive controls.
Cutoff values for the ELISA were calculated using COD mean and SD values obtained from the negative-control sera. The 84 samples from the C. burnetii-positive farm samples and the 12 negative-control samples were all tested by the modified ELISA (modELISA) to detect total IgM antibodies (IgM antibodies to both phase 1 and phase 2C. burnetii).
Statistical analysis.Bayesian latent class models were constructed to estimate the cutoff titer that maximized diagnostic sensitivity and
speci-ficity, as assessed using Youden’s index (Y⫽DSe⫹DSp⫺1), following the OIE-recommended approach (38,46,47). Separate models were con-structed to compare pairs of tests, assuming both tests in each pair were conditionally dependent (i.e., based on similar biological phenomena) and that neither was a gold standard. Comparisons were made only be-tween the different combinations of antigen and immunoglobulin classes that the CFT and ELISA are designed to detect: IgG and IgM to phase 2 only for the CFT, IgG only for phases 1 and 2 for the ELISA, and IgM only for phases 1 and 2 for the modELISA. This approach makes no assump-tions about the infection status of tested animals. Indeed, the model is constructed to estimate four latent probabilities (that samples testing doubly positive [⫹ ⫹], positive and negative [⫹–], negative and positive [–⫹], or doubly negative [– –] on the two tests are truly positive) to enable inference of the diagnostic specifications of both tests without perfect knowledge. A two-population model was implemented with the assump-tion of different true animal-level prevalences for the 12 knownC. bur-netii-negative NZ samples and the 84 samples from the infected herd.
Prior information about the diagnostic specificity and sensitivity of each assay was modeled using independent and informative unimodal beta distributions based on published diagnostic sensitivities of 93.1%, 93.1%, 85.7%, and 20.6% for the IFA, IDEXX ELISA, modELISA, and CFT, respectively, and diagnostic specificities of 91.2%, 91.2%, 97.6%, and 97.3% for the IFA, IDEXX ELISA, modELISA, and CFT, respectively (see Table S2 in the supplemental material for detailed prior specifica-tions) (32–35,48).
Diagnostic specificity and sensitivity of the IFA were specified as dif-fuse prior distributions, following the method of Branscum et al. (46), to represent a lack of knowledge of the test’s specifications. Dependence parameters were specified as “uninformed” independent uniform butions, and Bayesian inferences were based on the joint posterior distri-bution, numerically approximated using the program WinBUGS (49), implemented with R2WinBUGS package (50) in the R statistical package (51), running 110,000 model iterations, discarding the first 10,000 itera-tions as burn-in, and thinning by 10 to minimize autocorrelation. Param-eters for beta prior distributions were estimated using the epiR library (52).K, prevalence and bias adjusted kappa (PABAK), and the propor-tions of positive and negative agreement for each comparison were di-rectly calculated as model outputs among the samples in the group known to be negative and the samples in the group from the infected herd. Final inferences were presented as the 50%, 2.5%, and 97.5% quantiles of the marginal posterior distributions for each of the parameters, correspond-ing to a posterior median point estimate and 95% confidence interval (95% CI), respectively. Analyses were repeated, applying different cutoff titers for dichotomizing the IFA results as test-positive results, which en-abled estimation of the two-way receiver operating characteristic (ROC) curve and globally optimal cutoff value (as assessed using Youden’s in-dex). A sensitivity analysis was performed to test for the influence of the priors on the final results, inputting vague (“flat”) priors with wider con-fidence intervals and comparing all model outputs.
RESULTS
Analytical performance of the IFA for detection of antibodies
against
C. burnetii
in goat serum.
No fluorescence was observed
using any of the negative-control samples with the IFA conjugates
(IgG and IgM) and antigens (phase 1 and phase 2) at a 1:160 serum
dilution (
Table 1
). The overall observed level of agreement
be-tween the two experienced technicians’ readings was 94.4% (95%
CI, 93.0, 95.5), and overall agreement beyond chance between the
readings of the two technicians was
K
⫽
0.88 (95% CI, 0.83, 0.94).
Test-specific observed levels of agreement between readings of
two technicians are reported in
Table 2
. The repeatability of the
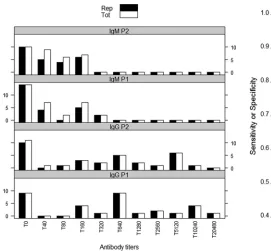
IFA was 100% (95% CI, 89.3, 100) for IgG phase 1, 96.9% (95%
CI, 84.3, 99.4) for IgG phase 2, and 78.1% (95% CI, 61.2, 89.0) for
both IgM phase 2 and IgM phase 1 (
Fig. 1
). The
K
values
on August 17, 2020 by guest
http://cvi.asm.org/
sponding to the levels of agreement between the two tests were
0.93 (95% CI, 0.58, 1.00) and 1.00 (95% CI, 0.65, 1.00) for IgG
phase 2 and IgG phase 1 and were 0.57 (95% CI, 0.26, 0.89) and
0.58 (95% CI, 0.27, 0.89) for IgM phase 2 and IgM phase 1,
respec-tively.
Comparison of the diagnostic performances of the IFA and
IDEXX ELISA methods for detecting IgG antibodies against
C.
burnetii
in goat serum.
Comparisons of the CFT and the ELISA to
the IFA are described in
Table 3
. Only one sample was positive on
ELISA but negative on both IFA and CFT, and two other samples
were inconclusive on ELISA but positive on IFA and CFT (
Table
3
). All of the negative-control samples from New Zealand
(de-clared
C. burnetii
-free by the OIE) tested negative on all three tests.
Compared to the IDEXX ELISA, the IFA had the greater
spec-ificity and sensitivity (Youden’s index) for detecting both IgG
phase 2 and 1 antibodies in goat sera at a cutoff of 1:160 total
antibody titer (
Fig. 2
). The observed agreement between the IFA
and the ELISA at the 1:160 cutoff titer was 81.1% (95% CI, 72.7,
88.0); the proportion of agreement beyond chance was 0.60 (95%
CI, 0.43, 0.74). The sensitivity of the IFA (94.8%; 95% CI, 80.3,
99.6) was greater than that of the ELISA (70.1%; 95% CI, 52.7,
91.0) in detecting IgG phase 1 and phase 2
C. burnetii
antibodies in
goat serum. The IFA and IDEXX ELISA had comparable
diagnos-tic specificity results (
Table 4
). Bayesian estimates of the specificity
and sensitivity for the IFA and IDEXX ELISA, and prior
probabil-ity distributions, are presented in
Table 4
.
Comparison of the diagnostic performances of the IFA and
modELISA for detecting IgM antibodies against
C. burnetii
.
The
mean COD
⫹
2 SD of the negative-control sera tested with the
modELISA was 0.448, while the mean COD
⫹
3 SD of the
nega-TABLE 1Assay optimization to establish the serum dilution without nonspecific binding to anti-goat IgG and anti-sheep IgM conjugates when 12 known negative goat sera were tested for antibodies against phase 1 and 2C. burnetiiantigen using the indirect immunofluorescence assaya
Sample ID or parameter
IFA result at indicated sample dilution or no. of samples
Phase 2 antigens Phase 1 antigens
5 10 20 40 80 160 5 10 20 40 80 160
Anti-goat IgG conjugate
370 ⫾ ⫺ ⫺ ⫺ ⫺ ⫺ ⫺ ⫺ ⫺ ⫺ ⫺ ⫺
371 ⫾ ⫾ ⫺ ⫺ ⫺ ⫺ ⫺ ⫺ ⫺ ⫺ ⫺ ⫺
372 ⫾ ⫾ ⫾ ⫺ ⫺ ⫺ ⫺ ⫺ ⫺ ⫺ ⫺ ⫺
373 ⫾ ⫾ ⫾ ⫺ ⫺ ⫺ ⫺ ⫺ ⫺ ⫺ ⫺ ⫺
374 ⫾ ⫾ ⫺ ⫺ ⫺ ⫺ ⫺ ⫺ ⫺ ⫺ ⫺ ⫺
375 ⫺ ⫺ ⫺ ⫺ ⫺ ⫺ ⫺ ⫺ ⫺ ⫺ ⫺ ⫺
924 ⫾ ⫾ ⫾ ⫺ ⫺ ⫺ ⫺ ⫺ ⫺ ⫺ ⫺ ⫺
925 ⫺ ⫺ ⫺ ⫺ ⫺ ⫺ ⫺ ⫺ ⫺ ⫺ ⫺ ⫺
927 ⫾ ⫾ ⫾ ⫾ ⫾ ⫺ ⫺ ⫺ ⫺ ⫺ ⫺ ⫺
928 ⫺ ⫺ ⫺ ⫺ ⫺ ⫺ ⫺ ⫺ ⫺ ⫺ ⫺ ⫺
930 ⫾ ⫾ ⫺ ⫺ ⫺ ⫺ ⫺ ⫺ ⫺ ⫺ ⫺ ⫺
936 ⫾ ⫾ ⫾ ⫾ ⫾ ⫺ ⫺ ⫺ ⫺ ⫺ ⫺ ⫺
No. of samples with⫾result 9 8 5 2 2 0 0 0 0 0 0 0
Anti-sheep IgM conjugate
370 ⫺ ⫺ ⫺ ⫺ ⫺ ⫺ ⫾ ⫾ ⫾ ⫾ ⫺ ⫺
371 ⫾ ⫾ ⫾ ⫾ ⫺ ⫺ ⫾ ⫾ ⫾ ⫾ ⫺ ⫺
372 ⫾ ⫾ ⫾ ⫺ ⫺ ⫺ ⫾ ⫺ ⫺ ⫺ ⫺ ⫺
373 ⫾ ⫾ ⫾ ⫺ ⫺ ⫺ ⫺ ⫺ ⫺ ⫺ ⫺ ⫺
374 ⫾ ⫾ ⫺ ⫺ ⫺ ⫺ ⫾ ⫾ ⫾ ⫾ ⫺ ⫺
375 ⫾ ⫾ ⫾ ⫺ ⫺ ⫺ ⫾ ⫾ ⫾ ⫾ ⫾ ⫺
924 ⫾ ⫾ ⫾ ⫺ ⫺ ⫺ ⫺ ⫺ ⫺ ⫺ ⫺ ⫺
925 ⫾ ⫾ ⫾ ⫾ ⫺ ⫺ ⫺ ⫺ ⫺ ⫺ ⫺ ⫺
927 ⫾ ⫾ ⫾ ⫾ ⫺ ⫺ ⫾ ⫾ ⫺ ⫺ ⫺ ⫺
928 ⫾ ⫾ ⫾ ⫾ ⫺ ⫺ ⫾ ⫾ ⫾ ⫾ ⫺ ⫺
930 ⫾ ⫾ ⫾ ⫺ ⫺ ⫺ ⫺ ⫺ ⫺ ⫺ ⫺ ⫺
936 ⫾ ⫾ ⫾ ⫺ ⫺ ⫺ ⫾ ⫾ ⫾ ⫾ ⫾ ⫺
No. of samples with⫾result 11 11 10 4 0 0 8 7 6 6 3 0
a⫺
, negative;⫾, nonspecific binding; ID, identification; IFA, indirect immunofluorescence assay.
TABLE 2Level of agreement between readings of results of the indirect immunofluorescence assay against phase 1 and 2C. burnetiiantigens in goat serum reported by two techniciansa
Test % positive agreement (n) % negative agreement (n) % observed agreement (95% CI) K(95% CI)
IgG phase 2 86.2 (145) 98.2 (219) 93.4 (90.4, 95.5) 0.86 (0.76, 0.96)
IgG phase 1 95.2 (165) 99.0 (199) 97.3 (95.0, 98.5) 0.94 (0.84, 1.00)
IgM phase 2 75.9 (83) 96.9 (193) 90.6 (86.6, 93.5) 0.77 (0.65, 0.88)
IgM phase 1 98.3 (61) 94.8 (215) 95.7 (92.6, 97.5) 0.88 (0.76, 1.00)
aCI, confidence interval;K, Cohen’s kappa.
on August 17, 2020 by guest
http://cvi.asm.org/
tive-control sera was 0.530. Therefore, with the modELISA
sam-ples that had a COD of
⬍
0.448 were interpreted as representing
negative results, while test samples that had a COD of
ⱖ0.530 were
interpreted as positive. Test samples that had a COD of at least
0.448 but less than 0.530 were interpreted as representing
incon-clusive results. The Bland-Altman test of agreement performed on
all the negative-control sera and the three positive-control sera
showed no statistically significant difference between duplicate
modELISA results on the same sample [
P
(
t
)
⫽
0.813].
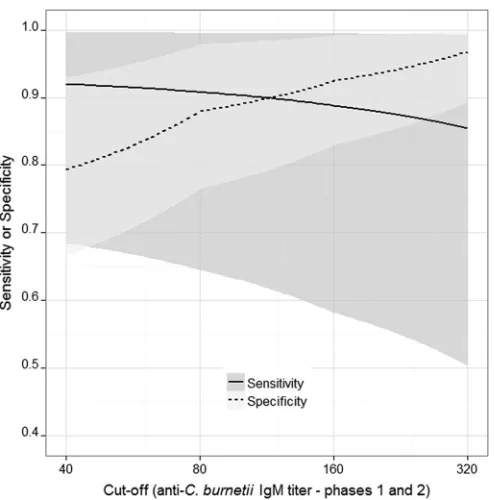
Compared to the modELISA results, the highest specificity and
sensitivity (Youden’s index) of the IFA in detecting both IgM
phase 2 and 1 antibodies in goat sera were obtained at a cutoff titer
of 1:160 (
Fig. 3
). The IFA had a higher diagnostic sensitivity
(88.8%; 95% CI, 58.2, 99.5) for IgM (phase 1 and phase 2)
anti-bodies than the modELISA (71.7%; 95% CI, 46.3, 92.8) at the
1:160 cutoff titer. Bayesian estimates of the specificity and
sensi-tivity for the IFA and modELISA, and prior probability
distribu-tions, are also presented in
Table 4
. The comparison between the
IFA and modELISA showed less agreement beyond chance (
K
)
than the comparison between the IFA and IDEXX ELISA (for IgG)
(
Table 4
). Given the relatively low animal-level prevalence of IgM
antibodies, PABAK was a more appropriate measure and
esti-mated higher agreement values than
K
.
Comparison of the performances of the IFA, CFT, and ELISA
in detecting antibodies to
C. burnetii
.
The ELISA (IDEXX and
modELISA) had significantly higher diagnostic sensitivities than
the IFA for IgG (78.1%; 95% CI, 59.7, 94.9) and IgM (79.6%; 95%
CI, 56.6, 94.8) antibodies against phase 2
C. burnetii
compared to
IgG (71.5%; 95% CI, 53.9, 92.5) and IgM (71.7%; 95% CI, 46.0,
92.8) against phase 1
C. burnetii
(see Table S3 in the supplemental
material). The IFA was more sensitive (84.5%; 95% CI, 54.4, 98.7)
than the CFT (29.8%; 95% CI, 17.0, 44.8) in detecting IgG and
IgM antibodies to phase 2 at the 1:160 cutoff (
Table 4
). Bayesian
estimates of the specificities and sensitivities as well as prior
dis-tributions, prevalence estimates, and levels of agreement between
the IFA and CFT are presented in
Table 4
.
Estimates of sensitivity and specificity of the IFA versus the
ELISA and the IFA versus the CFT as well as the IFA versus
mod-ELISA on the basis of vague prior probability distributions are
presented as additional material (see Table S4 in the supplemental
material). The use of flat priors resulted in diagnostic sensitivity
results for the IFA (65.4%; 95% CI, 21.8, 95.6) and modELISA
(64.7%; 95% CI, 33.2, 90.1) for IgM antibodies that were
signifi-cantly lower than the sensitivity estimates obtained using
pub-lished priors (
Table 4
). The diagnostic specifications (sensitivity
and specificity) of all other tests were highly comparable
irrespec-tive of whether flat or informairrespec-tive priors were utilized.
FIG 1The number of samples at different antibody titers that produced the same results when tested with the indirect immunofluorescence assay, 3 months later. The black bars (Rep) show the number of samples with same results, while the white bars (Tot) represent the total number of samples re-tested. T, antibody titer.
TABLE 3Comparison of the indirect immunofluorescence assay, CFT (Serion Virion), and ELISA (IDEXX) in detecting IgG antibodies toC. burnetiiin 96 goat serum samples at the optimum cutoff of 1:160 for the IFA as estimated with Bayesian latent class analysisa
Sample category
No. of samples
ELISA⫹ ELISA⫺ CFT⫹ CFT⫺
IFA⫹ 22 14 12 24
IFA⫺ 1 59 0 60
ELISA⫹ 10 13
ELISA⫺ 2 71
a⫹
, positive;⫺, negative; IFA, indirect immunofluorescence assay. All samples from New Zealand (declaredC. burnetii-free by the OIE) tested negative in all three tests.
FIG 2Bayesian estimates of the diagnostic sensitivity and specificity of theC. burnetiiIFA at different cutoff titers in goat sera compared to the sensitivity and specificity of the IDEXX ELISA. Shading represents 95% confidence intervals; the solid line (representing the sensitivity of the IFA) crosses the dashed line (repre-senting the specificity of the IFA) at the dilution where the highest Youden index (best combined sensitivity and specificity of the IFA) is obtained.
on August 17, 2020 by guest
http://cvi.asm.org/
DISCUSSION
The CFT is still widely used for the serological detection of
C.
burnetii
in animals despite its poor sensitivity (
31
,
32
), possibly
because it is the only test that has been fully validated and
stan-dardized for use in detecting antibodies to
C. burnetii
in animals
across different laboratories worldwide. We have adapted and
val-idated the highly sensitive and specific human IFA for use in
sero-logical diagnosis of coxiellosis in goats. We have also generated
diagnostic sensitivity and specificity estimates of the test for
de-tecting IgG and IgM antibodies to phase 1 and phase 2
C. burnetii
antigens.
Unlike the CFT, the IFA can be used to distinguish IgG
anti-bodies from IgM antianti-bodies to phase 1 and phase 2
C. burnetii
, an
attribute that has been used to differentiate recent infections from
past exposure in humans (
23
,
24
). Our validated IFA could
poten-tially also be used in veterinary diagnostics to differentiate recent
infections from chronic infections in infected goat herds to assist
with outbreak investigations or to establish freedom from
C.
bur-netii
infection. We have also produced diagnostic sensitivity and
specificity estimates of the IFA based on its performance in
sam-ples from infected and disease-free populations.
The finding of the higher sensitivity of the IFA than of the
ELISA for detection of antibodies against
C. burnetii
in goat serum
obtained in this study is similar to what has been previously
pub-lished for human Q fever serology (
33
,
34
). There have also been
reports of low sensitivity to IgG phase 2 antibodies in ELISA kits
coated with mixed (both phase 1 and phase 2) antigens (
53
). A
study done to compare the performances of three ELISA kits
(mixed antigen, phase 1, and phase 2) in detecting antibodies
against
C. burnetii
in cattle sera resulted in reports of poor
perfor-mance of the mixed-antigen ELISA compared to that of the phase
1 and phase 2 ELISA (
53
). This “mixed-antigen effect” could
ex-plain the lower sensitivity of the ELISA than of the IFA in detecting
IgG antibodies observed in our study (
Table 4
). We also observed
that the ELISA was more sensitive to IgG antibodies against phase
2 antigen than against phase 1, which could possibly be a result of
the type of antigen used in that kit.
None of the commercially available tests were able to separately
quantify IgM antibodies in goat sera; the IDEXX ELISA measures
only IgG antibodies, and the CFT titers represent a combination of
IgG and IgM antibodies. Our validated IFA, which provides
spec-ificity and sensitivity estimates for detecting IgM antibodies to
phase 1 and phase 2
C. burnetii
antigens, is a novel test for
veteri-nary diagnostics. The sensitivity of the modELISA for detection of
IgM antibodies is comparable to the sensitivity of the IDEXX
ELISA for detection of IgG antibodies, which is possibly because the
modELISA and the IDEXX ELISA contain the same antigen, “mixed
phase 2 and phase 1
C. burnetii
.” The estimates of lower sensitivity of
the ELISA and IFA for detection of IgM antibodies obtained using
“flat” priors could possibly be due to low prevalence of IgM
antibod-ies in the samples used for this study, a scenario that has been reported
previously in human diagnostics (
33
).
The low sensitivity of the CFT obtained in our study is similar
to what has been reported in other studies; it can be explained by
the fact that, in ruminants, only IgG1 antibodies fix complement
and the presence of IgG2 and IgM antibody types inhibits IgG1
TABLE 4Bayesian estimates of diagnostic sensitivity and specificity of the IFA in comparison to the ELISA (IDEXX) in detection of IgG and IgM antibodies toC. burnetiiat a 1:160 dilution of goat seruma
Antibody type(s) Test
% sensitivity (95% PI)
% specificity (95% PI)
% prevalence 1 (95% PI)
% prevalence 2 (95% PI)
% agreementb
(95% PI) Kb(95% PI)
PABAKb (95% PI) IgG phases 1⫹2 IFA 94.8 (80.3, 99.6) 92.5 (77.1, 99.3) 40.4 (26.0, 53.6) 0.00 (0.00, 1.20) 81.1 (72.7, 88.0) 0.60 (0.43, 0.74) 0.62 (0.45, 0.76)
ELISA 70.1 (52.7, 91.0) 96.2 (88.9, 99.2)
IgM phases 1⫹2 IFA 88.8 (58.2, 99.5) 92.4 (83.0, 99.2) 16.0 (8.6, 25.4) 0.00 (0.00, 1.20) 73.5 (64.5, 81.1) 0.27 (0.09, 0.45) 0.47 (0.29, 0.62) modELISA 71.7 (46.3, 92.8) 80.7 (71.2, 89.8)
Phase 2 only (IgM/IgG)
IFA 84.5 (54.4, 98.7) 94.4 (79.8, 99.5) 41.4 (26.0, 63.7) 0.00 (0.00, 1.30) 71.4 (62.2, 79.1) 0.30 (0.16, 0.46) 0.43 (0.24, 0.58) CFT 29.8 (17.0, 44.8) 96.8 (89.2, 99.5)
aIFA, immunofluorescence assay; PI, predictive interval; PABAK, prevalence- and bias-adjustedK; modELISA, modified IDEXX ELISA. Prevalence 1 data represent estimated
animal-level true prevalences in samples from a known infected herd. Prevalence 2 data represent estimated animal-level true prevalences in samples from New Zealand. Agreement data represent proportions of agreement.Kdata represent Cohen’s kappa values.
b
Data represent estimates and include results from negative controls from New Zealand (declaredC. burnetii-free by the OIE).
FIG 3Diagnostic sensitivity and specificity of theC. burnetiiIFA at different cutoff titers estimated using Bayesian latent class analysis for goat sera com-pared to the sensitivity and specificity of the modified IgM ELISA. Shading represents 95% confidence intervals; the solid line (representing the sensitivity of the IFA) crosses the dashed line (representing the specificity of the IFA) at the dilution where the highest Youden index (best combined sensitivity and specificity of the IFA) is obtained.
on August 17, 2020 by guest
http://cvi.asm.org/
from fixing complement (
32
,
54
,
55
). The CFT is thus likely to
result in many false-negative sample results, which make the test
unsuitable for estimating prevalences and identifying exposed or
infected ruminants. However, due to its high specificity and the
fact that it is not species specific, the CFT is still useful for
identi-fying infected herds and declaring herds to be free of disease.
However, a larger sample size would be required because of the
low sensitivity of the CFT. This low sensitivity explains why the
agreement between the CFT and the highly sensitive IFA was only
fair (
K
⫽
0.30), with only 13% of the samples positive for both
tests at a 1:160 serum dilution (
Table 3
).
Accumulated evidence shows that New Zealand is free of Q
fever (
27
,
56
,
57
). Therefore, any fluorescence observed in New
Zealand samples was considered representative of false
fluores-cence. The negative-control samples showed no fluorescence at a
1:160 serum dilution, which was used as a cutoff titer for absolute
positivity. Our Bayesian latent class model also produced the
highest Youden’s index at 1:160 for both IgG and IgM, which
reinforces the idea of the reliability of a cutoff titer value of 160. All
samples with end titer values below 160 were treated as
represen-tative of negative results. Furthermore, the high kappa coefficient
(
Table 2
) and the high observed proportion of agreement (95.5%)
between the readings of the two technicians (
45
) confirmed that
there was limited human bias in the readings. This is important, as
evaluation of IFA results is a subjective process and may require
the operator to differentiate background fluorescence from true
fluorescence. Much of the disagreement occurred at dilutions
close to the endpoint titer where weakly positive titers were
clas-sified as negative by either of the technicians.
All samples had almost perfect repeatability over time (
Fig. 1
)
for detection of antibodies against IgG phase 1 and phase 2
C.
burnetii
. Most of the poor repeatability results were for IgM titers,
which were generally low, between 0 and 160, in the tested
popu-lation. These low titers were difficult to distinguish from those
seen with the negative controls, which also had background
fluo-rescence at these titers. This further supports the use of 1:160 as a
reliable cutoff titer for determining a true positive result and
sug-gests that the IFA is unreliable for detecting
C. burnetii
antibody
titers below 1:160 in goat sera.
By providing sensitivity and specificity estimates of three
sero-logical tests used in Q fever diagnostics, our results are a yardstick
for the serological diagnosis of coxiellosis in goats. The IFA is
highly sensitive and specific and should be used as a reference
diagnostic test for coxiellosis in goats and other livestock.
Further-more, the ability of the IFA to differentiate IgG and IgM
antibod-ies could be a useful tool in identifying recently infected animals
and associated risk factors for infection as well as for designing
C.
burnetii
disease control programs in goat herds. On the other
hand, the ELISA is easier to perform and may be the quickest way
to test high numbers of samples, while the high specificity of the
CFT makes it suitable as a confirmatory test for samples that tested
positive in other tests. However, because of its low diagnostic
sen-sitivity, the CFT is likely to give unreliable estimates of prevalences
of
C. burnetii
antibodies in goats and other livestock.
ACKNOWLEDGMENTS
We acknowledge the technical support of staff at the Australian Rickettsial Reference Laboratory in Geelong, Department of Economic Develop-ment, Jobs, Transport and Resources, of staff that undertook the CFT testing and management, and of staff of the farm where samples were
obtained as well as Magda Dunowska from Massey University, New Zea-land, for supply of known negative samples. This research also received computational support from the Victorian Life Sciences Computation Initiative (VLSCI) at its Peak Computing Facility at the University of Melbourne, an initiative of the Victorian Government, Australia.
We declare that we have no conflicts of interest.
REFERENCES
1.Raoult D, Marrie T, Mege J.2005. Natural history and pathophysiology of Q fever. Lancet Infect Dis5:219 –226.http://dx.doi.org/10.1016/S1473 -3099(05)70052-9.
2.Berri M, Rousset E, Champion JL, Russo P, Rodolakis A.2007. Goats may experience reproductive failures and shedCoxiella burnetiiat two successive parturitions after a Q fever infection. Res Vet Sci83:47–52. http://dx.doi.org/10.1016/j.rvsc.2006.11.001.
3.Rousset E, Berri M, Durand B, Dufour P, Prigent M, Delcroix T, Touratier A, Rodolakis A.2009.Coxiella burnetiishedding routes and antibody response after outbreaks of Q fever-induced abortion in dairy goat herds. Appl Environ Microbiol 75:428 – 433.http://dx.doi.org/10 .1128/AEM.00690-08.
4.Sánchez J, Souriau A, Buendía AJ, Arricau-Bouvery N, Martínez CM, Salinas J, Rodolakis A, Navarro JA.2006. ExperimentalCoxiella burnetii infection in pregnant goats: a histopathological and immunohistochemi-cal study. J Comp Pathol135:108 –115.http://dx.doi.org/10.1016/j.jcpa .2006.06.003.
5.Arricau Bouvery N, Souriau A, Lechopier P, Rodolakis A.2003. Exper-imentalCoxiella burnetiiinfection in pregnant goats: excretion routes. Vet Res34:423– 433.http://dx.doi.org/10.1051/vetres:2003017.
6.Arricau-Bouvery N, Rodolakis A. 2005. Is Q fever an emerging or re-emerging zoonosis? Vet Res36:327–349.http://dx.doi.org/10.1051 /vetres:2005010.
7.Woldehiwet Z.2004. Q fever (coxiellosis): epidemiology and pathogene-sis. Res Vet Sci77:93–100.http://dx.doi.org/10.1016/j.rvsc.2003.09.001. 8.van Moll P, Baumgartner W, Eskens U, Hanichen T.1993.
Immuno-chemical demonstration ofCoxiella burnetiiantigen in the fetal placenta of naturally infected sheep and cattle. J Comp Pathol109:295–301.http://dx .doi.org/10.1016/S0021-9975(08)80254-X.
9.Rodolakis A, Berri M, Héchard C, Caudron C, Souriau A, Bodier C, Blanchard B, Camuset P, Devillechaise P, Natorp J.2007. Comparison ofCoxiella burnetiishedding in milk of dairy bovine, caprine, and ovine herds. J Dairy Sci90:5352–5360.http://dx.doi.org/10.3168/jds.2006-815. 10. Roest H, Ruuls RC, Tilburg J, Nabuurs-Franssen MH, Klaassen C, Vellema P, van den Brom R, Dercksen D, Wouda W, Spierenburg M.
2011. Molecular epidemiology ofCoxiella burnetiifrom ruminants in Q fever outbreak, the Netherlands. Emerg Infect Dis17:668 – 675.http://dx .doi.org/10.3201/eid1704.101562.
11. Lyytikäinen O, Ziese T, Schwartländer B, Matzdorff P, Kuhnhen C, Jäger C, Petersen L.1998. An outbreak of sheep-associated Q fever in a rural community in Germany. Eur J Epidemiol14:193–199.http://dx.doi .org/10.1023/A:1007452503863.
12. Eibach R, Bothe F, Runge M, Fischer SF, Philipp W, Ganter M.2012. Q fever: baseline monitoring of a sheep and a goat flock associated with human infections. Epidemiol Infect140:1939 –1949.http://dx.doi.org/10 .1017/S0950268811002846.
13. van der Hoek W, Dijkstra F, Schimmer B, Schneeberger P, Vellema P, Wijkmans C, Ter Schegget R, Hackert V, Van Duynhoven Y.2010. Q fever in the Netherlands: an update on the epidemiology and control measures. Euro Surveill 15:19520. http://www.eurosurveillance.org /ViewArticle.aspx?ArticleId⫽19520.
14. Dijkstra F, Hoek W, Wijers N, Schimmer B, Rietveld A, Wijkmans CJ, Vellema P, Schneeberger PM.2012. The 2007-2010 Q fever epidemic in the Netherlands:Coxiella burnetiicharacteristics of notified acute Q fever patients and the association with dairy goat farming. FEMS Immunol Med Microbiol64:3–12.http://dx.doi.org/10.1111/j.1574-695X.2011.00876.x. 15. Guatteo R, Beaudeau F, Berri M, Rodolakis A, Joly A, Seegers H.2006. Shedding routes of in dairy cows: implications for detection and control. Vet Res37:827– 833.http://dx.doi.org/10.1051/vetres:2006038. 16. Kazar J.2005. Coxiella burnetii infection. Ann N Y Acad Sci1063:105–
114.http://dx.doi.org/10.1196/annals.1355.018.
17. Porter SR, Czaplicki G, Mainil J, Guatteo R, Saegerman C.2011. Q fever: current state of knowledge and perspectives of research of a ne-glected zoonosis. Int J Microbiol2011:248418.
on August 17, 2020 by guest
http://cvi.asm.org/
18. Million M, Bellevegue L, Labussiere A-S, Dekel M, Ferry T, Deroche P, Socolovschi C, Camillerri S, Raoult D.22 March 2014. Culture-negative prosthetic joint arthritis related toCoxiella burnetii. Am J Medhttp://dx .doi.org/10.1016/j.amjmed.2014.03.013.
19. Malou N, Renvoise A, Nappez C, Raoult D.2012. Immuno-PCR for the early serological diagnosis of acute infectious diseases: the Q fever para-digm. Eur J Clin Microbiol Infect Dis31:1951–1960.http://dx.doi.org/10 .1007/s10096-011-1526-1.
20. Behymer D, Biberstein E, Riemann H, Franti C, Sawyer M.1975. Q fever (Coxiella burnetii) investigations in dairy cattle: persistence of anti-bodies after vaccination. Am J Vet Res36:781–784.
21. Teunis PFM, Schimmer B, Notermans DW, Leenders ACAP, Wever PC, Kretzschmar MEE, Schneeberger PM.2013. Time-course of anti-body responses againstCoxiella burnetiifollowing acute Q fever. Epide-miol Infect141:62–73.http://dx.doi.org/10.1017/S0950268812000404. 22. Roest H, Post J, van Gelderen B, van Zijderveld FG, Rebel J.2013. Q
fever in pregnant goats: humoral and cellular immune responses. Vet Res
44:67.http://dx.doi.org/10.1186/1297-9716-44-67.
23. Delsing CE, Warris A, Bleeker-Rovers CP.2011. Q fever: still more queries than answers. Adv Exp Med Biol719:133–143.http://dx.doi.org /10.1007/978-1-4614-0204-6_12.
24. Cutler SJ, Bouzid M, Cutler RR.2007. Q fever. J Infect 54:313–318. http://dx.doi.org/10.1016/j.jinf.2006.10.048.
25. Wielders C, Wijnbergen P, Renders N, Schellekens J, Schneeberger P, Wever P, Hermans M.2013. HighCoxiella burnetiiDNA load in serum during acute Q fever is associated with progression to a serologic profile indicative of chronic Q fever. J Clin Microbiol51:3192–3198.http://dx.doi .org/10.1128/JCM.00993-13.
26. Roest HJ, van Gelderen B, Dinkla A, Frangoulidis D, van Zijderveld F, Rebel J, van Keulen L.9 November 2012. Q fever in pregnant goats: pathogenesis and excretion ofCoxiella burnetii. PLoS Onehttp://dx.doi .org/10.1371/journal.pone.0048949.
27. Fournier P-E, Marrie JT, Raoult D.1998. Diagnosis of Q fever. J Clin Microbiol36:1823–1834.
28. Field PR, Mitchell JL, Santiago A, Dickeson DJ, Chan S-W, Ho DW, Murphy AM, Cuzzubbo AJ, Devine PL.2000. Comparison of a com-mercial enzyme-linked immunosorbent assay with immunofluorescence and complement fixation tests for detection ofCoxiella burnetii(Q fever) immunoglobulin M. J Clin Microbiol38:1645–1647.
29. Berri M, Laroucau K, Rodolakis A. 2000. The detection of Coxiella burnetiifrom ovine genital swabs, milk and fecal samples by the use of a single touchdown polymerase chain reaction. Vet Microbiol72:285–293. http://dx.doi.org/10.1016/S0378-1135(99)00178-9.
30. Emery MP, Ostlund EN, Schmitt BJ. 2012. Comparison of Q fever serology methods in cattle, goats, and sheep. J Vet Diagn Invest24:379 – 382.http://dx.doi.org/10.1177/1040638711434943.
31. World Organisation for Animal Health (OIE).2010. Q fever, p 1–13.In Manual of diagnostic tests and vaccines for terrestrialanimals, 2010 ed. OIE, Paris, France.
32. Rousset E, Durand B, Berri M, Dufour P, Prigent M, Russo P, Delcroix T, Touratier A, Rodolakis A, Aubert M.2007. Comparative diagnostic potential of three serological tests for abortive Q fever in goat herds. Vet Microbiol124:286 –297.http://dx.doi.org/10.1016/j.vetmic.2007.04.033. 33. Meekelenkamp J, Schneeberger P, Wever P, Leenders A.2012.
Com-parison of ELISA and indirect immunofluorescent antibody assay detect-ingCoxiella burnetiiIgM phase II for the diagnosis of acute Q fever. Eur J Clin Microbiol Infect Dis 31:1267–1270. http://dx.doi.org/10.1007 /s10096-011-1438-0.
34. Slabá K, Skultéty L, Toman R..2005. Efficiency of various serological techniques for diagnosingCoxiella burnetiiinfection. Acta Virol49:123– 127.
35. Natale A, Bucci G, Capello K, Barberio A, Tavella A, Nardelli S, Marangon S, Ceglie L.2012. Old and new diagnostic approaches for Q fever diagnosis: correlation among serological (CFT, ELISA) and molec-ular analyses. Comp Immunol Microbiol Infect Dis35:375–379.http://dx .doi.org/10.1016/j.cimid.2012.03.002.
36. Mars J, Wibberley G, Sting R, Henning K, Horner GW, Garnett KM, Hannah MJ, Jenner JA, Piggott CJ, O’Keefe JS.2009. Comparison of the Q-fever complement fixation test and two commercial enzyme-linked im-munosorbent assays for the detection of serum antibodies againstCoxiella burnetii(Q-fever) in ruminants: Recommendations for use of serological tests on imported animals in New Zealand. N Z Vet J57:262–268.http: //dx.doi.org/10.1080/00480169.2009.58619.
37. Niemczuk K, Szyman´ska-Czerwin´ska M, S´mietanka K, Bocian Ł.2014. Comparison of diagnostic potential of serological, molecular and cell cul-ture methods for detection of Q fever in ruminants. Vet Microbiol171:
147–152.http://dx.doi.org/10.1016/j.vetmic.2014.03.015.
38. World Organization for Animal Health (OIE). 2013. OIE terrestrial manual 2013.InOIE (ed), Proceedings of the World Assembly of Dele-gates of the OIE. OIE, Paris, France.
39. Pepe MS, Janes H.2007. Insights into latent class analysis of diagnostic test performance. Biostatistics 8:474 – 484. http://dx.doi.org/10.1093 /biostatistics/kxl038.
40. Islam A, Lockhart M, Stenos J, Graves S.2013. The attenuated Nine Mile phase II clone 4/RSA439 strain ofCoxiella burnetiiis highly virulent for severe combined immunodeficient (SCID) mice. Am J Trop Med Hyg
89:800 – 803.http://dx.doi.org/10.4269/ajtmh.12-0653.
41. Fafetine J, Neves L, Thompson PN, Paweska JT, Rutten VP, Coetzer JA.
2013. Serological evidence of Rift Valley fever virus circulation in sheep and goats in Zambezia Province, Mozambique. PLoS Negl Trop Dis
7:e2065.http://dx.doi.org/10.1371/journal.pntd.0002065.
42. Bond KA, Vincent G, Wilks CR, Franklin L, Sutton B, Stenos J, Cowan R, Lim K, Athan E, Harris O, Macfarlane-Berry L, Segal Y, Firestone SM.23 October 2015. One Health approach to controlling a Q fever outbreak on an Australian goat farm. Epidemiol Infecthttp://dx.doi.org /10.1017/S0950268815002368.
43. TDR Diagnostics Evaluation Expert Panel, Banoo S, Bell D, Bossuyt P, Herring A, Mabey D, Poole F, Smith PG, Sriram N, Wongsrichanalai C, Linke R, O’Brien R, Perkins M.2008. Evaluation of diagnostic tests for infectious diseases: general principles. Nat Rev Microbiol6(11 Suppl):
S16 –S26.
44. Watson P, Petrie A.2010. Method agreement analysis: a review of correct methodology. Theriogenology73:1167–1179.http://dx.doi.org/10.1016/j .theriogenology.2010.01.003.
45. Sim J, Wright CC.2005. The kappa statistic in reliability studies: use, interpretation, and sample size requirements. Phys Ther85:257–268. 46. Branscum A, Gardner I, Johnson W.2005. Estimation of diagnostic-test
sensitivity and specificity through Bayesian modeling. Prev Vet Med68:
145–163.http://dx.doi.org/10.1016/j.prevetmed.2004.12.005.
47. McV Messam LL, Branscum AJ, Collins MT, Gardner IA.2008. Fre-quentist and Bayesian approaches to prevalence estimation using exam-ples from Johne’s disease. Anim Health Res Rev9:1–23.http://dx.doi.org /10.1017/S1466252307001314.
48. Horigan MW, Bell MM, Pollard TR, Sayers AR, Pritchard GC.2011. Q fever diagnosis in domestic ruminants: comparison between complement fixation and commercial enzyme-linked immunosorbent assays. J Vet Di-agn Invest23:924 –931.http://dx.doi.org/10.1177/1040638711416971. 49. Lunn DJ, Thomas A, Best N, Spiegelhalter D. 2000. WinBUGS—a
Bayesian modelling framework: concepts, structure, and extensibility. Stat Comput10:325–337.http://dx.doi.org/10.1023/A:1008929526011. 50. Sturtz S, Ligges U, Gelman A.2005. R2WinBUGS: a package for running
WinBUGS from R. J Stat Softw12(3):1–16.
51. Team RC.2014. R: the R Project for Statistical Computing.http://www .R-project.org. Accessed 14 July 2015.
52. Stevenson M, Nunes T, Heuer C, Marshall J, Sanchez J, Thornton R, Reiczigel J, Robison-Cox J, Sebastiani P, Solymos P, Yoshida K, Jones G, Pirikahu S, Firestone S, Kyle R.2015. epiR: tools for the analysis of epidemiological data.http://cran.r-project.org/web/packages/epiR/index .html. Accessed 14 July 2015.
53. Böttcher J, Vossen A, Janowetz B, Alex M, Gangl A, Randt A, Meier N.
2011. Insights into the dynamics of endemicCoxiella burnetiiinfection in cattle by application of phase-specific ELISAs in an infected dairy herd. Vet Microbiol 151:291–300. http://dx.doi.org/10.1016/j.vetmic.2011.03 .007.
54. Schmeer N, Müller P, Langel J, Krauss H, Frost JW, Wieda J.1987. Q fever vaccines for animals. Zentralbl Bakteriol Mikrobiol Hyg A
267:79 – 88.
55. Biberstein EL, Riemann HP, Franti CE, Behymer DE, Ruppanner R, Bushnell R, Crenshaw G.1977. Vaccination of dairy cattle against Q fever (Coxiella burnetii): results of field trials. Am J Vet Res38:189 –193. 56. Hilbink F, Penrose M, Kovacova E, Kazar J.1993. Q fever is absent from
New Zealand. Int J Epidemiol22:945–949.http://dx.doi.org/10.1093/ije /22.5.945.
57. Maurin M, Raoult D.1999. Q fever. Clin Microbiol Rev12:518 –553.