Scholarship@Western
Scholarship@Western
Electronic Thesis and Dissertation Repository
7-13-2015 12:00 AM
Contribution of the dorsolateral prefrontal cortex to attentional
Contribution of the dorsolateral prefrontal cortex to attentional
and mnemonic processes in visual search
and mnemonic processes in visual search
Brandon BelbeckThe University of Western Ontario
Supervisor
Dr. Kevin Johnston
The University of Western Ontario Graduate Program in Neuroscience
A thesis submitted in partial fulfillment of the requirements for the degree in Master of Science © Brandon Belbeck 2015
Follow this and additional works at: https://ir.lib.uwo.ca/etd
Part of the Behavioral Neurobiology Commons, Cognitive Neuroscience Commons, and the
Neurosciences Commons
Recommended Citation Recommended Citation
Belbeck, Brandon, "Contribution of the dorsolateral prefrontal cortex to attentional and mnemonic processes in visual search" (2015). Electronic Thesis and Dissertation Repository. 2939.
https://ir.lib.uwo.ca/etd/2939
This Dissertation/Thesis is brought to you for free and open access by Scholarship@Western. It has been accepted for inclusion in Electronic Thesis and Dissertation Repository by an authorized administrator of
CONTRIBUTION OF THE DORSOLATERAL PREFRONTAL CORTEX TO ATTENTIONAL AND MNEMONIC PROCESSES
IN VISUAL SEARCH
(Thesis Format: Monograph)
by
Brandon Belbeck
Graduate Program in Neuroscience
A thesis submitted in partial fulfillment of the requirements for the degree of
Master of Neuroscience
The School of Graduate and Postdoctoral Studies The University of Western Ontario
London, Ontario, Canada
ii
Abstract
A key characteristic of selective visual attention is that it may be deployed on the basis of
our knowledge or goals of the task at hand. Here, we used cryogenic deactivation to
investigate the contribution of the dorsolateral PFC to cognitive flexibility and working
memory, as well as their relation to the deployment of attention. Macaque monkeys
performed visual search tasks requiring them to foveate a target in an array of stimuli.
These included a feature search, a constant-target conjunction search, a variable-target
search and variable-target with delay search task, with each being more cognitively
demanding than the last. Bilateral deactivation of the DLPFC during more demanding
tasks resulted in increased reaction time and decreased accuracy. These effects on visual
search performance suggest that the DLPFC is involved in the deployment of attention to
a target, and also contributes to the flexible and mnemonic processes needed when task
demands increase.
Keywords
DLPFC, visual search, working memory, task-set reconfiguration, behavioural flexibility,
iii
Co-Authorship Statement
Dr. Kevin Johnston was the principal investigator and supervisor for the study described
in this thesis. Dr. Johnston conceived and designed the visual search paradigms used in
this thesis. Dr. Johnston wrote the code for the behavioural data analysis, though I was
iv
Acknowledgments
First and foremost, I would like to sincerely thank my supervisor Dr. Kevin Johnston for
his tremendous effort, direction, and dedication in assisting me with everything from data
collection to writing. I would also like to thank my co-supervisor Dr. Stefan Everling for
his oversight and guidance, and my advisor committee including Dr. Steve Lomber, Dr.
Brian Corneil and Dr. Paul Gribble. None of this would have been possible without the
devoted animal care staff monitoring the welfare of my animals, including the animal care
technician Darren Pitre and the lab veterinarian technicians Nicole Hague, Kat Faubert
and Ashley Kirley. Lastly, the support of all the Johnston, Everling and Corneil lab
members made for a great working environment. This work was supported by a Natural
Sciences and Engineering Council of Canada Alexander Graham Bell Canadian Graduate
Scholarship awarded to myself, a Natural Sciences and Engineering Council of Canada
Discovery Grant to Dr. Kevin Johnston, and a Canadian Institutes of Health Research
v
Table of Contents
Abstract ... ii
Co-Authorship Statement ... iii
Acknowledgments ... iv
Table of Contents ... v
List of Tables ... vi
List of Figures ... vii
Intoduction ... 1
Materials and Methods ... 18
Results ... 29
Discussion ... 39
References ... 59
vi
List of Tables
vii
List of Figures
Figure 1. Neuronal activity during target selection.. ... 10
Figure 2. The visual priority map.. ... 11
Figure 3. Cryoloop placement in the macaque prefrontal cortex.. ... 19
Figure 4. Behavioural search paradigms.. ... 23
Figure 5. Cortical cooling timeline.. ... 27
Figure 6. Reversible cryogenic deactivation. ... 28
Figure 7. Performance on the feature search task. ... 34
Figure 8. Performance on the constant-target conjunction search task. ... 35
Figure 9. Performance on the variable-target conjunction search task.. ... 36
Figure 10. Performance on the variable-target with delay conjunction search task. ... 37
Figure 11. Possible mechanisms of increased saccadic reaction time during cooling. ... 53
Introduction
Imagine you are looking at playing cards spread face up on a table, and your goal is to
find the Queen of Spades. Although all of the cards are in plain view, searching from one
card to the next is necessary to locate the correct one. Looking for this card is an example
of a conjunction search in which two features define the target, in this case the value of
the card and the suit. To narrow our search we can direct our attention to relevant target
features, such as to all cards that are Queens or all cards that are Spades. We can end our
search and identify the target card when what we are looking at is a Spade and also a
Queen, thus matching the features we were searching for, and correctly identifying the
Queen of Spades. This is the process of selective visual attention.
A prerequisite for successful visual behaviour is the ability to selectively attend to
relevant stimuli, while ignoring irrelevant ones. Attention is the process of filtering
irrelevant information to focus on more behaviourally relevant information. Given the
inherent demand for processing resources, the visual system cannot fully process the
entirety of the visual field (Tsotsos 1990). As a result of this demand, only a small area of
the visual field can be processed to higher order brain areas (Wolfe 1994). This area of
the visual field from which information is further processed comes from the
high-resolution area of the retina, the fovea. Foveal vision occupies only about 1% of our
visual field but already a much larger amount (up to 50%) in our primary visual cortex
(Horton and Hoyt 1991). Since the majority of our visual information comes from foveal
input, relocating the fovea to relevant stimulus locations is essential, and thus movements
processing (Findlay 2009). The most common type of eye movement is called a saccade,
which is a fast ballistic movement of the eye to redirect the fovea to a new location
(Gilchrist 2011). When scanning a visual scene, saccades (interrupted by fixations)
redirect our gaze up to several times a second and are crucial to gather more information
from the visual environment. Though this is typically how visual information is gathered,
attention can also be directed without movements of the eyes (covert attention; Posner
1980). Fixation on an object allows the image of that object to fall on the fovea for visual
information to be processed, while saccades continue to relocate our fovea to different
aspects of the scene.
Visual attention is understood to be deployed on the basis of both bottom-up and
top-down processes. Bottom-up processes consist of the distinctiveness of particular
stimuli in the environment, while top-down processes comprise the knowledge and goals
of the observer (Wolfe 1994, Miller and Cohen 2001, Bundesen et al. 2005, Hamker
2006, Wolfe 2010). Stimuli that are salient or perceptually different compared to
neighbouring stimuli, seem to automatically draw our attention (Wolfe 1994). An item
containing a unique feature, such as colour, shape or a particular orientation, increasingly
draws our attention the greater the difference between it and objects around it. The role of
bottom-up attention can be demonstrated in searching for a target defined by a single
feature, known as a feature search. An example of this would be looking for a red
stimulus on a screen full of green stimuli. The oddball red stimulus is distinctive on the
screen, and the target can be located without prior knowledge of its features. Top-down
attention on the other hand involves directing attention towards objects of interest, and
locating a red stimulus among green ones can be driven by bottom-up attention, searching
for a target defined by multiple features requires prior knowledge. Searching for a target
defined by two features (such as colour and shape) is known a conjunction search, such as
a red square among red and green squares and circles. The target now shares features with
the distractors, as a red square would be the same colour as a red circle distractor, and the
same shape as a green square distractor. Since all stimuli in a conjunction search are
perceptually similar, one must know what the target is in order to find it, which is similar
to locating the Queen of Spades in a pile of cards. This prior knowledge can be in the
form of a memory representation of the target following instruction (Bichot and Schall
1999b), or can be drawn upon given verbal direction (Yarbus 1967). Prior knowledge can
also be used to override bottom-up attentional processes during search for a single unique
stimulus (Bichot et al. 1996). This demonstrates that in addition to being driven by
bottom-up processes, attention can also be allocated using top-down control.
Eye movements facilitate more detailed visual processing and may thus be
considered an overt form of selective visual attention (Findlay & Gilchrist 2003, Findlay
2009). While covert attention can direct attention without deploying an eye movement, an
eye movement cannot be directed to one location while attention is directed to another
(Deubel and Schneider 1996, Hoffman and Subramaniam 1995, Findlay & Gilchrist
2003). The fundamentals of this obligatory relationship between eye movements and
attention, however, are somewhat debatable (see review, Smith and Schenk 2012). The
premotor theory of attention proposes that attention is actually a consequence of the
motor preparation for an eye movement (Rizzolatti et al. 1987), which can result in
1995). As demonstrated earlier, eye movements are crucial to gathering more information
about the visual environment. Saccades help direct attention to different aspects of a
visual scene, while something that draws our attention in the visual field results in an
orienting saccade to place the fovea on it and examine this stimulus further. Enhanced
perceptual discrimination at the target location of the upcoming saccade demonstrates the
influence of eye movements on attention (Deubel and Schneider 1996); while attention
can also influence saccades, such as distracting stimuli affecting saccade latency (Walker
et al. 1997). The fact that eye movements and attention are so intertwined and attention is
potentially even a consequence of oculomotor system activation suggests the use of
similar neural substrates or mechanisms.
Visual search tasks have been used extensively to investigate the neural basis of
attention and cognitive processes related to the deployment of attention. In visual search
tasks, the object is to locate a target from among non-target distractors (for review, see
Wolfe 1998). Visual search paradigms can also be modified to investigate different
cognitive functions. For example, the identity of the target and distractors can be altered
to increase attentional demand. An example of a low-demand paradigm is a simple
feature search where the target is defined by a unique feature (e.g. colour), and where
attention can be guided to by way of bottom-up processes. In contrast, a conjunction
search is an example of a more demanding task. This is demonstrated when a target is
defined by a conjunction of features (e.g. colour and shape), in that the target not only
shares some of the features with the distractors, but is also perceptually similar as well.
As a result, top-down control using prior knowledge would now be needed to direct
(either defined by its features, or a picture-like representation) held as a target template to
assist with top-down attention. Another cognitive process that can be tested in visual
search is working memory. Working memory is the temporary retention of information to
guide future behaviour (Baddeley 1992). At the beginning of a visual search task, target
information (e.g. location, colour) can be briefly presented and subsequently followed by
a blank-screen delay in which the subject must hold this target information in working
memory. This information can then be used to guide attention to the target when the array
is presented (Chelazzi et al. 1998, Woodman et al. 2007). Working memory of target
location can also be tested by incorporating a delay after array presentation (Hasegawa et
al. 2000, Iba and Sawaguchi 2002). Lastly, changing the search target or having multiple
search targets in a visual search task can test cognitive or behavioural flexibility
(Horowitz and Wolfe 2001, Bichot and Schall 2002, Rossi et al. 2007, Woodman et al.
2007). Altering the search target on a trial-by-trial basis requires subjects to now direct
attention to the behavioural relevant stimulus using top-down control (Rossi et al. 2009).
This includes updating the target template to the current search target on each trial. The
target also may have been a distractor on the previous trial, making the task even more
demanding as erroneous saccades are made to distractors that were targets on the previous
day (Bichot and Schall 1999a).
Performance in visual search tasks is quantified by taking simple measurements,
most commonly reaction time and accuracy (Wolfe 1998). Reaction time—the time
between when the array is presented to the start of the saccade—is useful for determining
the processing time of target selection. Two of these processes include discrimination of
to distractors would take longer to identify, delaying this process and untimely delaying
the reaction time. The percentage of trials in which the fovea lands at the target location,
or the percentage of trials that a subject correctly identifies a search target as present in an
array, is known as accuracy. By assessing reaction time and accuracy on different search
paradigms, it can be determined how much the target stands out from distractors and
insight can be gathered as to whether bottom-up attention guides the fovea to the target,
or if it involves the direction of top-down attention. By making modifications to a visual
search paradigm, it is useful to test processes besides visual attention, including working
memory and cognitive flexibility (Wolfe 1994, Bundesen et al. 2005).
Though theories and models of attention are useful starting points, physiological
data is needed to constrain them. It is beneficial that human studies can uncover
functional areas underlying neural networks involved with attention and eye movements
(Corbetta et al. 1998), but more invasive studies are needed to determine the neural
mechanism of attention. This requires an appropriate animal model, the macaque monkey
(Macaca). One of the highlighting factors that make these animals such useful models is
that their brains are highly homologous to humans. This means that both macaque and
human brains have many shared, derived characteristics from a common ancestor. This
has been determined through cytoarchitecture studies examining cellular and brain layer
composition and connectivity studies showing the similarity of brain connections to
humans, in everywhere from the primary visual system to the prefrontal cortex (Kritzer
and Goldman-Rakic 1995, Preuss 2007, Wise 2008, Passingham 2009). Their
well-developed homologous visual system (Hubel and Wiesel 1977) and retinal similarity
processing. As rhesus macaques must orient their fovea in a similar manner to humans,
including a large oculomotor range and saccade amplitude, they have a well-developed
and well-studied oculomotor network. This network includes a number of interconnected
cortical and subcortical brain areas, including the frontal eye field (FEF), supplementary
eye field (SEF) and the lateral intraparietal area (LIP), all of which send projections to the
common output target superior colliculus (SC), a midbrain structure connected to saccade
motor generators (Selemon and Goldman-Rakic 1988, Johnston and Everling 2008,
Johnston and Everling 2011, Curtis 2011). Again, comparative cytoarchitecture and
functional MRI (fMRI) studies have determined homologues of these areas in the human
brain (Petrides and Pandya 1999, Koyama et al. 2004, Baker et al. 2006). In addition,
macaques’ eye-movement repertoire is also very similar to humans, with only slight
differences (Johnston & Everling 2008). As well, due to the oculomotor and saccade
similarity with humans, macaques can be trained to perform many of the same eye
movement tasks as humans. Single neuron recording in the awake macaque during eye
movement tasks has allowed the correlation of neural activity with behaviour to better
understand the neural basis of attention (e.g. Bisley and Goldberg 2003). By using the
rhesus macaque as a model, researchers can manipulate eye movement tasks to examine
many cognitive processes.
From comparative anatomical and neurophysiological studies of macaques
performing visual search tasks, a network of cortical and subcortical areas has been
shown to overlap with the oculomotor network, areas responsible for eye movements and
voluntary shifts in attention towards objects of interest. This network consists of several
LIP (Ipata et al. 2006, Thomas and Pare 2007) and the SC (Shen et al. 2011).
Neuroimaging studies have identified similar brain regions and corresponding areas of
activation in human participants, known as the dorsal frontoparietal attention network
(Corbetta et al. 1998, Corbetta & Shulman 2011). Single-unit neuronal recordings have
found neurons in these areas that exhibit activity consistent with the correct selection of a
target in visual search. Their activity profile is as follows: immediately following
presentation of the stimulus array, neurons that have a stimulus in their response field (the
location in the visual field that they represent) have an initial, indiscriminate increase in
activity (see Figure 1). Depending on whether this stimulus is a target or a distractor, the
neuron’s activity will subsequently be enhanced or attenuated, respectively (e.g. Schall
2002). Similar activity is seen throughout this network; the FEF, SC and area LIP (Schall
2002, Thomas and Pare 2007, Shen et al. 2011). The common idea is that all stimuli in
the visual environment compete for our attention, while only those neuron’s activity
representing stimuli that are behaviourally relevant are enhanced, and all others are
filtered out. Current theories of visual attention also propose the existence of a visual
priority map that represents all stimuli in our visual field (also referred to as a salience
map, see Figure 2; Olshausen et al. 1993, Wolfe 1994, Itti and Koch 2001, Bundesen et
al. 2005, Thompson and Bichot 2005, Fecteau and Munoz 2006, Hamker 2006, Bisley
and Goldberg 2010, Jerde and Curtis 2013). Each stimulus in this priority map is thought
to have an attentional weight assigned to it based on bottom-up factors (how unique it is)
and top-down factors (how behaviourally relevant it is). After each stimulus has been
assigned its attentional weight, the stimulus with the highest activation on the map is
chosen as the next target of selection in a winner-take-all approach. This map is thought
oculomotor network (Kusunoki et al. 2000, Schall 2002, Thompson and Bichot 2005,
Fecteau and Munoz 2006, Thomas and Pare 2007, Shen et al. 2011), and possibly the
pulvinar nucleus of the thalamus (Robinson and Petersen 1992, Bundesen et al. 2005).
Since there appears to be top-down neural modulation (enhancement and attenuation of
neural activity) based upon which stimuli are relevant, it is proposed that this represents
top-down control from a higher-order area requiring knowledge of the target and task
goals (Wolfe 1994, Miller & Cohen 2001, Bundesen et al. 2005, Hamker 2006). This area
is the prefrontal cortex (PFC), which is the region thought to be one of the main control
centers of the brain. To support this, human neuroimaging data also identified a frontal
region involved in attention besides the above noted oculomotor network, which is the
dorsolateral PFC (DLPFC; Corbetta et al. 1998).
The DLPFC is thought to have influence over much of the brain due to its unique
position and connections with important brain areas, and is thought to have involvement
with many cognitive processes related to attention. These include functions such as
attention, target selection, response suppression, decision making, task flexibility, and
working memory. Attention—specifically visual attention—is thought to be controlled by
the PFC (e.g. Hamker 2006). Cells in this area show filtering to spatially unattended
targets, and even neuronal enhancement to attended stimuli (Everling et al. 2002).
Lesions in macaques and human fMRI findings pinpointed the DLPFC as necessary on
visual tasks that required top-down attentional control (Rossi et al. 2009). Working
memory is a process that has been hallmarked by neural activity during a delay interval in
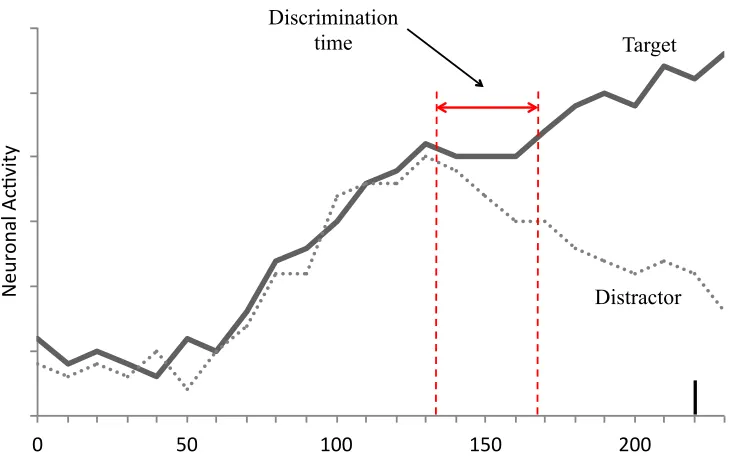
Figure 1. Neuronal activity during target selection. Illustration of neuronal activity in the oculomotor network when a target stimulus (solid line) or a distractor stimulus (dotted line) appears in the response field of a neuron. Initial increase in activity does not discriminate the target from a distractor. However, the target begins to be identified at the leftward red line, and target activity compared to distractor activity is statistically different by the rightward red line (discrimination time), signifying that the target is discriminated from the distractor. Once a certain saccade initiation threshold is reached, a saccade is executed (black vertical line).
0" 50" 100" 150" 200"
N
eu
ro
nal
"A
c0
vi
ty
"
Time"from"search"array"(ms)"
Target
Distractor Discrimination
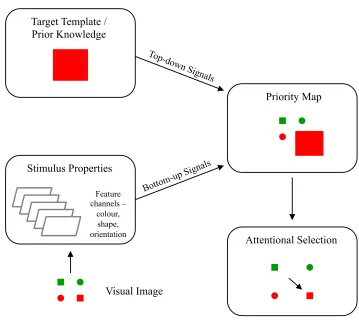
Figure 2. The visual priority map. Illustration of the theoretical visual priority map and its contribution based on models of visual search and visual attention. This map receives input relating to both stimulus-related (bottom-up) and goal-directed (top-down) signals. The stimulus with the highest activation on the priority map (represented by stimulus size in this case) is chosen as the next target of selection. Adapted from Hamker (2006).
Target Template / Prior Knowledge
Priority Map
Stimulus Properties
Top-dow n Signa
ls
Bottom-up S ignals
Visual Image
Feature channels –
colour, shape, orientation
delay and subsequently using it to guide behaviour. The memory-guided saccade task
requires animals to saccade to a remembered location after holding that target location in
working memory for a delay period. Neurons in the PFC showed elevated directional
delay period activity during the memory-guided saccade task (Funahashi et al. 1989), and
also a delayed match to sample task of complex stimuli (Miller et al. 1996; see review,
Curtis and D’Esposito 2003). These findings demonstrate that the PFC plays a role in the
working memory process.
Attention must also be flexibly allocated based on the varying behavioural
relevance of a stimulus or task, and the DLPFC has shown to be involved with this as
well. Recordings from macaque DLPFC during a non-cued antisaccade switch task
(saccade to the location opposite a stimulus) found that neurons in this area modulated
their activity depending on whether the monkey was in a prosaccade or antisaccade block,
suggesting that neurons in this area maintain some sort of rule selectivity in the flexible
control of behaviour (Everling and DeSouza 2005). Also, neuronal encoding of abstract
rules has been demonstrated in the PFC while flexibly switching between different rules
using complex object stimuli (Wallis et al. 2001). Prefrontal activation has also been
demonstrated in both macaques and humans on a similar set-shifting task during fMRI
(Nakahara et al. 2002), and flexibility on a visual discrimination task requires the PFC
(Rossi et al. 2007, Pessoa et al. 2009). Lastly, principal sulcus lesions impaired the
maintenance of current rules in working memory during the Wisconsin Card Sorting Task
(Buckley et al. 2009). Therefore, the DLPFC is an excellent candidate region for
influencing a number of processes related to attention, working memory and cognitive
also been studies determining its connections with other areas of the oculomotor network,
particularly involving the FEF (Stanton et al. 1993), parietal cortex (Petrides & Pandya
1984) and the SC (Fries 1984, Johnston and Everling 2009).
The DLPFC has also been investigated during visual search using
neurophysiology and deactivation techniques to determine its role in target selection.
Neurophysiological studies in which DLPFC neurons were recorded while monkeys
performed visual search tasks (Hasegawa et al. 2000, Iba and Sawaguchi 2002, Katsuki
and Constantinidis 2012) established that neurons in this area showed activity consistent
with the identification of the search target (discriminating the target from distractors),
followed by directional delay-period activity (holding target information during the
delay). Based on these findings, Iba and Sawaguchi (2002) proposed that the DLPFC
forms an attention-memory system, tasked with target identification as well as temporary
storage of target information. While the above studies support the role of the DLPFC in
visual target selection, a bottom-up feature search task in which the target was defined by
colour or shape was used. Deactivation studies using a conjunction search in which the
target was defined by shape and colour also showed that muscimol-induced reversible
deactivation of the DLPFC resulted in deficits selecting the target from distractors in the
contralateral hemisphere (Iba & Sawaguchi 2003). Thus, the DLPFC has been
demonstrated to contain visuospatial mnemonic processes, and appears to use this to help
correctly identify a target from distractors and subsequently direct attention to the target
location. However, its contribution to the searches may have been limited as the target
was clearly identified in a feature search, and the target remained constant in the
the delay following the search required only the target location to be held in working
memory, and may not have required temporary retention of any relevant target features.
Taken together, these studies suggest that the DLPFC is involved in selective visual
attention, possibly working with other areas in the oculomotor network to help provide
top-down influence. These studies, however, have not uncovered the potential
contribution of the DLPFC when selective visual attention involves working memory or
behavioural flexibility.
Given that we now have an understanding of what is occurring at the neuronal
level in the oculomotor network (FEF, LIP, SC) during target selection, our goal is to
determine what contribution the DLPFC has in flexible or mnemonic processes in target
selection. There are multiple approaches that can be taken to determine this contribution,
including neuronal recording, stimulation or deactivation. An easy initial step to
determine the degree of a brain area’s involvement with a particular process is to remove
that area and observe the subsequent behaviour. Lesion studies have been invaluable in
understanding how the brain works, either naturally in patients or experimentally in
animals (e.g. see Fuster 2001). Regarding the link between neurons and behaviour, one
method is to permanently or reversibly deactivate a candidate set of neurons and measure
any cognitive deficit (Parker and Newsome 1998). One such study did exactly this, which
performed PFC lesions and investigated its contribution to visual attention. Monkeys that
had unilateral PFC lesions were unaffected in a visual discrimination task involving
bottom-up attention or when target identity stayed the same, but showed deficits when the
target identity changed frequently across trials (Rossi et al. 2007). Though many
flexibility (similar to what was noted earlier regarding task switching) and additionally
suggests a role in visual attention. While this study examined top-down PFC control
processes, these and other cognitive processes still need to be explored in visual search. In
addition, while traditional lesion studies have allowed us to gain tremendous knowledge
regarding brain function, less permanent and just as effective techniques have been
developed to accomplish the same goal.
Cryogenic deactivation is one technique that can be used to reversibly inactivate a
brain region or related neural circuit. There are also different methods to cryogenically
deactivate the brain. The cryoloop technique involves running chilled methanol through
stainless steel loops that are in contact with the cortical surface to selectively and
reversibly deactivate a brain area (see review, Lomber et al. 1999). By custom designing
cryoloops using anatomical MRI data, it is possible deactivate a selected brain area within
minutes of running chilled methanol through the loop, and then remove deactivation
again within minutes following stoppage of methanol flow. The effect of cortical cooling
on neuronal activity has been studied extensively (Jasper et al. 1970, Horel 1984, Lomber
et al. 1996, Lomber et al. 1999), and these studies have determined that cooling the
cortex below 20°C results in the abolishment of neural activity by means of blocking
synaptic transmission. Since the use of various cooling methods (Jasper et al. 1970), the
use of the highly circumscribed cryoloops have now allowed researchers to chronically
and selectively deactivate more specific areas to determine functional specialization
(Lomber et al. 2010, Hussein et al. 2014). Unlike pharmacological inactivation
techniques (e.g. muscimol), cryogenic inactivation can be used to both inactivate and
experimental data within a single session. Though muscimol inactivation has been used to
study target selection (Wardak et al. 2002, Iba and Sawaguchi 2003), the spread of
inactivation can be difficult to replicate and this technique can ultimately result in tissue
damage and permanent effects (Lomber 1999). The reproducibility, lack of permanent
damage, ability to combine with neuronal recording and amount of control over
inactivation makes cooling a useful and effective technique to study the DLPFC and
examine its role in visual search.
Although there exists substantial literature which has detailed the neural basis of
saccade target selection, some of the cognitive processes related to top-down control in
visual search have been less studied. Task-set reconfiguration (behavioural flexibility)
and working memory are two cognitive processes that have been linked to the
deployment of visual attention, but their roles in visual search have not been identified.
Task-set reconfiguration is as follows: when a visual search target changes, the brain must
draw upon relevant past knowledge of the goal and target, form a new target template
from which to search, reconfigure the top-down selective attention processes, and direct
attention by moving the eyes to the new target. Given the theories and evidence discussed
thus far, there is logical foundation that these processes—in visual target selection—are
associated with the function of the PFC.
The aim of this project is to investigate the role of the DLPFC in top-down
cognitive processes related to the deployment of attention as measured in visual search
tasks. Specifically, we will reversibly and bilaterally deactivate the DLPFC of rhesus
macaque monkeys performing visual search tasks to determine the link between this area
relationship to selective visual attention. We designed four visual search tasks, with each
more cognitively demanding than the previous. The first task was a feature search in
which the oddball target was defined by colour. The second task was a constant-target
conjunction search, as the target was defined by a combination of shape and colour and
the target remained constant for the entire session. Since the target was now perceptually
similar to the distractors, top-down control was required to locate the target. The third
task was a variable-target conjunction search task, with the search target now changing on
a trial-by-trial basis. This task not only required knowledge of the conjunction target, but
also tested behavioural flexibility, the process of task-set reconfiguration. The fourth and
final task was a variable-target with delay conjunction search task. In addition to
requiring knowledge of the target and testing the process of task-set reconfiguration, the
trial-specific target must also be held in working memory during the delay before
presentation of the array.
We hypothesize that DLPFC deactivation will impair search performance on the
visual search tasks involving top-down control and flexible or mnemonic processes. We
predict that DLPFC deactivation will result in minimal reaction time or accuracy changes
on the feature search task and the constant-target conjunction search task, but that
reaction time increases and accuracy decreases will be observed on the tasks involving
behavioural flexibility and working memory, the variable-target and variable-target with
Materials & Methods
Surgical Procedures
Data were collected from two male rhesus monkeys (Macaca mulatta) weighing 9 and 12
kg. All procedures were carried out in accordance with the guidelines of the Canadian
Council of Animal Care Policy on the Use of Laboratory Animals and a protocol
approved by the Animal Use Subcommittee of the University of Western Ontario Council
on Animal Care. Both animals were prepared for chronic implantation of plastic head
restraints and stainless steel cryoloops (see Koval et al. 2011). Briefly, monkeys
underwent an MRI to determine the location and shape of the principal sulcus and
subsequently underwent an aseptic surgery. Animals were anesthetized and placed in a
stereotaxic apparatus to prepare them for surgery. A craniotomy was performed on each
hemisphere to expose the surface of the brain at the principal sulcus. Stainless steel
cryoloops (6 × 3 mm) were implanted bilaterally into the caudal portion of the principal
sulcus (cPS; see Figure 3) and bilaterally on the cortex immediately dorsal to the principal
sulcus (DPC). A plastic head restraint was also implanted, all using dental acrylic.
Animals received antibiotics and analgesics post-surgery and were closely monitored by a
university veterinarian. Cryoloops were custom fashioned from 23-gauge hypodermic
stainless steeling tubing based on the anatomical MR images of the animals. Details and
technicalities of the cryoloop—including design, surgery and use—have been previously
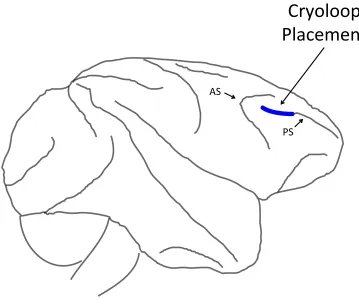
Figure 3. Cryoloop placement in the macaque prefrontal cortex. Cryoloops were implanted bilaterally in the caudal principal sulcus (PS). Blue line denotes approximate location of the cryoloop. AS, arcuate sulcus.
Cryoloop'
Placement'
AS'
Behavioural Paradigms
Both animals were trained on four visual search tasks in which they were required to
make a single saccade to a target stimulus amongst an array of distractors (Figure 4). The
first task was a feature search task in which the target was defined by colour. The
additional tasks were three versions of a conjunction search task in which the target was
identified by both colour and shape. The first of these contained a constant search target.
The second task contained a variable search target, and the third conjunction search task
consisted of a variable target followed by a delay. All tasks began with the presentation of
a central white fixation spot at the center of a CRT monitor. Horizontal and vertical eye
positions were recorded at 500 Hz using an Eyelink II system (SR Research, Kanata,
Canada).
Feature Search Task
In this task, animals were required to make a saccade to a target defined by colour.
Animals were required to fixate on a central white fixation spot (0.5°) and maintain eye
position within a 4° x 4° electronic window for 500 msec. Eight visual stimuli (circles
approximately 1.3° in size) were then presented 8° equidistant from the fixation (see
Figure 4), and monkeys were required to make a single saccade to the search target. The
search target was either a green circle with an array of seven red circle distractors, or a
red circle with an array of seven green circle distractors. The target was presented
pseudorandomly to any of the eight stimuli positions, and thus there were eight conditions
for this task. Each session consisted of either a green or a red target and remained
target location for 200 msec—animals received a liquid reward. Lost or broken fixation at
any point during the trial resulted in termination of the trial. Errors were defined as a trial
in which the array was presented and the animal made a saccade to one of the distractor
stimuli. A two second intertrial interval consisting of a blank screen followed all trials
before the next trial commenced.
Constant-Target Conjunction Search Task
In this task, animals were required to make a saccade to a target defined by a conjunction
of features, those being colour and shape. The four stimuli were a red square, green
square, red circle and a green circle. Thus, on any trial the target shared a common
feature, either shape or colour, with the distractors. One distractor had the same shape,
one had the same colour, and the other distractor shared no feature. In this task, one of the
four stimuli was pseudorandomly chosen as the search target for the each session. To
instruct the monkey of which item was the search target for each session, a 50-trial
training preview was completed. In this training session, the target began at fixation and
subsequently appeared at one of the four target positions following a 500 msec fixation
period. This preview allowed the animal to determine what the target was before each
session started. In the task, and following a 500 msec fixation of the white fixation spot,
the array would be presented and the monkey was required to make a single saccade to
the target position. As before, 200 msec fixation at the target location resulted in a correct
trial and administration of a liquid reward. Lost or broken fixation at any point during the
trial resulted in termination of the trial. Errors were defined as a trial in which the array
was presented and the animal made a saccade to one of the distractor stimuli. The target
before, a two second intertrial interval consisting of a blank screen followed each trial
before the next trial commenced.
Variable-Target Conjunction Search Task
For the variable-target version of the conjunction search task, the search target was
instructed on a trial-by-trial basis. Two of the set of four stimuli—red square, green
square, red circle, green circle—were randomly chosen as the search targets in each
session, with either of the two being randomly selected as the search target for a particular
trial. Following a 500 msec fixation, the target stimulus was presented while the animal
maintained fixation. The target stimulus was presented for 500 msec to instruct the
monkey of the target for that specific trial (see Figure 4). This was followed by a 100
msec white fixation spot delay to minimize any screen afterimage of the search target,
which could serve as a preview to saccade to the target. The array was then presented and
the monkey was required to make a single saccade to the target position. As before, 200
msec fixation in the target location resulted in a correct trial and the administration of
liquid reward. Lost or broken fixation at any point during the trial resulted in termination
of the trial. Errors were defined as a trial in which the array was presented and the animal
made a saccade to one of the distractor stimuli. An intertrial interval of two seconds
occurred before the next trial commenced.
Variable-Target with Delay Search Task
The final version of the conjunction search task was similar to that of the variable-target
version, except with a longer post-target instruction delay. Similar to the variable-target
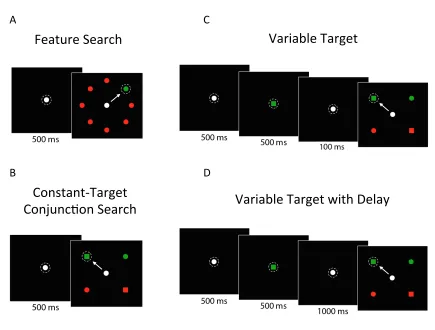
Figure 4. Behavioural search paradigms. (A) In the feature search task, the target was defined by colour (red or green), and randomly appeared in one of eight stimulus positions. (B) Constant-target conjunction search, with any one stimuli being randomly chosen as the target for an entire session. (C) Variable-target conjunction search, with two of the stimuli being randomly chosen for a session, and one of the two stimuli randomly being cued before presentation of the array. (D) Lastly, in the variable-target with delay conjunction search, the task is similar to (C) but included a 1000 msec delay before presentation of the array.
Variable(Target(
Variable(Target(with(Delay(
Feature(Search(
(
Constant8Target(
Conjunc:on(Search((
(((((
A( C(
either of the two being randomly selected as a target for a particular trial. Following the
500 msec fixation and a 500 msec target-instruction period, a 1000 msec delay now
occurred while the animal maintained fixation. The array was presented at the end of this
delay and the monkey had to make a single saccade to the target. As with the previous
task, each combination of target and distractor arrays was presented within each session.
Again, 200 msec fixation in the target location resulted in a correct trial and the
administration of liquid reward. Lost or broken fixation at any point during the trial
resulted in termination of the trial. Errors were defined as a trial in which the array was
presented and the animal made a saccade to one of the distractor stimuli. A two second
intertrial interval occurred before the next trial commenced.
Prefrontal Deactivations
We collected data from a total of 79 sessions, with each animal performing nearly 10
sessions for all four tasks. All data was collected from bilateral deactivation of the cPS
loops. The cPS loops have been estimated to deactivate Brodmann areas 46 and 9/46, as
well as part of area 8A (Petrides & Pandya 1999, Hussein et al. 2014). Since the spread of
cooling is approximately 2 mm on either side of the loop, each loop is thought to
deactivate the volume of a box with dimensions 10 × 7 × 4 mm, or an estimated 280 mm3
of cortex. The DPC loops have been estimated to deactivate portions of areas 46, 9, 9/46d
and 8 (Hussein et al. 2014). Different tasks and/or different search targets were randomly
run on separate days, with one session per animal per day.
Both experimental and control data were collected on every day, as each 45
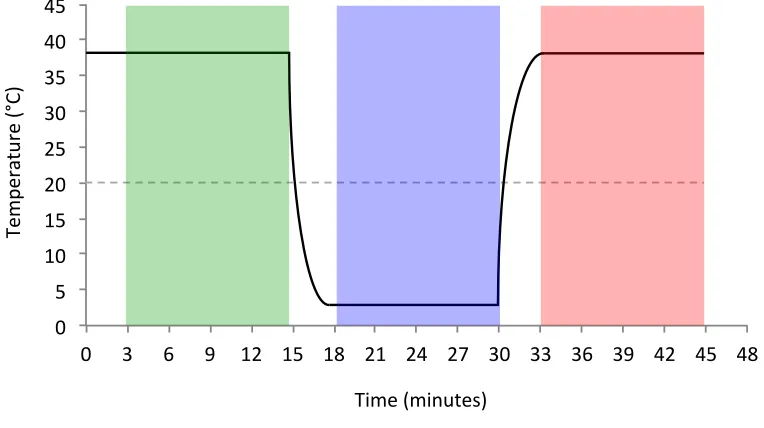
post-cooling (see Figure 5). An initial 15-minute pre-post-cooling control epoch was obtained at the
beginning of each session. The first three minutes of the epoch were later removed to
allow performance to stabilize as the animals were still acquiring the target for that
session. At 15 minutes, two pumps were turned on (one for each cryoloop) and methanol
drawn up from a reservoir was pumped through Teflon tubing which resided in a
methanol bath, the temperature of which was reduced to approximately -80°C by the
addition of dry ice (see Figure 6). Chilled methanol then continued to flow through the
tubing and through the loop, where after it was then returned to the initial reservoir.
Thermocouples attached to the union of the loop monitored the temperature of the loops
at all times. Data from the first three minutes of the cooling epoch (15–18 minutes) were
excluded as loop temperature was changing, and to allow the animal’s performance to
reach a steady state at the decreased temperature. Target temperature was approximately
3°C, resulting in a temperature range of between 0–5°C. In majority of sessions (94%),
loops were below this target temperature at approximately 18 minutes into the session,
with the rest of the sessions reaching this temperature in the next two minutes. At this
temperature, a large volume of cortex is deactivated, as ~2 mm of tissue around the loop
is deactivated (Lomber et al. 1999). At 30 minutes, the two pumps were turned off and
chilled methanol stopped flowing through the loops. Temperature rapidly increased back
towards normal temperature, with loop temperature going above 30°C within the first
minute. Data from the first three minutes of the post-cooling control epoch (30–33
minutes) were excluded as loop temperature was changing, and allow the animal’s
performance to again reach a steady state at this temperature. Each session was ended at
45 minutes. Following each session, monkeys received liquid until satiation and were
Data Analysis
Data was analyzed using custom-designed software in Matlab (Mathworks, Natick, MA).
Reaction time was defined as the time between when the array was presented until the
time the animal began to make a saccade. Saccade onset was defined as the time when
eye velocity exceeded 30°/second. Only the reaction times from correct trials were
included in the analysis. Accuracy was calculated as the number of correct trials divided
by the total number of trials attempted (saccades to distractors). Following removal of the
first three minutes of each epoch, a total of approximately 400 trials were obtained for
each session, or 130 trials per session for each epoch. Significance was determined by a
one-way repeated measures ANOVA with three levels of factor cooling epoch. The levels
were pre-cooling, cooling and post-cooling. An ANOVA was run separately for each
animal and each task, for both saccadic reaction time and accuracy. For example, a
one-way repeated measures ANOVA was run for Monkey B’s reaction time for feature search
task. Three data sets were included in the ANOVA; pre-cooling epoch reaction time,
cooling epoch reaction time, and a post-cooling epoch reaction time. Accuracy was
calculated for each session, and then averaged across the sessions. In contrast, the
saccadic reaction times were pooled across all sessions for each epoch. For example, if
there were 130 trials per session in each epoch, and ten sessions, there would 1300
saccadic reaction times in each epoch for the ANOVA. Follow-up tests (one-tailed two
sample student t tests) were performed given a significant ANOVA. One test was
between pre-cooling and cooling epochs, and another test was between cooling and
Figure 5. Cortical cooling timeline. Each 45-minute session was divided into three epochs: pre-cooling, cooling and post-cooling. The first three minutes of each epoch were removed to allow performance to reach a steady state. Solid line indicates cryoloop temperature. Dashed line indicates temperature at which synaptic transmission is abolished (20 °C).
0" 5" 10" 15" 20" 25" 30" 35" 40" 45"
0" 3" 6" 9" 12" 15" 18" 21" 24" 27" 30" 33" 36" 39" 42" 45" 48"
Te
m
pe
ratu
re
"(°
C)
""
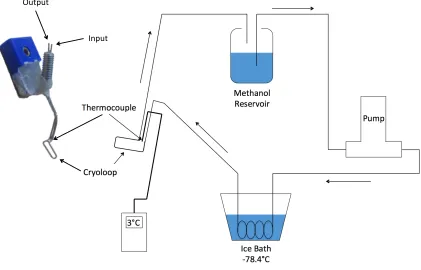
Figure 6. Reversible cryogenic deactivation with cryoloop (left) and experimental cooling setup (right). Room-temperature methanol was pumped from a reservoir through Teflon tubing which passed through a methanol dry ice bath that was cooled to
approximately -80°C. The chilled methanol was then pumped through the cryoloop and
back to the reservoir. Cryoloop temperature was monitored at all times by an attached thermocouple, with the temperature reading out to a thermometer. Temperature was
maintained around the 3°C by adjusting the flow rate of the pump.
Output%
Results
Effects of DLPFC deactivation on feature search task performance
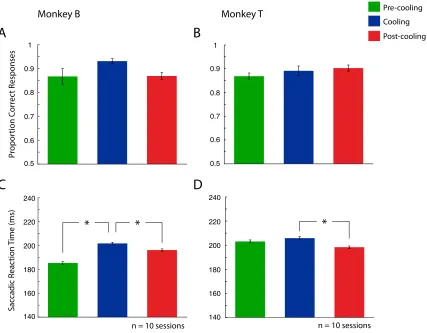
Figure 7 shows each monkey’s performance on the feature search task (n = 10 sessions
for Monkey B consisting of n = 5028 total trials, and n = 10 sessions for Monkey T
consisting of n = 4982 total trials). Each session was divided into three epochs;
pre-cooling, cooling and post-cooling. Accuracy is represented as proportion correct
responses. Saccadic reaction times for each animal are also plotted in msec. Bilateral
cooling of the cPS resulted in performance changes for both animals. To statistically
examine effects on accuracy, a one-way repeated measures ANOVA was performed and
showed no change in accuracy across the different epochs for both Monkey B and Monkey
T (F(1,2) = 2.78, p = 0.119 for Monkey B, F(1,2) = 1.38, p = 0.277 for Monkey T).
Monkey B showed a significant effect for reaction time (F(1,2) = 80.28, p < 0.001), as did
Monkey T (F(1,2) = 13.58, p < 0.001). Post-hoc comparisons (one-tailed two sample t
tests) revealed that Monkey B had an increase in reaction time during the cooling epoch
compared to both the pre-cooling epoch (p < 0.001) and the post-cooling epoch (p <
0.001). Post-hoc comparisons for Monkey T revealed this difference was not significant
between the pre-cooling and cooling epochs (p = 0.053), but was significant between the
cooling and post-cooling epochs (p < 0.001). Monkey B reaction time increased to 202
msec during cooling from 185 msec before, and then dropped to 196 msec following
cooling. The reaction time change for Monkey T changed from 206 msec during cooling
Effects of DLPFC deactivation on constant-target conjunction search task
performance
Figure 8 shows each monkey’s performance on the constant-target conjunction search
task (n = 10 sessions for Monkey B consisting of, n = 3827 total trials, and n = 9 session
for Monkey T consisting of n = 3828). A one-way repeated measures ANOVA showed
that bilateral cooling of the cPS resulted in no change in accuracy either monkey (F(1,2)
= 1.47, p = 0.256 for Monkey B, F(1,2) = 2.21, p = 0.142 for Monkey T). Regarding
reaction time, Monkey B showed a significant effect (F(1,2) = 160.37, p = < 0.001).
Monkey T also demonstrated a change in reaction time during this task (F(1,2) = 31.62, p
= < 0.001). Post-hoc comparisons for Monkey B (one-tailed two sample t tests) revealed
that a reaction time increase occurred between pre-cooling and cooling (p < 0.001), as
well as reaction time decrease between cooling and post-cooling (p < 0.001). Post-hoc
comparisons for Monkey T revealed that there was a decrease in reaction time between the
pre-cooling and cooling epoch (p < 0.001), which then decreased again following cooling
(p < 0.001). Monkey B had a reaction time increase from 199 msec during pre-cooling to
230 msec during cooling. This decreased back to 201 msec during the post-cooling epoch.
Monkey T’s reaction time seemed to decrease as the session progressed. Starting with a
224 msec reaction time during the pre-cooling epoch, this decreased to 215 msec during
the cooling epoch, and decreased again during the post-cooling epoch to 207 msec.
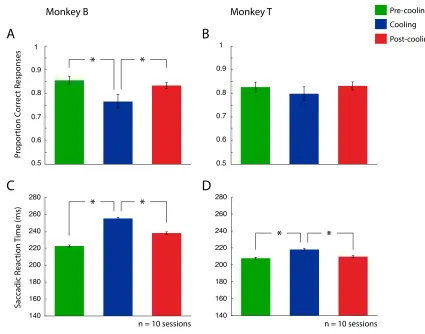
Effects of DLPFC deactivation on variable-target conjunction search task
performance
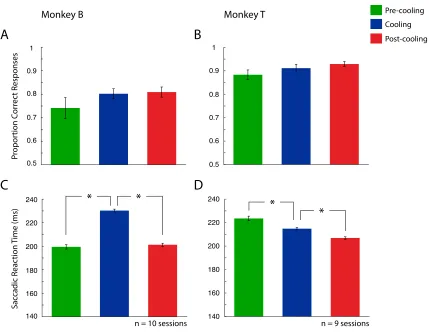
Figure 9 shows each monkey’s performance on the variable-target conjunction search
for Monkey T consisting of n = 3680 total trials). cPS deactivation affected performance
in both animals when the target now changed on a trial-by-trial basis. A one-way repeated
measures ANOVA demonstrated Monkey B had a change in accuracy during cooling
(F(1,2) = 6.99, p = 0.006), whereas Monkey T had no change in accuracy (F(1,2) = 1.60, p
= 0.229). Post-hoc comparisons (one-tailed two sample student t tests) revealed that
Monkey B had a decrease in accuracy between both the pre-cooling and cooling epochs (p
= 0.009) and an increase between the cooling and post-cooling epochs (p = 0.026). After
performing at 86% during pre-cooling, Monkey B’s accuracy dropped to 77% during
cooling. This drop however showed recovery, with accuracy increasing back to 83% in
the post-cooling epoch. Both animals also showed a statistically significant effect on
reaction time during the cooling (F(1,2) = 206.05, p = < 0.001 for Monkey B, F(1,2) =
21.26, p = < 0.001 for Monkey T). Post-hoc comparisons for Monkey B demonstrated an
increase in reaction time during cooling compared to pre-cooling (p < 0.001), which then
decreased when comparing cooling to post-cooling (p < 0.001). Monkey T also
demonstrated a reaction time increase, increasing from pre-cooling to cooling (p < 0.001),
and demonstrated a decrease between the cooling and post-cooling epoch (p < 0.001).
Monkey B demonstrated a reaction time increase from 223 msec during pre-cooling, to
255 msec during the cooling epoch, which then decreased to 238 msec following cooling.
Monkey T had a reaction time increase to 218 msec during cooling, compared to 208 msec
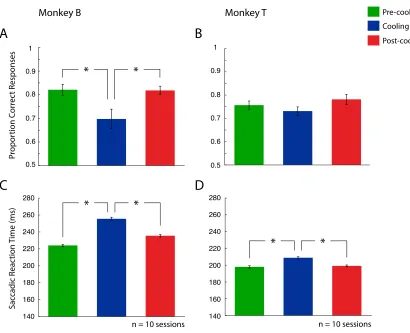
Effects of DLPFC deactivation on variable-target with delay conjunction
search task performance
Figure 10 shows each monkey’s performance on the variable target with delay search task
(n = 10 sessions for Monkey B consisting of n = 3540 total trials, and n = 10 sessions for
Monkey T consisting of n = 3084 total trials). Again, to statistically evaluate both animal’s
performance, a one-way repeated measures ANOVA showed that cooling had a
significant effect on Monkey B’s accuracy (F(1,2) = 5.14, p = 0.017). A repeated
measures ANOVA revealed that Monkey T demonstrated no change in accuracy during
cooling (F(1,2) = 2.71, p = 0.094). Post-hoc comparisons (one-tailed two sample student t
tests) revealed a decrease in accuracy when comparing the pre-cooling to the cooling
epoch (p = 0.009) and comparing the cooling to the post-cooling epoch (p = 0.008).
Performing at 82% during pre-cooling, Monkey B’s accuracy dropped to 70% during
cooling of the cPS. This accuracy increased back to 82% in the post-cooling epoch. A
one-way repeated measures ANOVA revealed both animals showed an effect on saccadic
reaction time (F(1,2) = 88.82, p < 0.001 for Monkey B, F(1,2) = 17.92, p < 0.001 for
Monkey T). Reaction time effects for Monkey B increased during cooling compared to
pre-cooling (p < 0.001), and subsequently decrease when comparing the cooling and
post-cooling epoch (p < 0.001). Post-hoc comparisons also revealed Monkey T had a
significant increase in reaction time when comparing the pre-cooling and cooling epochs
(p < 0.001) as well as between cooling and post-cooling (p < 0.001). Monkey B had a
reaction time increase from 224 msec during pre-cooling to 256 msec during cooling.
T increased during cooling to 209 msec from 199 msec during pre-cooling, which then
Figure 7. Performance on the feature search task. Left column (A and C) represents
Monkey B, while right column (B and D) represents Monkey T. A and B denote
proportion correct responses. C and D denote saccadic reaction time. Error bars indicate
SEM. See legend for pre-cooling, cooling and post-cooling epochs. * p < 0.05.
0.5 0.6 0.7 0.8 0.9 1 Pr opor tion C or rec t R esponses Monkey B 140 160 180 200 220 240 Sac cadic R eac tion Time (ms)
n = 10 sessions
0.5 0.6 0.7 0.8 0.9 1 Pre-cooling Cooling Post-cooling Monkey T 140 160 180 200 220 240
n = 10 sessions *
* *
A
B
Figure 8. Performance on the constant-target conjunction search task. Left column (A
and C) represents Monkey B, while right column (B and D) represents Monkey T. A and B
denote proportion correct responses. C and D denote saccadic reaction time. Error bars
indicate SEM. See legend for pre-cooling, cooling and post-cooling epochs. * p < 0.05.
* * Pre-cooling Cooling Post-cooling * * 0.5 0.6 0.7 0.8 0.9 1 Pr opor tion C or rec t R esponses Monkey B 140 160 180 200 220 240 Sac cadic R eac tion Time (ms)
n = 10 sessions
0.5 0.6 0.7 0.8 0.9 1 Monkey T 140 160 180 200 220 240
n = 9 sessions
A
B
Figure 9. Performance on the variable-target conjunction search task. Left column (A and
C) represents Monkey B, while right column (B and D) represents Monkey T. A and B
denote proportion correct responses. C and D denote saccadic reaction time. Error bars
indicate SEM. See legend for pre-cooling, cooling and post-cooling epochs. * p < 0.05.
* * Pre-cooling Cooling Post-cooling * * 0.5 0.6 0.7 0.8 0.9 1 Pr opor tion C or rec t R esponses Monkey B Sac cadic R eac tion Time (ms)
n = 10 sessions
0.5 0.6 0.7 0.8 0.9 1 Monkey T
n = 10 sessions
Figure 10. Performance on the variable-target with delay conjunction search task. Left
column (A and C) represents Monkey B, while right column (B and D) represents Monkey
T. A and B denote proportion correct responses. C and D denote saccadic reaction time.
Error bars indicate SEM. See legend for pre-cooling, cooling and post-cooling epochs. * p < 0.05.
* * * * Pre-cooling Cooling Post-cooling * * 0.5 0.6 0.7 0.8 0.9 1 Pr opor tion C or rec t R esponses Monkey B Sac cadic R eac tion Time (ms)
n = 10 sessions
0.5 0.6 0.7 0.8 0.9 1 Monkey T
n = 10 sessions
Table 1. Accuracy and reaction time in a visual search tasks. Accuracy (in proportion
correct) and reaction time (in msec) for both Monkey B and Monkey T in the feature
Discussion
Our findings confirm and extend the DLPFC involvement with the deployment of
attention, specifically when it involves behavioural flexibility and/or working memory.
Performance deficits on a number of visual search tasks were seen when the region lining
the caudal principal sulcus of the DLPFC was reversibly deactivated in two rhesus
monkeys. Although we observed some performance changes during cooling for feature
and constant-target conjunction search tasks, this was inconsistent between the two
animals. One animal showed increased reaction time for both tasks, while the other
showed an incomplete reaction time increase for the feature search, and decreased
reaction time over the progression of the constant-target conjunction search task. We did
however, observe more consistent effects of increased reaction time in one animal, and
increased reaction time with decreased accuracy in the other for the variable-target and
variable-target with delay conjunction search tasks—the more demanding tasks. These
results suggest that DLPFC involvement is most critical for situations requiring more
cognitive control, as greater and more consistent effects appeared during the more
cognitively demanding tasks.
Upon cooling the DLPFC, we noted behavioural performance changes in all four
of our visual search tasks. Both animals demonstrated an increase in saccadic reaction
time during cooling for the feature search, though for Monkey T this was only between the
cooling and post-cooling epochs. For the constant-target conjunction search, while both
monkeys showed reaction time changes, neither showed a change in accuracy. Monkey B
showed an increase in reaction time during cooling, whereas Monkey T showed a decrease
task, both animals demonstrated an increase in reaction time during the cooling epoch,
whereas Monkey B additionally demonstrated an accuracy decrease. Lastly, the
variable-target with delay conjunction search task revealed performance deficits as well. Though
only Monkey B showed an accuracy decrease during cooling, both animals showed an
increase in saccadic reaction time. While deactivation of the DLPFC led to minor
impairments on the first two tasks, each monkey demonstrated greater impairments in the
last two tasks. Altogether, the most consistent effects were seen in tasks that required
behavioural flexibility, and behavioural flexibility with working memory.
The concept of a visual salience or priority map has been proposed to account for
neural activity that is consistent with representing all competing stimuli in our visual
field, and which is crucial in order to direct attention to the correct object of a scene
(Wolfe 1994, Desimone and Duncan 1995, Bundesen et al. 2005, Fecteau and Munoz
2006, Hamker 2006). By assigning each stimulus an attentional weight, combining both
bottom-up (salience) and top-down (relevance) factors, the stimulus with the highest
activation on the priority map can be chosen. Bottom-up attentional processing is thought
to consist of distinct feature channels, with each feature (such as colour, shape or
orientation) of a stimulus activating an individual channel (Wolfe 1994, Itti and Koch
2001, Hamker 2006). Thus, a red circle would activate both the feature channel “red”, and
the feature channel “circle”. These feature channels would then be combined back
together to represent this stimulus on the priority map. Top-down attention can also bias
the signals on the priority map, or perhaps earlier on the feature channels. By searching
for a specific target (e.g. a red circle amongst an array of coloured circles and squares),