ELECTROMAGNETIC DECAY OF THE SECOND EXCITED STATE OF
c
12Thesis by Philip A. Seeger
In Partial Fulfillment of the Requirements For the Degree of
Doctor ol Ph~lo•ophy
California Institute of Technology Pasadena. California
I wiah to thank Dr. R. VI. Kavanagh lor hh great help in the
conception, deaign, and execution of thla experiment. 1 am &leo
indebted to the entire etaff of the Kellogg Radiation Laboratory, not
only for many useful diacusaione and suggeetiona, but also for ere·
ating an atmosphere in which the work could be aucceaefully car·
ABSTRACT
It was desired to determine what traction of
clZ
nuclei in the second excited state decay electromagnetically to the ground state in·stead of by alpha emilaion. The state was formed with the reaction
l'f
4(d,a:
)<f
4*
by bombardinga
thin vanadium nitride target on carbon foil with 1. 8-MeV deuterons. Recoilc
12 nuclei were observed incoincidence with the alpha particles from the reaction. The alphas
were detected with a surface-barrier counter set at the appa-opriate
0
unique angle, and the recoiling nuclei at 90 were analyzed in
momen-tum "Nith a magnetic spectrometer, in energy by a surface-barrier
counter at the spectrometer focus, and in velocity by the time delay between the alpha and the
c
12 counts. Pulsee of 40-neec width were recorded photographically from a Tektronix type 555 dual-beam os-cilloscope, providing a time resolution of 5 nsec, and also allowing~
pulse height analyeil on the fast opulaes. Of the
c:f1.
nuclei formed inthe second excited state, 99.
9+
per cent decay by alpha emission to Be8 and are not detected; only thooe which decay to thec
12 ground state by gamma or pair emission will be seen. Thue the experimentprovides a direct measurement o£
r
radI
['
.
The value of f'rad=
o
c
'Y
+ r e*) has aetrophysical eignificance, determining the rate ofCU formation in the He-burning proceee in red giant stars. Analysis
of 170 observed events gtves r rad/I' a (2.8 :t 0. 3)X 10-4• Averaged with a value of (3. 3 ::1: 0. 9)X 10-4 obtained by Alburger. and combined
with a value of i'
=
(8 :t: 5) eV, the reault isr
d a (0. 002 4 :t: O. 00151 eV, rawhich ie two-and-one-haU times the value used in previous astrophysi
PART TITLE
PAGE
I.
INTRODUCTIONA. Aatrophyaical Significance.
.
.
•.
. .
1 B. Previoue Knowledge.
.
.
.
.
•.
. . .
.
.
. .
3 II. EXPERIMENT: APPARATUSA. Reaaons for Ueing
~
4(d,a)d
2•;
Kinematics •.
•.
5 B. Target Manufacture.
•.
•. .
. .
.
6c.
Recoil-Ion Detection • • • • •.
•. . . .
7 D. Alpha Detection. .
. .
. .
•. .
.
• 9E. Coincidence Detection
.
. .
•.
. .
•.
.
JZ Ill. PROCEDURE AND RESULTSA.
Non-Coincident Recoil-Ion Spectra •.
.
•.
•.
16B. Non-Coincident Alpha Spectra •
.
. .
.
. .
• 16c.
Procedure for Recording Coincidence•. . .
•.
17D. Energy and Time Normalisation •
.
. .
.
. .
19 E. Determination of Number of Count• •.
•.
22 F. EXperimental Reeulta. .
. . .
.
.
.
.
. .
• 24IV. AN.ALYSlS OF RESULTS
A.
Equation for rrad/r •.
.
. . .
. .
.
.
Z6 B. Population Factor, P •.
•.
. . .
.
.
28c.
Charge State Factor,c
.
•.
.
•.
. .
. .
28D. Geometry Factor, 0 • •
.
.
.
•.
.
• •. .
. .
.
31E. Thickneae Factor, T.
.
. . .
.
• 34F.
Calculation ofr
rad/r •. .
.
.
•.
36TABLE OF CONTENTS (Cont'd)
APPENDICES
A. Thin Nitrogen Targets
.
. .
. . .
.
.
' 1. Carbon-foil backing ••z.
Vanadium evaporation3. Nit riding . • • • • • .
.
.
.
.
.
.
.
.
.
.
.
.
.
. . .
.
.
.
.
4. Composition. • • • • • .
.
. . . .
.
B. Camera and Film Developing ••
. . .
. .
.
C. Momentum of Gamma Rays
1. Firat excited state •
.
. .
.
.
.
. . .
. .
'z.
Second excited state • • • • • • • • • • • • • • •D. Projection of a Rectangle in Spherical Co~ordina.tes ••
REFERENCES • • • • • • • • • • • • • • • • • • TABLES ••
FIGURES.
.
. .
.
.
.
.
.
. .
.
. .
. .
.
.
.
. .
. .
.
. . .
.
.
.
.
.
.
.
.
.
.
PACE
40
40
41
42
44
46
47
so
55
59
1. INTRODUCTION
A. Astrophysical Significance
A star which has converted moat of its hydrogen into helium
will undel'go gravitational contl'action either until
an
instability arises ol' until the central temperature h raised to such a level that a newnuclear fuel is available as a source of energy. Salpeter (195Z, 1957) baa pointed out that at temperatures of the order of 108 °K, the
reac-tiona
Bea
+
H<!l4=
Clz•will produce small amounts of Be8 and
cfZ•
in dynamic equilibrium.The level of
c
1Z involved hae an interesting hilltory. summarised byCook (1957). When experiments established that the ground state of
(l)
Be8 is unbound by only 95 :!: 5 keV (Hemmendinger 1948, Tollestrup
1949). Salpeter (19SZ) calculated an equilibrium ratio of Be8 to He 4 of
the order of 10-9 for red. giant stars. The effect of the resonance in
He 4
+
:ae
4 was to increase the helium-burning reaction rate comparedto non-resonant calculations by Oplk (1951, 1953), but the Salpeter cal-culations still did not give a fast enough reaction rate at 3 :X 108 degrees.
Hoyle (1954) predicted the existence of a level in
dZ.
at 7. 70 MeV, onthe basis of considerations of reaction rates and of the relative
abun-dances of He 4,
c
1-' • ando
16• At the time of Hoyle's prediction therewas conflicting evidence regarding the existence of such a state. A
-z---•4 ll• .
N" (d, a)C With a high-resolution maanetlc spectrometer to observe the alpha groups, clearly identified an alpha-particle group leading to the state in question. Jn Figure 1 (Lauritsen 196l) the state is shown at 7. 656 MeV. very close to the position predicted by Hoyle. Cook
(1957) showed that thla state does indeed decay into three alpha parti-cles through an intermediate stage involving He 4 and the ground state of Be8, proving (by the general reversibility of nuclear reactions) that the reactions of equation 1 can occur.
If a
c1~•
decays electromagnetically to the ground state, either by gamma emission, by pair emission; or by gamma cascade through the first state, the net result will be (Everling 1960)3 He4 - ell+ 7.Z75 MeV.
The purpose of this experiment was to find the total electromagnetic decay width of the 7. 656-MeV state of
c
12•(2.)
I1 the probability of leakage to the ground state is small com-pared to the alpha emi8sion by
c
12*
indicated in equation 1, the equilib-rium can be expressed (Salpeter 1957) by the law of mass action as fora triatomic molecule:
=
n 3 (Z.J• + 1)(2
1'12.)3
3/2. Ern•
a
(iJ
a
+
1)5
MjcT
3 exp( -k'f )
where n•
=
J.
=
na s::
Ja s::
12.* nwnber density of C ,
spin of ell•
=
0 •number density of He 4, spin of He4 s:: 0,
mass of He4,
(3)
M a
=
(4)
since the mean lifetime for electromagnetic decay is
fl/
r
rad, wheref'rad ie the total radiative decay width. The energy generation per
unit time and per unit mass ie
.
r
=
E9,
= 1 386x 10z4 ,.., Z 3 f ra.d (- 43. 2) erg£ p • 'S xa T
3
exp ~ g sec8
-5 5 3
where
r
5 = pX 10 =density in 10 g/cm ,':.... ia in eV
.trad •
x
a
=
mae a fraction of He 4•= temperature in 108 0
i~.
Ps
t
~ exp { 0. 88 (:-J) ) •
Ta
(5)
The factor f is an electron screening correction (Salpeter 1954, B2FH
,
Ps
1957) neceseary when ~ ~ 0.1. From equationS we see that energy
T
production by the Salpetlr process is linearly dependent on f'rad·
B. Previous Experimental Evidence
From the work of Cook et al. (1957) aa well as later experiments
--(Alburger 1960, Ajzenberg•Selove 1960), the spin and parity of the 7.
656-MeV level are almost certainly 0+. Hence direct g-.mma decay to the
Or ground state is strictly forbidden, and has not been observed. Both
pair emission to the ground state and the gamma cascade through the
Z.+ first excited state have been observed.
-4-only been able to place an upper limit of 0. Fia on the rat_io
r
y;
r
a ,
a · recent experiment by Alburger {1961) gave a positive result.Observ-ing p-y-y triple coincidences in the reaction B10 {He 3, p)c12
*
(yy)ClZ (see Figure 1) he obtained for the branching ratio of the 3. 2Z3-MeVy-ray to the first state~
(6)
A previous set of experiments (Alburger 1960, Ajzenberg-Selove 1960) gave the branching ratio for pair emission:
(7)
In addition, an absolute value of f'e± can be calculated (Oppen-heimer 1939) from a knowledge of the EO matrix element obtained
(Schiff 1955) from inelastic electron scattering data. (Fregeau 1956):
E (5 -26) ' M. •
=
X 10 :1: 25% ,(8)
Combining these results gives
r
=
(8 :t: 5) eV,(9)
I'rad
=
{0. 0027 :.t: O. 0018) eV • (10)The present experiment provides a completely uidependent measurement
ll. EXPERIMENT; APPARATUS
A. Rea.eons for Using N14(d, a)C12*; Kinematics
The plan of the experiment was to populate the second state o£
c
12 in a nuclear reaction, and to observe ear bon ions recoiling .fromthe reaction. Since the lifetime of the state is known from the alpha
-16 -9
width to be o£ th,e order of 10 aeconda, and it take a 1. 8 X 10
sec-onda for a 2-MeV
c
12 to travell em, the recoils can be detected onlyif radiative decay has occurred. To distinguish
t:f
2 ions from otherreaction products, a lo,-, ... resolution magnetic spectrometer was to be
ueed. Since it was necessary to impart as much momentum aa
posai-ble to the recoil nucleus, using a 2-MeV Van de Graaff accelerator.
a reaction with a high Q-value and with a heavy (e.g., mass 4) emitted
particle was sought. From Figure 1 two reactions are seen to qualify:
0
0
=
13.574 MeV.The second of these reactions was chosen because a natural nitrogen
target could be uaed: the
c
13 reaction would require an enrichedtar-get. Also, the fact that the energy losa of deuterons ln the target
would be much leas than He3 nuclei would allow ua to use higher beam
intensities for a given target thickness and temperature. Further,
the second state of
c
1Z waa known to be populated in the N14(d, 0!)reaction (Hoyle 1953, Dunbar 1953), and presumably haa
a.
higher
-6-A schematic diagram of the equipment u1ed ia shown in Figure
z.
With a deuteron bombarding energy of 1.800 MeV, recoil carbonions at 90° in the laboratory system have an energy of 3. 6 MeV for
ground-state reactions. and
z.
5 MeV or 1. 7 MeV if the first or secondexcited states are formed. The corresponding alpha-particle energies
and angles, and also the flight time t of the
ell
ions through the85-em path length of the spectrometer, are given in Table 1. Recoil lone
of the proper momentum and energy were observed in delayed
coinci-dence with alpha particles of the proper energy and angle, the delay
being equal to the proper flight time for the io11. The tt;.ro pulses
(c12 and o:) were displayed on a dual- beam oscilloscope and
photo-graphed.
B. Taraet Manufacture
Target requirements for thla experiment were stringent.
Be-cause of the low yield, it was desired to have a high N14 content;
however the active layer had to be kept thin for the recoil lone. The
calculated stopping power of VN (vanadium nitride) for 1. 7 -MeV
e
12ions is about 400 X 10-lS eV cml/molecule: hence tho maximum
al~
lowed target thickness for VN would be about 1018 molecules/cmz for
a 10% energy loss in the target. The backing of the target had to be
transparent to the emerging alpha particles. yet strong enough to
withstand the beam and the target-making procedure.
Organic materials, such aa adenin• (C
5N5H5), although
at-tractive because of their high nitrogen content, had to be discarded
thought to sublime without decomposing (Gmelin 1936, Sime 1956).
However. all atten1pta at vacuum evaporation at temperatures from
950 °C to 1400 °C resulted in decomposition' no nitrogen could be detected on the targets. An attempt to evaporate sUicon 11itride
failed similarly.
Usable VN targets were made by evaporating vanadium onto
mounted C foils, and nitriding by heating in an atmosphere of
am-monia. An alpha-particle beam was used to heat the target. (See Figure 3.) The process is described in detail in Appendix A. The same procedure was tried with silicon, but apparently the
temper-atul'e was not aufficient to ca~oe nitriding. Vihen titanium was
evap-orated onto carbon foils, they invariably broke, but some success
v1as realized with Ti by evaporating before the foils were mounted.
Target composition was checked by elastically scattering 1-MeV
protons from the target at a laboratory angle of 150°. Using a
loj--inch clouble-focusing magnetic spectrometer, the protons scattered
from different masses in the region of intereet were well resolved. Figure 4 shows the profile of
a
typical target, and Table II lists thecompositions of the various targets used during the experiment.
De-tails of the calculation are included in Appendix·A.
C. Recoil-ton Detection
The alternating-gradient magnetic spectrometei" indicated in
Figure 2. has been described by Martin and Kraus (1956). The entl'ance
-8-5/3Z inch wide, 0, 963 inch tall, and 3. ZS inches from the target, it subtende a eoUd angle of 0. 011 •teradians, yet baa a mean width in the reaction plane of only Z. 4°. The path length through the magnet from target to detector ia 85 em. An image slit 1/8 inch wide was used for moat of the experiment. The elastic-scattering edge of pro-tons from
a
gold foU showed a momentum resolution of So/o for this slit. This large value of ~p/p was very uaeful to obtain a reason-able counting rate. For calibration, a l/3Z-inch slit was also used; the gold scattering indicated a resolution of 1. 3o/(l for this narrower slit.With the axis of the entrance aperture of the magnet set at
a lab angle of 90°, the object position was determined by finding the maximum counting rate with re•pect to motion of the beam spot. A B10 target waa bombarded with 1.17-M.eV protons; 1. 37-MeV alpha particles from the reaction B10(p,
a
)Be 1 were detected at the focus0
10 1
The detector at the magnet focus was a 1 x 14-mm gold- silicon surface-barrier detector manufactured by Oak Ridge Technical Enter-prises Corporation (ORTEC). Initially counters made in this labora-tory were uaed, but the commercial unit was installed before any .data were obtained.
The pulse from the detector was amplified as shown in Figure
Z by a fast-amplifier system consisting of a single triode (417A) pre-amplifier and four Hewlett-Packard type 460A wide-band pre-amplifiers. At the input to the aecond amplifier the pulse was cUpped to 40•nsec width with a aborted length of 93-ohm cable. The amplified posittve
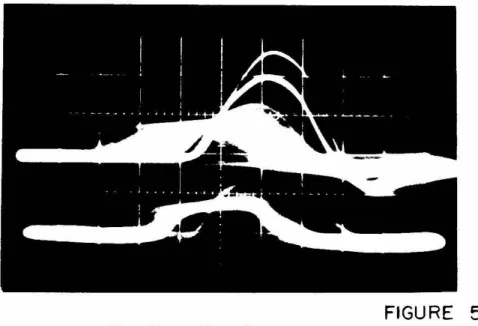
pulse was fed to the coincidence mixer and to the lower-beam input of a Te,ktronix type 555 dual-beam oscUloacope. The pulse height was about 1 volt for a 3-MeV particle; a vertical deflection of 0. 5 V /em was used. On the lower beam in Figure 5b, the two groups are deu-terons (1.13 MeV) and alpha particles (2.. 2.7 MeV).
The pulse from the detector was also fed through a 1000-ohm resistor to a low-noiae integrating preamp (OR'IEC type lOOA). The preamp output was connected to the internal amplifier of a 400-channel analy•er (Radiation Instruments Development Laboratories type 34-12.). These are also shown in Figure 2..
D. Alpha Detection
-10-outaide the chamber through a slot, with an 0-ring as a sliding vacuum
seal. In any currently designed chamber, the counter would more
logically be mounted completely within the chamber, on a rotating arm
concentric with the target rod.
A 1 ectangular slit is mounted in the counter holder to define
the solid angle of the alpha detector. A slit 0. 032. inch wide and 0. ZOO
inch high, about the same solid angle as the spectrometer aperture,
was u•ed in early runs, but eventual substitution of a slit 0. 060 inch
wide increased the coincidence counting rate and decreased the
de-pendence on the determination of the angle
e.
The effect of this changeis di&cuased in section IV D below.
Gold- aUicon surface-barrier detectors were made according
to the recipe of Dearnaley and Whitehead (1961). However after com ..
merctal counters were obtained for use at the magnet focus, our
mounting technique was changed, as shown in Figure 7, in imitation
of the method used by ORTEC. In these units, epoxy is poured up to
the level of the front surface of the silicon, and the gold is evaporated
over the entire front surface to make its own contact to the grounded
case. The signal lead ia made to the rear surface of the silicon with
conducting silver paint. The diode characteristics of three counters
made in thh fashion, using 900 0-cm n-type silicon, are shown in
Figure 8. An alpha spectrum from a ThB source, taken with counter
9F and the biased amplifier as in Figure 2., is ehown in Figure 9.
Although a resolution of 12.0 keV is not outstanding for a aolid-state
The .fast amplifiers shown in Figure 2 for the alpha channel &re Similar tO thOse in the
c
12 Ch&Jmel, With the "variable delay, I Iused to delay the alpha pulse by a time equal to the flight time of the
c
12 recoil ion, inserted between the first and second amplifiera.The delay consisted of from 0 to 255 feet of RG ll4/U cable, which could be switch selected in incrementa of one foot. The signal velocity in thie cable is 0. 85 c; hence each foot of cable corresponds to a delay of 1. 2 nsec.
The pubes from the alpha counter were higher than thoae from the
c
12 counter because the alpha energy was higher. Therefore less amplification was needed in the alpha channel in order to get the re-quired pulse height for operation of the coincidence mixer. It wau found that two of the Hewlett-Packard amplifiers could be replaced with type 460B' a, which have lower gain but also have lower noise level. The output pulses were fed to the coincidence mixer and to the upper-beam input of the oscilloscope; the pulse height of an 8. 5-MeV alpha particle was 1 volt (see the •econd highest group in Figure Sb). The scope gain 1.1sed waso.
5 V /em.12
In place of a slow amplifier system such as used in the C
-12-biaaee set to count first-state (a1) and ground-state (a0) alpha
parti-cles.
E. Coincidence Detection
A tunnel-diode coincidence mixer was used in thia experiment
(see circuit diagram, Figure 10). Tunnel diodes were also used as
dilcriminatora at each input of the mixer. Input pulses of the order
of half a volt were aufficient to trigger the diodes from the low-voltage
to the high-voltage portion of the characteristic curve. This low-level
switching characteristic was highly desirable because of the small
pulses produced by solid•state counters; any adclltional gain in the fast
c
12 channelled to oscillation. The amplifiers included in the mixerproduced a 20-V, Z·i!sec pulse for a count in either chartnel sufficient
to switch the tunnel diode. These "fast C1211 and "fast
a•
pulseswere counted and recorded as a monitor of the fast-amplifier gains
and of the firing levels o1 the diodes. The coincidence output was a
faat-rieing pulae suitable for triggering the oscilloscope sweep.
Both the upper and lower beams o1 the oscilloscope were set
to sweep on time base A. which was triggered by the coincidence mixer
as shown in Figure 2. The sweep time was 0.1 ~aec/cm, and xS
mag-nification was used on both beam• to give a resulting horiaontal scale
of 20 nsec/cm. During each sweep, a positive 20-V signal is provided
at the
"+ gate out" terminal of the time base unit. This pulse of
1-~aec duration (0 .1 tJ.Sec/ em X 10 em) was counted on a scaler as the
number of coincidences, and was abo usee as a gate signal for both
by the oscUloscope h a "delayed trigger output," which was set to give a pulee at the end of the sweep time. This 8-V •
o.
6-t.t.aec pulse wasused to trigger the fUm-advance mechanism of the camera. As an aid
to photography the regular P-2. green-phosphor cathode-ray tube wa.e
replaced by a CRT with a P-U blue phosphor. The response of our film was much higher in the blue region of the spectrum. Also the P-U phosphor baa a higher brilli&ACe and a much shorter persistence,
which is important because our came:ra had no abutter. We were able to phototp•aph persistent phosphorescence on the green tube for aa
much as half an hour after turning off an intense beam; no persistence
of a quarter of a second or longer was observed with the P-11 phosphor.
It had originally been planned to observe the pulse-height
spec-trum from the counter at the magnet focus. gated by the coincidence
mixer. However it soon became obvious that most of the
c
12 ions ob-served were in coincidence with first-state rather than second-statealphas. and furtherr .. "lore that separation of
c
12 froma
11 recoils (fromc
13(d, a)B11 reactions) would be difficult. (See Figure Z.lc.) ThuD itwas necessary to obtain correlated coincidence. spectra, and this wag
done in two way•. A simple but not always practical method was to
write down the addreseea from each multichannel analyzer as each
coincidence occurred, the difficulty sometimes encountered being the
"rapid" counting rate which averaged one count every five secands.
The other method was to photograph the dual-beam oscilloscope and to
measure the pulse heights recorded on fUm. The dead time for thio
-14-exposurea could be· recorded while the film was in motion. The film givea aa an additional piece of information the time separation of the two pulaea. This was useful beca\lae it allowed us to decreaae the time sensitivity of the coincidence mixer, and yet improve the .time
resolution of the eXperiment. Uae of a two-dimensional multichannel analyzer, auch aa has eince been acquired by the laboratory, would not have allowed thie time measurement, and would not have had better energy reaolutlon than the film ayatem.
It might have been possible to use an existing camera and Polaroid fUm to take our photograph&, but the retail coat of the film uaed would have been about $6000. Furthermore the dead time in-volved in developing each print and changing film alter every eight eventa would probably have more than doubled the running time of the experiment. Hence it was decided to design a camera to use film available in 100-foot rolla, and 35-mm fUm was chosen to obtain the largest practical negative aise. Much assiatance in choosing film and lens waa received from Mr. Robert Macek and Dr. Hans Kobrak ol. the Synchrotron Laboratory. Teats with their cameras showed that an extremely fast lens -waa necessary to record single sweeps at ZO nsec/ em, and that Kodak Llnagraph Pan fibn had better contrast and speed than either Trl-X or Royal-X Pan films. The fastest lens then available for 35-mm cameras, a Nikkor f/1.1, wa~t obtained. The camera deaign is shown in Flg\lre 11 and cliscussed more fully in
of the oacUloecope, ahown in Figure lZ, ia also described in Appendix B, aa is the film -developing procedure.
Not being designed for copy work, the lena was corrected only
for distances greater than three feet. Thue when used at six inches,
there wae coneiderable barrel dietortion, ae can be seen in Figure 5a.
However by using the same lena and the same geometry in an enlarger,
all first order dietortiona were corrected. Figure 5b was printed in
-16-IU. PROCEDURE AND RESULTS
A. Non-Coincident RecoU-lon Spectra
For a magnetic spectrometer, the energy of a particle of mass
M and charge Z ie given by (Brown 1951):
z
E=C Z
. m Mlz (11)
where Cm is a cont~tant depending on the radius of the equilibrium
orbit through the spectrometer. and 1 is the current reading of a
torsion-balance tluxmeter (Lauritsen 1948). Thua an energy spectrum
of the particles accepted by the magnet at a given curre,lt will llhow
aeparate groups with different values of zl. /M. Figure 13 is such a
apectrum, taken with the alternating-gradient spectrometer at a
set-ting 1/IZ.
=
16. 5, corresponding to a proton energy of 1. 85 MeV. Inthie spectrum two of the groupe are recoU carbon iona: those with
charge (4+) reault from first-state events, and the higher energy (Sr)
group comes from ground-state events. Identification of the groups
ia aided by taking such spectra over a range of momentum (magnet)
settings. Figure 14 is a contour plot of the energy spectra taken over
z
.
.
2the range 10.7 tilt 1/1 4i 58. 8; counts are plotted
!.!•
E and 1/I • The1/32-inch slit was us·ed at the magnet image, and each spectrum was
normalised to
z.o.
000 ground- plus first-state alpha particles countedin the chamber detector.
B. Non-Coincident Alpha Spectra
(aee Figure 9). A typical non-coincident alpha spectrum is shown in Figure 15. The four strong alpha group• above 5 MeV (bias is about 4 MeV for Figure 15) are identified by their energies as the three low-eat states of the reaction N14(d,a)c12,
a
0,~'and
a
2 respectively,
and the ground state of
c
13(d,a)B11• All the groups must be alpha par-ticlea because the counter bias was such that protons of 4 MeV or more would penetrate the depletion layer, resulting in pulses below the bias ~the amplifier.C. Procedure for Recording Coincidences
After positive identification of the various particle groups was made on the b&f.is of the non-coincident spectra, the experimental procedure was a• follows. First, the spectrometer current was var-ied and recoil-ion energy spectra were taken .to find the maximum
lZ. . '
non-coincident COWlting rate of C (4t) recoUs from first-excited-state events. (See Figure 16. Thie figure and aU others referred to in paragraph• C, D, and E of thia section refer to that p()rtion of the data which was taken on film 115. ) All counting rates are normalized to the number (~ + a0) of first-state and ground-state alphas observed in the chamber counter, with the angle
e
aet to approximately the proper value. Then without changing the magnet current, the delay was adjusted so that coincident pulses observed on the dual-beam oscilloscope occurred at the $&me time; Figure 17 is a multiple ex-po•ure showing five <fZ.(4t )-'\ colncidencee. Then the angle 8 wa•varied to find the maximum coincidence coanting rate for c1Z.(4+ )-'; events (see Figure 18). The maximum rate per 10,000 (~ + a
-lB-called R1•
After thus optimizing, the three par.unetere were changed to
the appropriate values for
c
11(3+ )-az events.Fluxmeter: lz •
~X
Yt
7ol)
Xi
a o. 910~
Delay:
Angle~
£
z.
a -'l+
Z4 feet0
ez
=
e
1 - 3. 1The camera W&li connected, and rune of 40 p.f on the charge integrator
(or about 375 p.coulomb of beam) were made. As each coincidence
oc-curred, the buz~er wired in parallel with the film-advance motor
sounded, and
an
attempt was made to record the addressee from the 400-channel analyzer (recoil ion) and the 100-channel analyze1· (biasedalpha spectrum) on a line with the frame number of the picture. Theee pulse heights were used to supplement the information on the
film, and also served as a continuous check on gains and the overall
performance of the system. The number of coincidences counted (number of sweeps of the oecllloscope) waa also noted, in order to
keep track of double and multiple exposures. Each sweep waa ·recorded
clearly even if the film was in motion; hence the dead time of t..'le sys-tem waa not determined by the half-second tUm-advance time, but only
by the 1-1-\sec sweep time of the oacilloscope. At the end of each charge
integration, the following numbers were recorded: elapsed t~me,
number (a
1
+
a0) of alphas of first-state energy and above (channel 30 and above in Figure 15), numbera
0 of ground-state and higher
of particlee in the recoU-ion channel energetic enough to trigger a coincidence. Tbu• a continuoua check on the triggering levels for the coincidence mixer wa• made, aa well as a check on target deter-ioration. Occasional photographs (such as Figure 5) ol non-coincident
spectra were taken as a check of gains and scope level ahilts. The result• of a run are contained in three numbers: R
1 •
c
1Z(4t )-a1 coincidence rate per 10,000<c;
+
a0);a
a (a 1+
ao)/10. 000;Counts
=
number of d-Z(3+ )-az events observed.D. Energy and Time NormaU•ation
After fUms were developed, they were projected onto graph paper using the camera lens, and forming an image the same siae as the original scope display. Each pulae height was estimated to
o.
01 em (probable error :tO. 03 em), and the horizontal separation of the centroids of the two pulses was estimated to 0.1 em (probable error :tO. 2. em). The graph paper waa adjuated so that the base line of the upper beam (alpha pulses) was on zero; correction was made in the normalization for the non-aero base line of the lower beam. At thisatage noise and peculiar pulse ahapea were rejected. Double expo-sures were also examined at this time; it was generally possible to correlate them properly by position on the fUm and by comparing pulse height a to observed multichannel analyzer addres•es, if
any,
butoccaaionally two events were so overlapped that it waa impoesible to decide which upper-beam pulae belonged to which lower-beam pulse.
· lZ
-20-event involved. For identification purposes, the second -20-event of a double exposure was given the negative of the frame number on which it occurred• all other events were identified by frame number. Of the 896 framee exposed on film fl5, 45 were non-coincident calibra-tions, U extra sweeps were recorded from double exposures. and
349 frame e were noise; thus 513 coincidences were recorded on film
115.
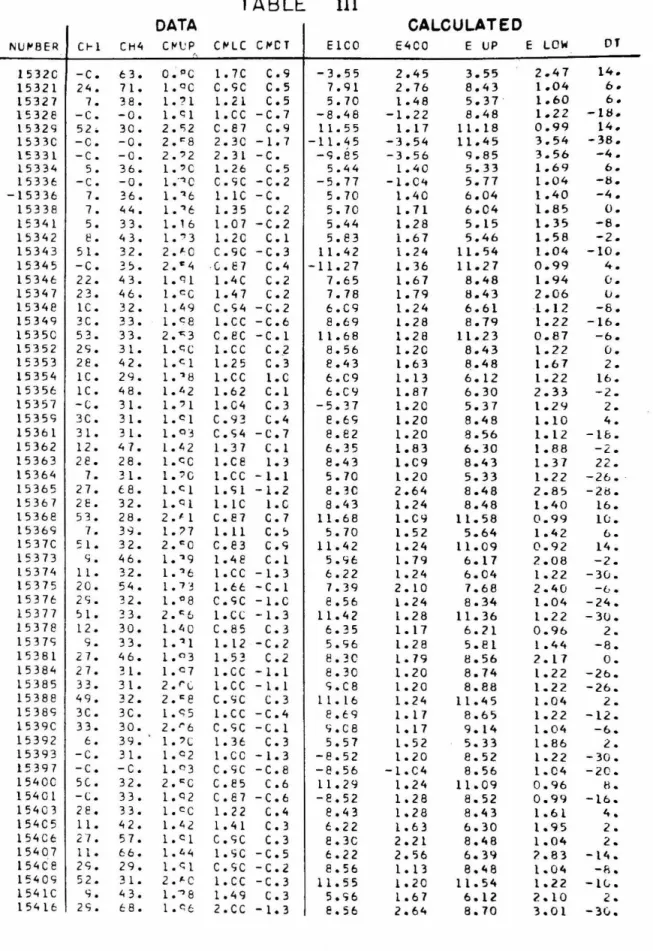
For each event, an IBM card was punched with the following six numbers: fUm and frame number, 100-channel address (alpha) if avaUable, 400-channel address (recoU ion) if available, upper-beam pulse height (alpha) in em, lower-beam pulse height (recoU ion) in em, and hori•ontal separation (positive if lower beam dis-placed toward the right) in em. The left half of Table Ul is an ex-ample showing the above information aa punched on cards for frames
3ZO through 416 of film f15. Where no entry was punched for an ana-lyaer address, an entry 11-0. '' appeare in Table UI.
Since gaine were adjusted each day, and subject to variation in any one day, the data were normalized in groups. The punched cards were fed to an IBM 7090 electronic data-proceseing machine in groupe of between 30 and 300, depending on gain ehifts or
three variables: both energies and tl".te time. J\11 estimate of the c,;c 1
-pulse height on the upper bea.."ll ·.YJas made, and the computer averaged
aU pulse heights within 10% of the estimate and set the result equal
to S. S2. MeV. Aeauming the oscilloscope pulse height proportional to energy, all upper-bearn pulse heights were converted into energie6
(E UP in Table W). Also, a linear relation betwe-en the addreaa o£
the lOO .. channel analyzer ancl the upper-beam pulse height waa found
by least squares, and the addresses were converted into energie~
(:£100 in Table lU). Uno address was given, the energy i:lOO was
set equal to E UP, but with a :minus eign to indicate that it was not
an inclependent measure of the energy.
The recoil-ion energy waa normalized in the same manner,
with the exception that the 400-channel analyzer address was the pli ··
mary standard when it was avaUable. Thie was done because of the
poor resolution of the lower beam on the film resulting from the
higher gain and higher noise level in the fast
<:fl.
channel as corn -pared to the faot alpha channel. (Con1pare upper-and lower-beal·nreeolutione in Figure 17.) Thue the averasee of all .addresses within 10% of an elitir.aated address for the
c
1~(~)
ion was set equal to 1. 706MeV. and the addrese wali assumed proportional to energy.
RecoU-ion energies E LOW and E400 (•ee Table W) were calculated from the lower bean1 and from the 400-channel analyzer a.ddreoa when available; again E400
= -
E LOW if no address was recorded.The time scale was normalized by averaging all valuec of thEl
-22-12
the C (3+)-a1 coincidences, and setting this average equal to At=O.
The horizontal ecale .factor was taken to be the o$CUloecope setting
of 2.0 nsec/cm, and a ~t was calculated for each event (DT in
Table W).
E. Determination of the Number of Counta
After the normalh:ation was completed. each event was added
into the appropriate location in
a
30X 27 X 20 array representing E UP, jE400I,
and DT re•pectively. (The abaolute value of E400 was taken because E400 had been given a negative sign if calculated from thelower beam instead of the 400-channel analyzer.) The range of alpl':'.a
particle energy was from 4. 62S to 12.125 MeV in
o •
.250 MeV •tepa;the range of recoil-ion energy was from
o.
875 to 4. Z50 MeV tn 0.125·MeV steps; and the range of .At waa from -52. 5 to
+
47. 5 neee in 5.o
naec steps, where ~t = 0 corresponds to a flight time of 162. nsec,and a negative At indicates a higher velocity ion. The three~dh~•en
aional array was printed out aa 20 separate 27 X 30 two-dimensional
arrays, each corresponding to a different value of t.t. The three
center sections (At • -5,
o.
and +5 nsec) for the data from film #15are reproduced aa Fi6ure 19 a, b, and c. The circled group is the
<f
2(3+ )-a
2 group. and contains l6 counts. The entire three-dimennion.al array ie plotted in ieometric projection
aa a
color·eoded correlatedI
coincidence spectrum in Figure 20. • Color is used to identify the ver-tical (ttine) axis, and
a
fot.:t"th dirnenaion is provided by the area of the*
It is not practical to provide copies of Figure 20 in color with repro-ductions of the thesis. However either a duplicate Z x 2.-inch colorslide or a.n 8 x 10-inch color print can be obtained at cost from the
Kel-log~ Radiation Laboratory. In 1962, the cost of a duplicate slide was
circle at each point, the area being proportional to the number of counts.
The figure sbowa the
c
12(3!-}-.vt2 group well separated from all other groups. at Ea
=
6.1 MeV. Ecu=
1. 7 MeV. and At= 0 nsec.The vertical colunms &long the left rear wall of the figure are
deuteroi11i in accidental coincidence with the various alpha-particle
groups. For the
a
0 and a1 groupe, they extend through all time fror.:1 -40 to +40 nsec; for the less energetic alphas with smaller pulse heights,
only deuterons within about ZO nsec registered as coincidences. Two
other groups beoides the group of interest occur at At
=
O: thec
1Z(3t-)-
c
1
13 11
group used for calibration. and also the C (d, a)B grow1d- state group.
which is the closest neighbor to the group of interest (see Table I). ~At
6t
=
-40 nsec, higher energyc
12(4+) ions straggled from ground-stateevents appear in coincidence with ground- state alphas. The remaining
group at l:.t
=
-30 nsec baa mass lZ (from energy and velocity determi-nations), but an apparent charge of 3}1 This can be explained byrecall-ing that first-excited-state events are 104 times as numerous as
eecond-state events. and noting that the energies for the group are approximately
these of the particles from a first-state reaction. Evidently the atruct,ure
of the magnet is such that a (4t ) ion can reach the center of the magnet.
and if it undergoes a charge-exchanging collision there it rr1ay continue
through the magnet aa a (3+) ion. A collision probability of 1 in 104
within perhaps 4 em of path length between the two segments of the
mag-net would be sufficient to produce the obaerved group. At a pressure
-6 0
of 10 mm Hg. this would correspond to a collision radius of 1. S A •
-Z.4-as a function of three variables is necessary to identify counts, the data of film *15 are also presented as functions of the single variables .At, Ea• and EC1 z (see Figure Zl). In each of thle figure the solid areas are the'Z.6 real counts identified from Figures 19 and Z.O, and the shaded areas are the accidental coincidences with elastically scattered deuterons in the recoil-ion channel. In Figure Zla these random coin-cidencee provide a measure of the resolving time of the coincidence mixer. In Figure Zlb the non-coincident alpha spectrum is reproduced (cf. Figure 15) by the accidental deuteron coincidences. Figure Zlc con£irms the statement made earlier that it is impossible to identify counts by observation of the coincident recoil-ion spectrum alone.
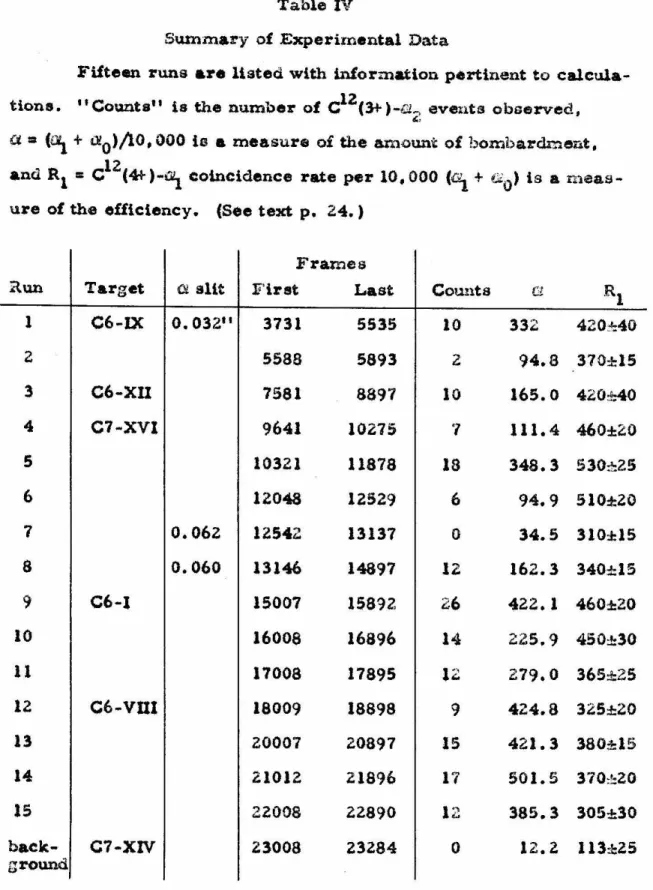
F. Experimental Results
After approximately 61 hours of running time with an average beam intensity of 1 .,.A, the total number of counts obtained was 170. The total of non-coincident ' \ and a0 was 4. 01 X 10 7• The value of
lZ R
1, the C {4+
)-a,_
coincidence rate which was ueed as a measure of efficiency, varied with changes in target thickness, alit geometry, and possibly with vertical beam position; an approximate mean value for R1 is 380, compared to the rate of
o.
042c
12(3+)-Cll
2 coincidences per 10, 000
("J.
+ a0). A summary of the data for individual runs is given in Table IV.which would have been sufficient to obtain 15 counts on an average target, or 0. Z counts from the nitrogen in the target used. No
c
12(3+)-a
-26-IV. ANALYSIS OF RESULTS
A. Equation for X' ra d/ I'
The ratio r'rad/ i' la the ratio of the number of ell surviving
to the number of
c
12*
formed in the second excited Gtate, or to thetotal number of a2 pro<h;.ced in the reaction. If ~2. is the efficienc;,.· of the oystem for detecting second- state coincidences,
r
rad.l:.'
=
lZ
observed C (3+ )-a
2 coincidences
• (12.)
The efficiency E
1 for detecting fir•t-state coincidences can be foWld
directly by experiment, since for the first state we know that
(!'rad/I )1 • 1; hence only the relative efficiency
E z./E
1 muet becal-culated.
12. .
observed C (4+ )-~ coincidences El • '
'i'"" ~rad
.t
total ' \ (13}
(14)
Besides the relative population factor P •
o;_laz
included explicitly inequation 14, the relative efficiency includes three correction factors.
The most obvious, C, concerne the ratios of the varioue .ionic-charge
states of the recoiling nuclei, since we observe only a single charge
state at a time. The second, 0, has to do with differences i~ the
ef-fective solid angle for the two states, including the effects of
defiec-tiona of the recoiling nuclei by gamma emission. The third correction,
T, has to do with the momentum widths of the recoil-ion groups from
Then
or
E ~/El ::r C X G X T
CU(3+ )/Cll(total) at 1. 71 MeV
x
e:: Clz(4+ )/Cl2(total) at Z. 51 MeV
X effective d 0 for second state X eRective
an
lor first state01 nd lZ
X -,o of Z state C group in momentum window (lS)
o/o
of 18t statec
1Z
group in momentum window •i'"'rad Counts X P
r
=
aR1 CGT •
r
racl Counts' .li. •
w
where- CGT
w
= -p-
xa
R1 • (16)Now the number W · is proportional to the number of count :3 v;hich would
be
obtained if there were no statistical fluctuations; thus th0 p~r cent stathtical error for a given run is proportional to1/..fW .
If the result of each run is to be weighted inversely as the square of the error • thepro~r weighting factor is W. But
hence
W X
r
_,/f'
=
Counts~ ra""(
i"
r~d
)'=
·
I
avg.1; ~Counts)
(W) (17)
Calculation of the various factors appearing in equation 16 and finally
-2.8-B. Population Factor, P
From the alpha-particle spectrum of Figure 15, taken at the
bombarding energy Ed • 1. 800 MeV and the angle 8 • 67° used in the experiment, the factor P is
(18)
P was meaoured ·at several energies and angles, and was found to be
nearly constant between 1. 7 and 1. 9 MeV and between .67° and 71°. It.·
is interesting to compare this result (equation 18) with the value P
=
17 obtained by Hoyle (1953) and Dunbar (1953) at a bombarding energy of6 7.2. keV and at a lab angle of 90°.
c.
Charge-State Factol", CTo determine the charge-state ratios of carbon ions emerging
from one of our VN targets. an elastic-scattering experiment was done.
Alpha particles from the Office-of-Naval-Research tandem accelerator
in Sloan Laboratory were ueaed to bombard the carbon-foil backing of target C5-U {Table II), and
c
12 ions from Cla(l-:te4,c
12)He4~ere
ob-aerved emerging from the VN side of the target at a laboratory angla
10 . .
of 3~ • The recently installed 2.4-inch double-focusing magnetic
spec-trometer (Groce 1962.) was used to analyze the emerging beam, and was
varied to observe as many charge states as possible at each of three
bombarding energies. The maximum solid angle (::::: 0. 014 steradian)
of the magnet was used, and the image slit was
i
inch '-'Vide. Thede-tector was a surface-barrier counter, and the energy spectra were
wae eet to include the
cfZ
peak, which occurred at the same energy£or each setting of the magnet. Another solid-state detector within the
target chamber wae eet at about 90° and the elastically scattered alphas
were used as a monitor of the charge integration aud target
deteriora-tion.
At each of the three energies, which cor:·esponded to
ground-state, first-ground-state, and second-state recoU energies from the N14(cl,a)c12
reaction, the magnet was set at the appropriate value to obaerve a
prominent charge group, and the bombarding energy was varied to find
the
:maximur~t
counting rate. At the angle chosen, thec
12 recoil hashalf of the energy of the incident particle; however because the ions
pass through about half the carbon backing and aU of the VN layer, the
bombarding energies (given in Table V) had to be considerably higher.
At each bombarding energy the magnet current wa• changed in
propor-tion to l/Z2 to observe the charge states
z.
Shown in Table V are the experimental results in the form of the
12 '
C -counting rate divided by the alpha-counting rate in the chamber
counter. Three or more readings were taken at each charge; the
er-rore quoted in the table are either the spread of the readings or the
statistical error, whichever was larger.
The data £rom Table V are converted into ratios in Tabl-a VI.
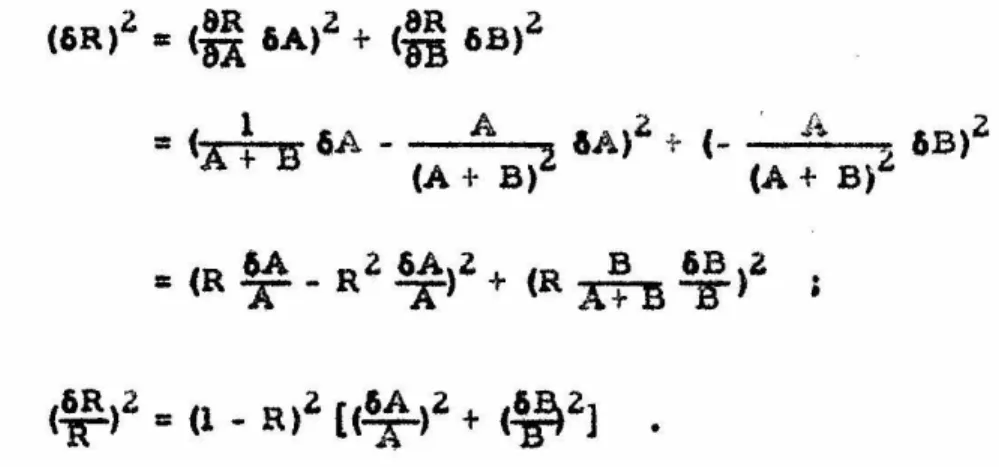
The quoted errors were calculated as follow a. Let the ratio corres""
-30-where B represents the sum of &11 other charie states beside3 .;-'\..
Then the square of the error in R is
(6R)~
=
(~ 6A)~
+
(~ 6B,:~
( 1 6 " A 6A)2 .to, ( - • A 6B)z.
=A+B.f:..-
2
z
(A+ B) (A+ B)
(R 6A
a-'
6A)Z + (R B 6B)z
=
r-
A
A"+"nT
'
•(19)
It should be noted that the errors quoted in Table VI are purely
statis-tical and do not include estimates of systematic error. Repetition of
the experiment under more adverse conditione (instability of the
mag-netic-field-measuring device and rapid deterioration of the target)
indicated that the errore should be doubled. The charge ratios from
Table VI are plotted in Figure 22. as a function of the velocity of the
ions.
The charge•ratio factor C is a ratio of two ratios. Though
it ia hoped that systematic errors should be reduced hy taking ratios.
the quoted errors in Table VI are doubled.
C _
c
12(3+ )/C12.(total) at 1. 71 MeV- Cli (
4+ )/CU
(total) at 2.. 51 MeVC
=
0. 485o.
341
*
*
0. 007o. oo7
D. Oeometry Factor, 0
The initial direction of a recoiling
c-z•
nucleus may be changedby gamma-ray emission. A first-state recoil at 90° has an energy of
z.
511 t.~eV and a momentum of 1.37 MeV/c; emission of the 4. 433-MeVy-ray may deflect it by
a•
much as 1. 07° ~ Similarly the momentum of a second-state recoil is 195 MeV/c, and emiasion of two y-rays with a total energy of 7. 656 MeV will deflect the nucleus 2.1.5° if both y-rays are in the same direction and at right angles to the path oi the ion. Ingeneral, ae many recoU ions will be deflected into the magnet entrance as are deflected. away from it. However since the alpha-particle
direction depends only on the initial c:lirection of the recoil ion, an ion deflected into the magnet aperture may not be in coincidence with
an observed alpha particle. The ·losses will be greater fo:r the second
state because of the greater possible deflection, and hence the relative efficiency wiU be affected.
Since both the spectrometer-entrance alit and the alpha-counter
alit were tall compared to their widths. and the alpha slit was at least 2. 8° taller thail the spectrometer aperture, only the horizontal com•
ponent of the deflection waa considered. Figure 23 shows the notation
uaed in the calculations. The center of the rectangular alpha alit, R,
. lZ• o
u at the angle 0
0 corresponding kinematically to C recoils at 90 ,
and the angle (} is the angle determined by kinematics to correspond
u•
oto a C ion with an initial direction different trom 90 by an amount
-6. Momentum p y ia carried off by the emitted gami'j:la or gammas,
-32-horiaontal plane. For small angle•, the angle "' is proportional to
the component p of
p
parallel to the beam axie. Thuo k:nowlecl;zem
'Vof the probability distribution for values of Pz determines the
prob-ability distribution for "'·
The derivations of the probability functions '\V
1 ("') for the first
state and W z("') for the second state are given in Appendix C. If the
emiasion of the 4. 433-MeV y-ray from the first state is isotropic.
which we assumed to be the case, then the distribution W
1("') is
rec-tangular (see Figure 2.4). The situation for the second state le more complicated. The first y .. ray, 3. 22.3 MeV, ie isotropic, but there is
a strong angular correlation between the two EZ -y-raye. (From
Fig-ure 1 the level scheme is ()t, Z+ , 0+. ) If ® is the angle between the
two y-raya (Frauenfelder 1955),
W(cos ®) :a:: 5/8 (1 - 3 cos2 ®
+
4 cos 4 ®) • (2.1)The z•component of the vector sum of the two y-rays must be
consid-->
ered; the magnitude of the momentum p will vary between the sum
y .
(7. 656 MeV /c) and the difference (1. ZlO 'MeV /c) of the tvv'O garnmas with
a probability distribution derived from equation Zl. The final r~sult
for V! z("') i l ohown in Figure Z4. Note that both curves in Figure Z4
were calculated with 6
=
0; there will be a slight variation with 6be-cause the initial momentum of the recoU ion ia a function of 6.
The probabUity of detection as a function of 6 and "' depends
upon the geometrical openings of the two slits, R(6) for the :-ectangular
rectangular alpha slit is not located on the equator of the spherical co-ordinate system defined by the beam axis, its projection on the
surface of the sphere is curved. The shape of a rectangle projected
onto a sphere is derived in general ln Appendix D,. and drawn for
two positions of the same slit in Figure Z5. The pertinent value of
6 0 is 6 7 .18°; the shape at 10° is included only for contrast.
Fortu-nately the elliptical slit is on the equator• ite shape is given by the
curve marked '• ground state'' in Figure Z6.
- lZ
Neglecting the vertical component of p 'V , the recoil C and
the t.i::-particle are at the same inclination
cp
from the horizontalplane. Hence the minor of the two functions R and E,
~(6, "')
=
min {R [ 6(6)) , E(6, "')} , (ZZ)determine• the probability that both the alpha and the
clZ
will bede-tected. (Account was also taken of the fact that the opening
repre-sented by the function R(6) was not necessarily at
cp
=
O.) The totaleffective solid angle for coincidence detection is
dO
=
s
d6s
W(q,) \l/(6,+)chll •
(23)This expression was integrated numerically with an IBM 7090 computer
for several different rectangular slits and for the two angular
probabil-ity functiona
w
1("') and
w
2("') given in Appendix C. The integral1(6)
=
S
W (q,)~
(~,
"')&II
for the slit 0. 060 inch wide and 0. ZOO iuch highis shown in Figure Z6 for the first state and the second state. The
-34-the second-state curve at -3° i8 due to -34-the odge of -34-the rectangular •Ut.
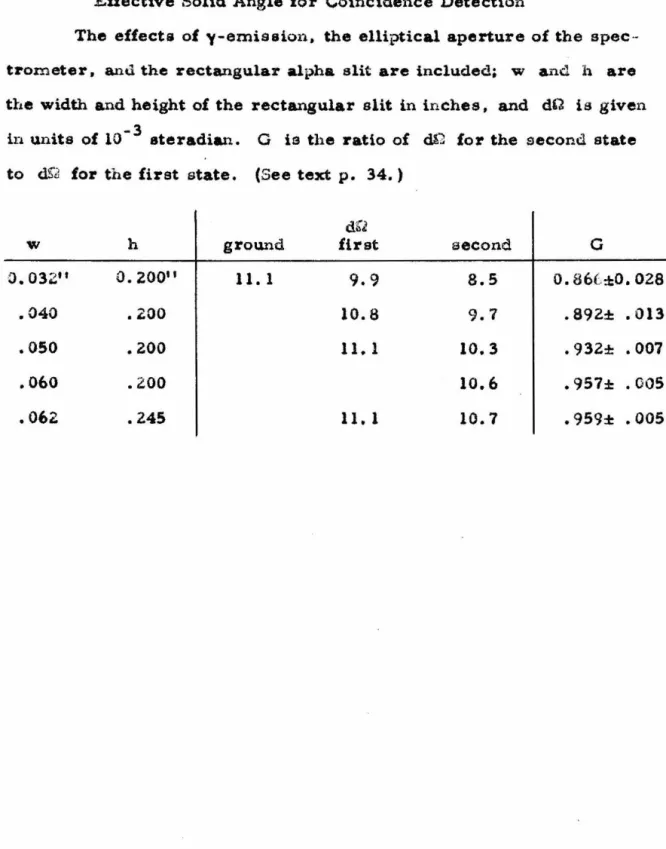
The results of dQ for the several cases are given in Table VII.
The geometrical correction factor G is the r•.tlo of dg for the second state to dC for the first state. The probable error in the
calculation of 0 was estimatad on the assumption that the probable error of each calculated c:Ul is 100/o of the difference between dO and the maximum value, 0. 0111 steradian. Values of G are also given
in Table
vn.
E. Thickness Factor, T
If all of the ell ions entering the magnet aperture have momenta within the 5% resolution width of the magnet. they would presurnabl!f
ll
all be counted. As soon aa the momentum widh"l of the C group ex-ceeds So/o , a correction must be applied to the counting efficiency.
There is also a correction to the relative efficiency since the width
of the group ia a function of energy.
The first cause of width is target thickness. Using the mean square charge for
c
12 ions from Table VI, and proton ::Jtopping power data of Bader (1956) for V and Reynolds (1953) for N, the energy lossof ell ions at the energies of interest in VN canabe calculated from the relation that dE/dx will be
zl
times dE/dx for protons of theoame velocity. Thia la clone in Table
vni.
.Abo in Table VIU are the calculated energy losses at each of the three ion energies for thevar-ious targets used. This calculation was done aeeuming a VN layer
incident beam, so the number is divided by C'Oe 30°.
Another source of momentum width ls kinematic or dE/d6 broadening, including the extra width allowed by 4eflectton of recoil lone into the magnet aperture by -v-emlssion. For the full width at half maximum of the energy spread from this cause, it is only neces-sary to measure the width of the curves of Figure Z6. The values of A6 and the corresponding AE
6 are entered in Table VDI. Actually the distributions in Figure Z6 are functions of the rectangular slit uaed, but the full width at half maximum ia virtually unaffected.
The final source of momentum broadening considered io the longitudinal component of the momentum of the emitted gamma rays. The probabUity dhtribution for a single component of the gamma momentum has already been calculated and is represented by the db-tributlons W(+) in Figure Z4. The angle
+
(in radians) is the ratioof PziP• Pz could just a• well be the longitudinal component, and
then AEY/E =
z
Ap/p =z"'.
The full width at half maximum.6"'
a.~d the corre spondlng AE are also given in Table VW. ·y
-36-calculated momentum widths.
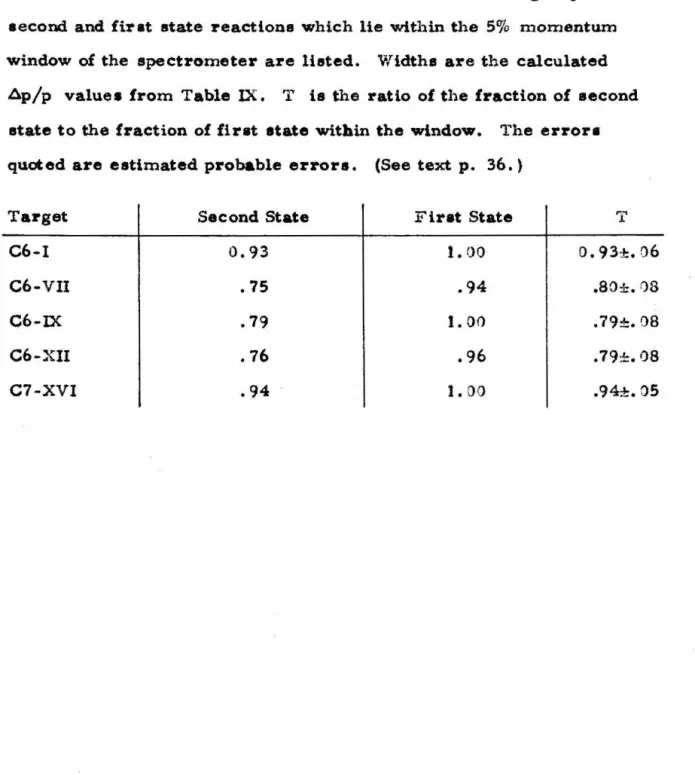
The factor T required for the relative efficiency is the ratio of the per cent of the second-state group which is within the 5"/.,~ mo· mentum window of the spectrometer to the per cent of the first-state group within the window. These percentages are again calculated in a simple manner by assuming the group profile to be square with a width given by Table IX. Results and estimated errors for T are given in Table X. The error. of the ratio is taken to be 25% of the amount of the correction, 1 - T, combined with
an
additional 5% esti-mated systematic error, from comparing different calculations.F. Calculation of l""'rad/f'
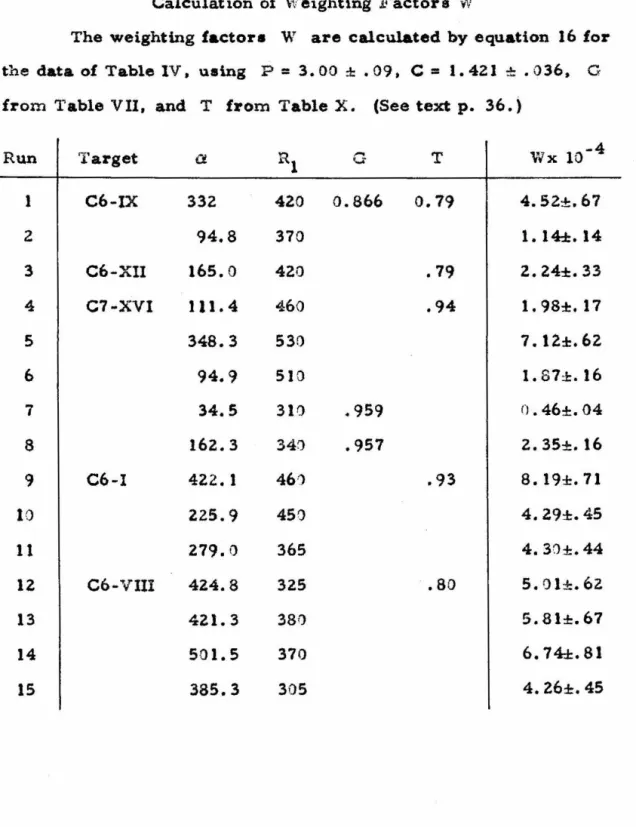
We now have measured or calculated all factors in equatio11 16.
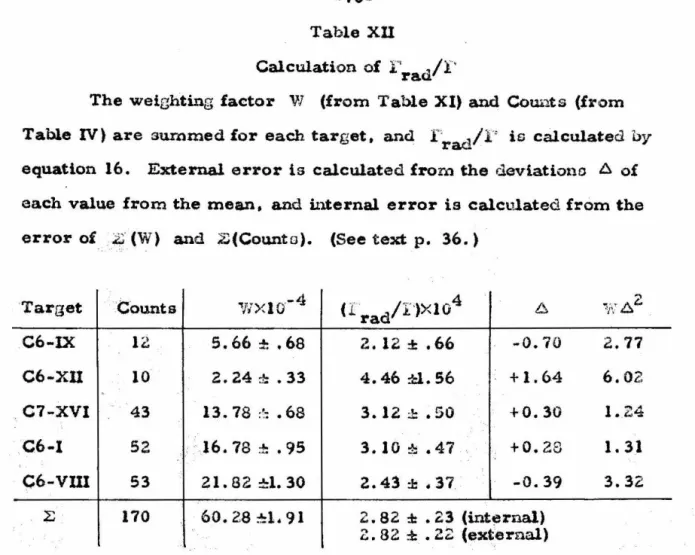
In Table XI the weighting factors W are calculated for each of the individual runa listed in Table IV. The data for each target are then treated as separate samples •. and the values of f'rad/r for each are calculated in Table XU and plotted in Figure 2.7, The mean value
of ~'rad/f· ia also calculated, from equation 17.
The internal error is calculated from the statistical error of 170 counts and the standard deviation of Z W, and the external error from the deviations of the five data groups from the mean. Combining the external error with an estimated So/o systematic error in the quan-tity T, the result of the experiment is
r rad
r
=
4v.
CONCLUSIONThe result of this experiment is not significantly difierent from
that of Alburger (1961). given in equation 6. Averaging our value with
Alburger's, we obtalD
::crad -4
... , a: ( Z. 9 :i: 0. 3)X 10
i (ZS)
Using the value for 'i' diacuased in section 1 B,
r
c ( 8 :t: 5) eV, weobtain
I"'rad • (0. 0024 :t O. 0015) eV • (26)
This result
ia
onlya
factorot
2f
higher than that used by Salpeter (1957)in hie energy-production-rate calculation
a.
With our value for f'rad,equation 5 becomes
p
zx
3E • 3.3 X 10²¹ 5
~
Ta
f exp(-4
?·
2) erg/g sec,
.
8
and the reaction rate for the formation of
c
12 182 3
P
=
,..,.
8 X 1026 - -.. -P5 XOt f exp (- -.=--) 43 2 reactions/g sec,T 3 ~a
8
(27)
(28) '
where p
5 is density in 10
5 g/cm3, xa is the mass fraction of Hc4
, T 8
is the temperature in 108 °K, and f
i~
the electron screeningcorrec-tion given approximately by (B2 FH 1957)
P5
i
f =s exp [ 0. 88
(-::-3 ) ]
T8
The mean lifetbne for an alpha particle is given by
-38-f exp(-
~)
eec-1 • 8This function, neglecting f, is represented by the curve labeled
(30)
3 He4 -
c
12 in Figure 28, calculated for Ps xa=
1. For comparison, the lifetime of acl
2 nucleus in, the reactionc
12(a.
y)o16 is also plotted.The latter rate depend• on the unknown alpha width of a level at 7 .lZ ?
·ev
tn
o
16, just 40 keV below thec
12 +a
threshold. Fowler and Hoyle (1962) estimate 8a.2 • 0. 78 oro.
024, the former value being preferred2
theoretically and astronomically. With 60: • 0. 78, the lifetime
12 12 .
orO!(C ) for a C nucleus, in years, as given by
log
""acct
2) • -23.23- log p5xa+
Zlog T 8 + 30. 08+
0. 18T
I/3
T2/3
8
8
(31)
and if 6a2
= 0. 024 the constant on the right becomes -21.72. Curves for
2 2
both values of 8a are ahown in Figure 28; the solid curve is for 8a
=
0. 78. An experiment by Larson and Spear now in progress L, Sloan and Kellogg Laboratories may determine the c12(a, y)o16 rate more pre-ciaely.Thus the rate. o1 the 3a process as a function of density and temperature is now known to about 61 Cfo, the major 110urce of uncertainty
betns
the total width of the 7. 656-MeV level inc
12• In this experiment,rrad' it would be neceaaary to increase the accuracy of the determina-tion of
r.
A repetition of the inelastl'c-electron-acattering experiment to determine the absolute value ofr
e* might be called for. ,;.:). reduc-tion in the error aaalgned to the EO matrix element from Z5% to 10%would provide
a
final result forr
rad withthe
error reduced to 40%.-40-APPENDlX A Thin Nitrogen Targets 1. Carbon- foil backing
Microscope slides were cleaned thoroughly and then wet with glycerol. After the glycerol had been allowed to drain for an hour, the slides were placed in a vacuum system. A day waa allowed to pump off the glycerol, and then carbon waa sputtered onto the elides. To obtain a thick layer of carbon (- 40 f.!.g/cm2), &puttering was done in four fifteen-minute periods, with about fifteen minutes for cooling be-tween each.
The carbon on the slide• was divided into from ten to sixteen sections
'"th
a scribe, and the foUa were fioated ofl the slide in a shallow dish of distilled water two at a time . They were then lifted from the surface of the water on tantalum blanks which had a 1/4-inch or 5/16-inch hole. The foU had to cover the hole, and great care had to be taken to prevent wrinkles. Although lt was easier to mount foUa on clean blanks, it waa found that the foUs would adhere more perma -nently to blanks which had been.Ughtly greased with vacuum grease.Z. Vanadium evaporation
system after evaporation to try to prevent oxidation.
3. Nitriding
The nitriding procedure waa to heat the target with an
alpha-particle beam at the straight-throuah port of the 2-MeV Van de Oraatf
machine. Diatilled ammonia was admitted to the chamber. a a shown
in Figure 3. The ammonia was first frozen (liquid N2 temperature),
and contaminants were pumped off. After being warmed and frozen
three times, there was no change in the thermocouple-gauge reading
when the (frozen) ammonia flaak waa opened to the ayatem. Thus any
oxygen waa removed from the ammonia, but water waa froze11 with
the ammonia. ln order to keep water froaen during the nitriding, the
ammonia flask was cooled to dry ice temperature, where the vapor
pressure of NH
3 ls •3 mm Hg and the vapor preaaure of H20 is 0. 00055
mm Hg.
The pressure of NH
3 in the chamber during nitriding was of
the order of 1 mm Hg. With the differential pumping and cold trap
arrangement shown in Figure 3, no change was noted in the preasure
in the accelerator column.
A beam of alpha particles (typically 0. 8 ..,.A at 700 keV) waa
uaed to heat the target to red heat,_ temperature being controlled by
the needle valve controlling the ammonia pressure. The only analysis
of the beam energy was done by the mass-separating magnet, but that
deflected the beam enough to provide a :aignal for regulating the energy.
The target was moved so that the entire central region wan heated;
-42-ta~get as completely as possible. About 20o/o of the foUs were b~oken during nit~iding.
4. Composition
Protons of 1 MeV we~e scatte~ed £~om each target at the electrostatic-analyaer station of the Z-MeV Van de Graaff. Scat-tered particles were observed at a laboratory angle of 150° with the lOt-inch double-focusing spectrometer. Using the equation derived by Snyder (1950) for yield from a thin target in such a apectrometer, we have
where
nt .
z
Rc
15 (' N . (I) cos81 •
'i"q1l
X 10J
+
Cilnt c:
•
thickneas of target in nuclei/cmz angle between beam and target normal Rc c: resolution determined by slits at collector a
=
croes ••ction of reaction •4•~
q
=
charge deposited0 a •olid angle of spectrometer
(Al)
Nq(I)
=
number obaerved per charge q at fluxmeter setting I From the concurrent work o£ Renken (1963),R
e
=
Q
=
307
-3
1. 47 X 10 steradian q
=
9. 28 f.LCOulomb18 1
r
N~(I)nt c 3. 43 X 10 X X \ - dl
(fcT J
em
(AZ)
For the various elaatle-acatterina cross sections we used
dZ:
188 rnb/ eter (Jackson 1953}Nl4: 109 rnb/ ster (',l'autfeat 1955)
016: 154 mb/ ater {Eppling 1953)
y51: 787 mb/ ater (Rutherford 1911)
The scattering yield from a typical target is shown in Figure 4.
and the calculated compositions for the various targets used are given
_
..
_
APPENDIX BCamera and Film Developing
The optical properties of the Nikkor f/1.1 lens were measured on an optical bench. The focal point F in object space was found to be 0.17 2 inch in front of the frontmo at metal ring. the focal point F' in image space is 0. 825 inch behind the rearmost metal piece, and the focal length waa measured as
z.
03 incheG. The locations of the foci F and F' and the corresponding principal planes H and H' are shown in Figure U, referred to the rear surface of the mountingring. This stainless steel ring.
o.
349 inch thick, has six 4-40 clear-ance hole a on a 2. ZOO-inch circle, and could be used to mount the lens to other equipment. The dimensions given correspond to a range set-ting on the lens of six feet; there h travel 0. 064 inch either way from this position.For a magnification of 1/3, the film plane had to be
i
Xf=
O. 68 inch behind the plane F'. as shown in Figure 11. The range over which the camera can be focused in this configuration ie approximately oneinch. If the spacer ring in Figure 11 ia removed, the distance settings on the lens should approximately correspond to actual focus.
parallel with the fUm-advance motor to warn the operator. Each
advance is also counted on a mechanical register in the power supply
unit.
The fUm used wa• Kodak Linagraph Pan, LP417 in 100-foot
rolls. It was developed in a Morse G-3 rewind tank, using D-8
de-veloper, as follows:
1. Prebath, Kodak" Ph.otoflo, 11 Z min.
2. Develop, D-8, 68 °F, 9 min.
3. Stop, lo/o HAc, 2 min.
4. Rinse, running water a 2 min.
5. Fix, fr "Rapid Fixol" + liquid hardener, 6 min.
6. Rinse, running water, Z min.
7. Clear, Kodak "Hypo Clearing Agent, 11 2 min.
8. Wash, running water, 6 min.
9. Photoflo, 2 min.
10. Dry.
Because the lens was used so close to the object, a serious
barrel distortion was introduced, aa shown in Figure Sa. Therefore
an enlarger was constructed using the camera base plate and lena.
and modifying a Beattie-Coleman ground glass holder for use as a
film guide. Note that it h disastrous to use a bulb with too high w
at-tage, since the cement used