Spatial Crime Patterns and the Introduction of the UK Minimum Wage
Kirstine Hansen* and Stephen Machin**
December 2001
* Department of Sociology, London School of Economics
** Department of Economics, University College London and Centre for Economic Performance, London School of Economics
Abstract
In this paper we consider the connection between crime and the labour market in a different way to existing work. We focus on a situation where the introduction of a minimum wage floor to a labour market previously unregulated by minimum wage legislation provided substantial pay increases for low paid workers. From a theoretical perspective we argue that this wage boost has the potential to alter peoples’ incentives to participate in crime. We formulate empirical tests, based upon area-level data in England and Wales, which look at what happened to crime rates before and after the introduction of the national minimum wage to the UK labour market in April 1999. Comparing police force area-level crime rates before and after the minimum wage introduction produces evidence in line with the notion that changing economic incentives for low wage workers can influence crime.
JEL Classifications: K42; J31; R15.
1. Introduction
Crime remains an issue high on the public policy agenda. Expenditure on crime related issues is now the fourth highest government expenditure after health, education and defence. Placed in this context it is probably not surprising that, over the years, a large amount of research, in various social science disciplines, has attempted to explain crime patterns. An important strand of this research concerns possible links between crime and the labour market. The vast majority of existing work in this area focuses on crime and unemployment, but a lack of consensual evidence has rendered the relationship to be fragile at best (see Box, 1987; Chiricos, 1987; Freeman, 1999). More recently empirical work has instead focused on connections between crime and the low wage labour market (Gould et al, 2002; Machin and Meghir, 1999; May, 2001) and this work has been more successful at establishing significant correlations.1 When coupled with the observation that many crimes seem to be committed by people in work (Fagan and Freeman, 1999; Grogger, 1998) this seems to demonstrate the existence of a connection between crime and the low wage labour market.
At the same time some research in economics has emphasised that comparisons of outcomes before and after minimum wage changes, if properly formulated, can provide a useful way of measuring the impact of changes in the low wage labour market. There is by now a sizable literature on the employment effects of minimum wages that takes this precise approach (Brown, 1999, gives an up to date review of the literature). Other work (DiNardo, Fortin and Lemieux, 1996; Dickens, Machin and Manning, 1999; Lee, 2001; Dickens and Manning, 2001) has linked changes in wage inequality to minimum wages,
1
arguing that at least part of the recent changes in wage structure can be attributed to shifts in minimum wages.2
In this paper we draw on the approaches used in the minimum wage literature to try and measure the impact of changes in the low wage labour market on crime. This offers a rather different way of looking at crime and the labour market than in earlier work. For reasons we argue throughout the paper, we also think this a better methodology to adopt as it uses minimum wage changes in a quasi-experimental setting where low wage workers are given a wage boost by the policy introduction. If it is these workers who are likely to be on the margins of crime then the wage boost offers a potential route for them to desist from partaking in criminal activities.
There are good theoretical reasons for believing that this is a sensible research strategy. Basic economic models of criminal behaviour (Becker, 1968; Ehrlich, 1973, 1996) emphasise that decisions by individuals who are on the margins of crime are likely to be shaped by changes in the perceived wage returns to legal and illegal activities. If the minimum wage introduction yields a big enough wage boost to such individuals then it is possible that they may alter their behaviour by cutting back on crime. This is what we explore in this paper by estimating empirical models that relate changes in crime to the incidence of low pay across the police force areas of England and Wales.
The remainder of the paper is structured as follows. Section 2 describes the introduction of the minimum wage to the UK labour market, along with its relation to area wage structures and area crime. Section 3 details the data used in our empirical work, then discusses some descriptive statistics and initial findings. Section 4 then
2
discusses econometric estimates of area crime models. Finally, section 5 offers some concluding remarks.
2. The Introduction of the UK National Minimum Wage
The UK National Minimum Wage
In April 1999 the UK government introduced a national minimum wage into a labour market that was not previously regulated by minimum wage legislation. It was set at £3.60 for people aged 22 and higher, and at £3.00 for those aged 18 to 21. This was the first time there had been a systematic wage floor in the UK at the national level. The old system that had operated up to its abolition in 1993 - the Wages Councils – only regulated the wages of workers in certain (usually low wage) industries.
Metcalf’s (1999) ex-ante analysis of the introduction of the minimum wage predicted that the minimum wage would increase the wages of around 9 percent of the workforce. Amongst these beneficiaries he estimated the average wage increase to be of the order of 30 percent (Metcalf, 1999, Table 5, page F59). This is clearly a sizable wage gain. That a large number of workers (though probably not as high as Metcalf’s 9 percent) benefited is borne out by the ex-post study of Labour Force Survey data before and after minimum wage introduction by Dickens and Manning (2001). Their study shows a significant impact of the minimum wage on the wage distribution, with around 6 to 7 percent of workers getting wage gains. Interestingly, whilst they show sizable gains at lower percentiles of the distribution, they also report very little evidence of spillover effects up the wage distribution.
The Impact on Area Wage Structures
areas with a higher proportion of people paid beneath the minimum the year before its introduction there should be a bigger effect on the area wage structure, as wage levels should rise by more than in areas where a smaller proportion of workers are paid beneath the minimum wage. This variation provides us with a quasi-experimental structure with which to analyse the effect of the minimum wage on criminal outcomes. This structure is obviously rather similar to some of the more recent economic studies of the impact of US minimum wages on employment: for example, Card’s (1992) study where identification of the impact of the early 1990s US minimum wage increases arises from regional variations induced by differences in the proportion of low wage workers across different US states.
Differential Changes in Area Wage Structures and Crime
If one can establish that the impact of the minimum wage was different across different areas then this provides a means to test simple economic models of crime that assert economic incentives matter for crime. The usual formulation of these models is such that individuals weigh up the expected benefits and costs from crime, taking into account a probability of being apprehended and punished if caught, and that monetary returns (from legal labour market factors and from illegal criminal activities) can affect their cost-benefit calculation (see Becker, 1968, or Ehrlich, 1973, for the classic expositions). From an empirical perspective the model easily translates into a criminal participation equation that relates crime to labour market wages, the wage returns from crime and measures of deterrence and punishment if caught (see Freeman, 1999).
crime in areas that are differentially affected by the minimum wage introduction. The prediction that follows from the basic economic model of crime is that, to the extent that the minimum wage impact on wages does differ by area, crime should be moderated in areas where there is a higher initial level of low wage workers. Of course, we also need to control for possible shifts in the other determinants of crime and we are careful to do this in our empirical models (this is discussed below). Furthermore, one needs to ensure that any link we may pick up around the period of minimum wage introduction is not a relationship that exists anyway. Our empirical work therefore also benchmarks our basic findings against the relationship between crime and low wages in earlier time periods where no minimum wage legislation was in place.
3. Data on Crime and the Labour Market and Descriptive Analysis
Crime Data
For our basic analysis of the relationship between crime and the low wage labour market before and after minimum wage introduction we use data on offences reported to and recorded by the police at police force area level in England and Wales over a two year period. The first period is the financial year prior to the introduction of the national minimum wage (April 1998 to March 1999) and the second is the year following its introduction (April 1999 to March 2000).3
There are 43 police force areas in England and Wales. However, for the purposes of our research we aggregate these to form 41 areas. This is for two separate reasons. First of all we aggregate the City of London and Metropolitan police force areas to a
3
single London aggregate because the crime rate is artificially high in the City of London (due to its low population).4 Secondly because of a boundary change that occurred in Gwent and South Wales in the mid-1990s (and because some of our models use data from earlier periods) we aggregate these two Welsh police forces together as well.
We look at four different crimes: the total number of notified offences; the number of property crimes (defined as burglary plus theft and handling); vehicle crimes (theft of a vehicle, theft from a vehicle, aggravated vehicle taking, vehicle interference and criminal damage to a vehicle); and violent crimes (violence against the person).
One might very plausibly ask if our interest is in the possible links between crime and monetary measures then why do we choose to look violent crimes as well as non-violent crimes? The justification to look at non-non-violent crimes is very clear from the economic model but many commentators would argue that violent crimes are much less likely (if at all) to be shaped by monetary factors. Our view is that this is essentially an unresolved issue and one can put forward arguments both ways.5 As such we choose to present empirical models of violent crime as well.
Labour Market Data
We obtained our labour market variables by aggregating individual-level data to police force area. This was done using data from the Labour Force Survey (LFS), matched using a county level identifier to the police force areas. Our principal measure looking at whether the minimum wage introduction had a differential effect by police force area is a variable which measures the proportion of workers paid beneath the hourly minimum in the year before its introduction (£3.60 for people aged 22+, £3.00 for 18-21 year olds). We mainly use this variable to gauge the extent to which there is a differential
4
This actually makes no difference in practice as our descriptive statistics and regression results are population weighted. But it seems neater and more natural to aggregate the two London areas together.
5
impact of the minimum wage across police force areas. Towards the end of the paper we also consider other variables measuring the nature of the low wage labour market as robustness checks of our main findings.
Our empirical models also control for a number of other factors which theory and past empirical work inform us could be influencing the relationship between crime and the introduction of the minimum wage. These include changes in the demographic structure of areas or in the likelihood of detection that could be occurring during the time period we are examining. The demographic variables we consider come from the LFS and are area measures of average age, the population shares of women, of young (<25) men, of those with no educational qualifications and the share of public sector jobs in total employment. To look at changes in detection rates that may coincide with our time periods of study we look at the clear up rate, namely the proportion of crimes that were solved by the police in each area.
for a possible unemployment effect of minimum wages that may arise due to the differential impact of the minimum on wages across areas and we do so in our empirical work.
Descriptive Analysis
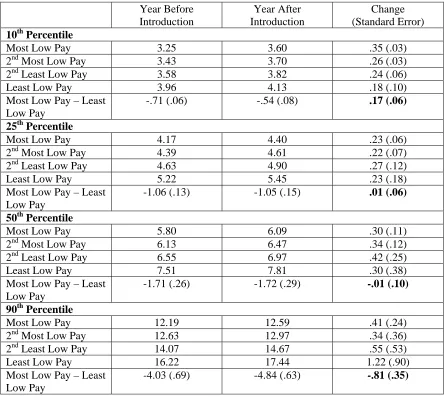
Table 1 begins our empirical analysis by showing the relationship between area wage structures and the pre-minimum wage introduction extent of low pay. This is done by dividing areas into groups on the basis of the proportion of people paid beneath the national minimum wage in the year prior to its introduction. The police force areas of England and Wales were divided up into four areas described as ‘most low pay’ (where over 11.7 percent of workers were paid beneath the minimum in the initial period), ‘second most low pay’ (between 10.2 and 11.7 percent beneath the minimum), ‘second least low pay’ (between 7.5 and 10.2 percent) and ‘least low pay’ (less than 7.5 percent below the minimum). The Table shows the hourly wage at different percentile points of the wage distribution for each of these areas and then changes over time for each area, together with gaps in the change between the ‘most low pay’ and ‘least low pay’ areas. These latter changes (given in bold) can be thought of as ‘difference-in-difference’ estimates of the impact of the minimum wage on different points of the wage distribution.
is statistically significant) shows a stronger beneficial impact of the minimum wage on the 10th percentile to have occurred in low wage areas.
But, like other research in this area (notably Dickens and Manning, 2001) the minimum wage does not seem to impact higher up the distribution. There are no differences across areas at the 25th percentile where the changes in hourly wages are very similar across areas (the difference-in-difference now being only 1 pence, and completely insignificant). The same is true at the median. At the top of the distribution the opposite occurs and the 90th percentile grows by more in the ‘least low pay’ areas, though this will be for reasons unconnected to the minimum wage introduction. Nevertheless there is an important impact on wage structures that differs across areas at the lower end of the distribution.
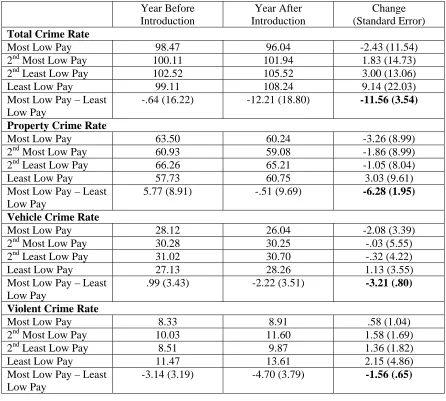
In Table 2 we look at changes in crime rates (defined as crimes per 1000 population) across the same group of four areas as in Table 1. Looking at the difference-in-difference estimates given in bold a very clear pattern emerges. For all four crimes there seems to be a reduction of crime in the ‘most low pay’ areas as compared to the ‘least low pay areas’. For example, the year-on-year change in the total crime rate was around 11.6 crimes lower per 1000 people (comparable numbers for property, vehicle and violent crimes being 6.3, 3.2 and 1.6 respectively). Furthermore, for the non-violent crimes this gap seems to be driven by crime falling in the areas with more low paid workers and rising in the areas with few low paid workers. For violent crimes the crime rate appears to increase across all areas, but by less where there are more low wage workers.
proportion of workers paid beneath the minimum level before introduction. Further to this, crime seems to have been moderated (in relative terms) in those areas more affected by the introduction of the minimum wage (i.e. those with a higher proportion of workers paid beneath the minimum level before April 1999).
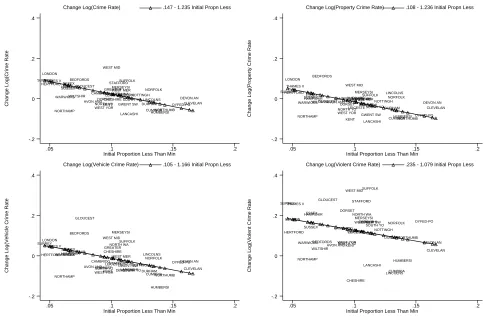
This pattern is confirmed in Figure 1 which plots the change in the crime rates against the initial proportion low paid over the period prior to and post the minimum wage introduction separately for total, property, vehicle and violent crime. The graphs show, for all crime types, that crime went up by less in the areas with more low paid workers in the period before the minimum wage was introduced. All the regression lines fitted through the data points show there to be a negative relationship between changes in crime and the initial low pay proportion. The next section puts these findings to a more rigorous test by subjecting the data to a range of econometric tests.
4. Econometric Estimates
Basic Regression Results
Table 3 shows the results of regressions of changes in crime on the proportion of workers paid less than the minimum in the period before the minimum wage was introduced. Three sets of specifications are reported for each category of offence. The first is a simple regression of the change in crime on the initial period proportion of workers paid beneath the minimum. This is simply the slope of the regression lines fitted through the data points given in Figure 1. The second sees how this is affected by adding in the demographic controls6 and the change in the crime clear up rate. The third then additionally adds in the change in the unemployment rate.
6
A comparison of column (1) and (2) shows the negative relationship between all four changes in crime measures and the initial low pay proportion is not wiped out by the inclusion of the extra variables. In all cases the estimated coefficient on the initial low pay proportion falls in (absolute terms) but it remains statistically significant. The coefficient on the change in the clear up rate is interesting, as it appears to suggest negative deterrence effects for non-violent crimes but displays no association with changes in violent crimes. Nonetheless, the column (2) findings reinforce the earlier descriptive analysis, showing relative falls in crime occurring in the lower wage areas that were more affected by the introduction of the minimum wage.
The final column (3) specification adds in changes in the log(unemployment rate). Its inclusion has little effect on the coefficient on the initial low pay proportion, which remains negative and statistically significant for all four crimes (though it is very much on the margins of significance for violent crimes). In terms of the coefficient on the change in unemployment, for total, property and vehicle crime there is no statistically significant association between changes in crime and changes in unemployment. However, for changes in violent crime the coefficient on the change in the unemployment rate is estimated to be positive and significant. This is the only place we are able to detect an unemployment effect, supporting the discussion in Freeman (1999) that the relationship between crime and unemployment is a hard one to uncover.
Benchmarking Against Earlier Time Periods
fell in relative terms by a similar magnitude in low wage areas in time periods when the minimum wage was not present, then our results could not be attributed to the introduction of the minimum wage.
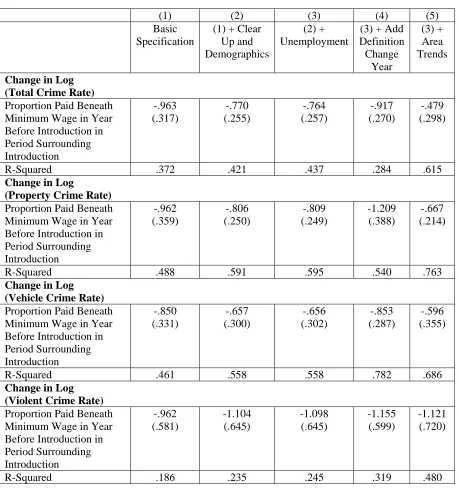
To rule out this possibility and ensure we are actually identifying changes resulting from the introduction of the minimum wage we need to look at econometric models specified in the same way as those already considered for earlier time periods. Thus, Table 4 shows a set of results from regressions that benchmark the basic results against the relationship between changes in crime and the initial low paid proportion in earlier time periods. As these add a further differenced set of data, in the control periods where there was no minimum wage legislation in operation, one can think of these estimates as triple differenced, or difference-in-difference-in-difference estimates.7
Table 4 reports coefficients on the initial low pay proportion in the period surrounding minimum wage introduction from five specifications for each model of crime. Columns (1) to (3) are the same specifications as in Table 3, but benchmarked against earlier time periods. The change in the period surrounding minimum wage introduction (from financial year 1998/99 to financial year 1999/2000) is compared to changes in two earlier time periods (the change from financial year 1996/97 to 1997/98 and the change from 1995/96 to 1996/97). The reason for these choice of benchmark periods is a change in the way that crime statistics were collected by police force areas that occurred in 1998 prevents us from being able to calculate the change from financial year 1997/98 to 1998/99.8 However, the Home Office has published scaling factors that
7
Or alternatively one can think of the estimates as difference-in-difference estimates of the change model (i.e. double-differenced in changes rather than triple-differenced in levels). As such they compare the relationship between changes in crime and the initial low pay proportion in the treatment period surrounding minimum wage introduction with the same relationship in the earlier (non-minimum wage) control periods.
8
(for total crimes) can bridge this gap (as they collected crime numbers on the old and new reporting basis) and so we also include the scaled change for these financial years in the control group in column (4). Column (5) then implements a very stringent test, additionally including into the column (3) specification a full set of police force area trends.
The coefficients reported in the first three columns of the Table make it clear that our earlier estimates are not picking up a relationship that existed in earlier time periods. For total, property and vehicle crimes the coefficient on the low pay proportion is seen to be significantly more negative in the period surrounding minimum wage introduction than in the comparison periods. The coefficient in the violent crime equation is also negative but the standard error is large, making the estimates very imprecise.
As already noted, the first three columns of Table 4 exclude the period measuring changes across financial years 1997/1998 to 1998/99 (the change period directly preceding the period surrounding minimum wage introduction) due to the change in the way that crimes were counted that occurred from April 1998.9 However, as already noted, we do have a set of scaling factors reported by the Home Office (1999) that we can use to compute the change for this period in a manner consistent with the minimum wage introduction years to see whether this definitional change matters or not for our main findings. The results produced by incorporating the scaled data from this extra period are
to measure one crime per victim and to widen the definition of a notifiable offence (to include all indictable and triable-either-way offences plus some related summary offences). The Home Office reports that the definition change mostly affected violent crime, drug crime and fraud and criminal damage. Notice that we do not include the latter three crimes in our analysis but, for the crimes we analyse, the counting rule
changes are more likely to affect the total and violent crime rates whilst being relatively unimportant for
property and vehicle crimes.
9
given in column (4).10 They tend to confirm the earlier picture as the coefficients on the initial proportion low paid actually become slightly more negative (though reassuringly they remain insignificantly different from those in column (3)).
The nature of the data, on the same areas followed through time, means that one can also adopt an even more stringent test by including area-specific trends in the estimating equation. The final column of the Table therefore additionally includes 41 area trend variables. The coefficients are reduced by this inclusion and, of course as one would expect, the standard errors rise, yet the results remain robust to this.
Overall it seems that benchmarking against earlier time periods acts to reinforce the findings presented before. There appears to be a stronger negative relationship between crime and low pay in the period surrounding the minimum wage introduction. This is a robust finding for most crimes (i.e. except for the much noisier data on violent crimes) and is in line with the idea that the altering of economic incentives brought about by the introduction of the minimum wage may well have caused individuals on the margins of crime to desist.
Further Considerations
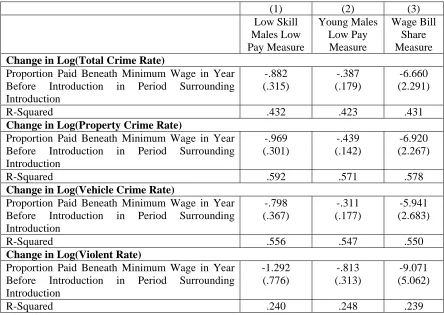
A final potentially relevant consideration is that, to date, we have used measures of the extent of low pay in the overall area labour market. Whilst we think our measures are a useful barometer of the state of the low wage labour market in these local areas, it is also the case that most people do not commit crimes and that those that do or those who are on the margins of criminal choice are disproportionately males, young and are likely to be in low skill jobs.
10
Therefore, we have estimated regression models (comparable to column (3) of Table 4) that refine the nature of the initial low pay variable. These are shown in Table 5. The Table reports estimated coefficients on three different measures of low pay in the period prior to minimum wage introduction. Column (1) reports the estimated coefficient from a model incorporating a measure of the proportion beneath the minimum for males employed in occupations where the mean wage is below the 25th percentile of the average male wage. We refer to this as the low skill males low pay measure. Column (2) uses the initial low pay proportion for males under the age of 25 only. Finally, column (3) returns to the full sample of people in a police force area but, rather than using the headcount measure considered so far, computes how far the wage bill would need to be raised to take all people initially beneath the minimum up to the minimum wage. This will give potentially different results to the headcount if the wage shortfall differs across areas.
Because we are focusing on specific sub-groups then one should note that the magnitude of the estimated coefficients will differ from earlier results and indeed that is what happens in Table 5.11 But the general thrust of the earlier results is certainly borne out. There is seen to be a more pronounced negative relationship between changes in crime and the initial low pay proportion in the period surrounding minimum wage introduction in the police force areas of England and Wales.
5. Conclusions
minimum wage floor to a labour market previously unregulated by minimum wage legislation. This minimum wage introduction benefited a sizable number of workers. We try and see whether the wage gains resulting from minimum wage introduction were able to alter incentives to participate in crime. This is what one would expect from simple economic models of crime that argue that shifting the relative monetary gains between legal and illegal activities can alter individual’s likelihood of doing crime.
We test this prediction by noting that there were more beneficiaries from the minimum wage introduction in some police force areas of England and Wales than in others. We thus relate changes in crime rates across police force areas in the period before and after minimum wage introduction to the proportion of workers beneath the minimum wage before its introduction. We uncover a statistically significant negative relationship, showing relative crime reductions in areas that initially had more low wage workers. This finding remains robust to controlling for other relevant determinants of crime, to benchmarking against earlier time periods and to using initial period wage measures that look at the types of individuals one thinks are more likely to be on the margins of crime. Overall our results are in line with the notion that altering wage incentives can affect crime and therefore that there exists a link between crime and the low wage labour market.
11
References
Becker, Gary (1968) “Crime and punishment: An economic approach”, Journal of Political Economy 76:175-209.
Box, Steven (1987) Recession, Crime and Punishment. London: The Macmillan Press. Brown, Charles (1999) “Minimum Wages, Employment, and the Distribution of
Income”, Chapter 32 in O. Ashenfelter and D. Card (eds.) Handbook of Labor Economics, North Holland Press.
Card, David (1992) “Using Regional Variation in Wages to Measure the Effects of the Federal Minimum Wage”, Industrial and Labor Relations Review 46: 22-37. Chiricos, Theodore (1987) “Rates of Crime and Unemployment: An Analysis of
Aggregate Research Evidence”, Social Problems 34: 187-211.
Dickens, Richard and Alan Manning (2001) “The National Minimum Wage and Wage Inequality”, mimeo.
Dickens, Richard, Stephen Machin and Alan Manning (1999) "The Effects of Minimum Wages on Employment: Theory and Evidence From Britain", Journal of Labor Economics 17: 1-22.
DiNardo, John, Nicole Fortin and Thomas Lemieux (1996) “Labor Market Institutions and the Distribution of Wages, 1973-92: A Semi-Parametric Approach, Econometrica 64: 1001-44.
Ehrlich, Isaac (1973) “Participation in Illegitimate Activities: A Theoretical and Empirical Investigation”, Journal of Political Economy 81: 521-563.
Ehrhlich, Isaac (1996) ‘Crime, Punishment, and the Market for Offenses’, Journal of Economic Perspectives, Winter, 43-67.
Fagan, Jeffrey and Richard Freeman (1999) “Crime, Work and Unemployment”, in M. Tonry (ed.) Crime and Justice: A Review of Research, Volume 25, University of Chicago Press: Chicago.
Freeman, Richard (1999) “The Economics of Crime” in O. Ashenfelter and D. Card (eds.) Handbook of Labor Economics, Elsevier Science: Amsterdam.
Gould, Eric, Bruce Weinberg and David Mustard (2002) “Crime Rates and Local Labor Market Opportunities in the United States: 1979-1995”, Review of Economics and Statistics 84: forthcoming.
Grogger, Jeffrey (2000) “An Economic Model of Recent Trends in Violent Crime”, in Alfred Blumstein and Joel Wallman (eds.) The Crime Drop in America, Cambridge University Press.
Home Office (1999) “Recorded Crime Statistics England and Wales, April 1998 to March 1999”, Home Office Statistical Bulletin 18/99.
Lee, David (1999) “Wage Inequality in the United States during the 1980s: Rising Dispersion or Falling Minimum Wage?”, Quarterly Journal of Economics 114: 977-1023.
Machin, Stephen, Alan Manning and Lupin Rahman (2001) “Care home workers and the UK National Minimum Wage”, mimeo.
Machin, Stephen and Costas Meghir (1999) “Crime and economic incentives”. University College London mimeo.
May, Sean (2000) “Wages and youth arrests”. Chapter 1 of MIT PhD thesis ‘Essays on the Economics of Crime and Econometric Methodology’.
McDonald, Ziggy (2001) “Revisiting the Dark Figure A Microeconometric Analysis of the Under-reporting of Property Crime and Its Implications”, British Journal of Criminology 41: 127-149.
Metcalf, David (1999) “The Low Pay Commission And The National Minimum Wage”, Economic Journal Features 109: F46-F66.
Reilly Barry and Robert Witt (1996) “Crime, Deterrence and Unemployment in England and Wales: An Empirical Analysis”, Bulletin of Economic Research 48: 137-159. Stewart, Mark (2001) “The Impact of the Introduction of the UK Minimum Wage on the
Employment Probabilities of Low Wage Workers”, University of Warwick mimeo.
Figure 1:
Changes in Crime Rates And The Initial Proportion Low Paid, Between April 1998–March 1999 And April 1999-March 2000
Change Log(Cri
m
e Rate
Initial Proportion Less Than Min
Change Log(Crime Rate) .147 - 1.235 Initial Propn Less
.05 .1 .15 .2
-.2 0 .2 .4 AVON AND BEDFORDS CAMBRIDG CHESHIRE CLEVELAN CUMBRIA DERBYSHI DEVON AN DORSET DURHAM DYFED-PO ESSEX GLOUCEST GREATER GWENT SW HAMPSHIR HERTFORD HUMBERSI KENT LANCASHI LEICESTE LINCOLNS LONDON MERSEYSI NORFOLK NORTH WA NORTH YO NORTHAMP NORTHUMB NOTTINGH SOUTH YO STAFFORDSUFFOLK SURREY SUSSEX THAMES V WARWICKS WEST MER WEST MID WEST YOR WILTSHIR Change Log(P roperty Cri m e Rate
Initial Proportion Less Than Min
Change Log(Property Crime Rate) .108 - 1.236 Initial Propn Less
.05 .1 .15 .2
-.2 0 .2 .4 AVON AND BEDFORDS CAMBRIDGCHESHIRE CLEVELAN CUMBRIA
DERBYSHI DEVON AN DORSET DURHAM DYFED-PO ESSEX GLOUCEST GREATER GWENT SW HAMPSHIR HERTFORD HUMBERSI KENT LANCASHI LEICESTE LINCOLNS LONDON MERSEYSI NORFOLK NORTH WA NORTH YO NORTHAMP NORTHUMB NOTTINGH SOUTH YO STAFFORD SUFFOLK SURREY SUSSEX THAMES V
WARWICKS WEST MER WEST MID WEST YOR WILTSHIR Change Log(V e hi cl e Cri m e Rate
Initial Proportion Less Than Min
Change Log(Vehicle Crime Rate) .105 - 1.166 Initial Propn Less
.05 .1 .15 .2
-.2 0 .2 .4 AVON AND BEDFORDS CAMBRIDG CHESHIRE CLEVELAN CUMBRIA DERBYSHI DEVON AN DORSET DURHAM DYFED-PO ESSEX GLOUCEST GREATER GWENT SW HAMPSHIR HERTFORD HUMBERSI KENT LANCASHI LEICESTE LINCOLNS LONDON MERSEYSI NORFOLK NORTH WA NORTH YO NORTHAMP NORTHUMB NOTTINGH SOUTH YO STAFFORD SUFFOLK SURREY SUSSEX THAMES V
WARWICKS WEST MER WEST MID WEST YOR WILTSHIR Change Log(V iol ent Cri m e Rate
Initial Proportion Less Than Min
Change Log(Violent Crime Rate) .235 - 1.079 Initial Propn Less
.05 .1 .15 .2
-.2 0 .2 .4 AVON AND BEDFORDS CAMBRIDG CHESHIRE CLEVELAN CUMBRIA DERBYSHI DEVON AN DORSET DURHAM DYFED-PO ESSEX GLOUCEST GREATER GWENT SW HAMPSHIR HERTFORD HUMBERSI KENT LANCASHI LEICESTE LINCOLNS LONDON MERSEYSI NORFOLK NORTH WA NORTH YO NORTHAMP NORTHUMB NOTTINGH SOUTH YO STAFFORD SUFFOLK SURREY SUSSEX THAMES V WARWICKS WEST MER WEST MID WEST YOR WILTSHIR
Table 1:
The Introduction of the National Minimum Wage And Area Hourly Wage Structures
Year Before
Introduction
Year After Introduction
Change (Standard Error) 10th Percentile
Most Low Pay 3.25 3.60 .35 (.03)
2nd Most Low Pay 3.43 3.70 .26 (.03)
2nd Least Low Pay 3.58 3.82 .24 (.06)
Least Low Pay 3.96 4.13 .18 (.10)
Most Low Pay – Least Low Pay
-.71 (.06) -.54 (.08) .17 (.06)
25th Percentile
Most Low Pay 4.17 4.40 .23 (.06)
2nd Most Low Pay 4.39 4.61 .22 (.07)
2nd Least Low Pay 4.63 4.90 .27 (.12)
Least Low Pay 5.22 5.45 .23 (.18)
Most Low Pay – Least Low Pay
-1.06 (.13) -1.05 (.15) .01 (.06)
50th Percentile
Most Low Pay 5.80 6.09 .30 (.11)
2nd Most Low Pay 6.13 6.47 .34 (.12)
2nd Least Low Pay 6.55 6.97 .42 (.25)
Least Low Pay 7.51 7.81 .30 (.38)
Most Low Pay – Least Low Pay
-1.71 (.26) -1.72 (.29) -.01 (.10)
90th Percentile
Most Low Pay 12.19 12.59 .41 (.24)
2nd Most Low Pay 12.63 12.97 .34 (.36)
2nd Least Low Pay 14.07 14.67 .55 (.53)
Least Low Pay 16.22 17.44 1.22 (.90)
Most Low Pay – Least Low Pay
-4.03 (.69) -4.84 (.63) -.81 (.35)
Notes:
Areas are split into four (almost) equal sized groups of police force areas (3 groups of 10 and one of 11 areas). The groupings are based upon the proportion of workers paid less than the minimum wage in the year prior to its introduction. Areas in the Most Low Pay group have over 11.7 percent of workers beneath
the minimum wage. Areas in the 2nd Most Low Pay group have between 10.2 and 11.7 percent of workers
beneath the minimum. Areas in the 2nd Least Low Pay group have between 7.5 and 10.2 percent of workers
beneath the minimum. Areas in the Least Low Pay group have less than 7.5 percent of workers beneath the minimum wage.
Table 2:
The Introduction of the National Minimum Wage And Area Crime Rates (Per 1000 Population)
Year Before
Introduction
Year After Introduction
Change (Standard Error) Total Crime Rate
Most Low Pay 98.47 96.04 -2.43 (11.54)
2nd Most Low Pay 100.11 101.94 1.83 (14.73)
2nd Least Low Pay 102.52 105.52 3.00 (13.06)
Least Low Pay 99.11 108.24 9.14 (22.03)
Most Low Pay – Least Low Pay
-.64 (16.22) -12.21 (18.80) -11.56 (3.54)
Property Crime Rate
Most Low Pay 63.50 60.24 -3.26 (8.99)
2nd Most Low Pay 60.93 59.08 -1.86 (8.99)
2nd Least Low Pay 66.26 65.21 -1.05 (8.04)
Least Low Pay 57.73 60.75 3.03 (9.61)
Most Low Pay – Least Low Pay
5.77 (8.91) -.51 (9.69) -6.28 (1.95)
Vehicle Crime Rate
Most Low Pay 28.12 26.04 -2.08 (3.39)
2nd Most Low Pay 30.28 30.25 -.03 (5.55)
2nd Least Low Pay 31.02 30.70 -.32 (4.22)
Least Low Pay 27.13 28.26 1.13 (3.55)
Most Low Pay – Least Low Pay
.99 (3.43) -2.22 (3.51) -3.21 (.80)
Violent Crime Rate
Most Low Pay 8.33 8.91 .58 (1.04)
2nd Most Low Pay 10.03 11.60 1.58 (1.69)
2nd Least Low Pay 8.51 9.87 1.36 (1.82)
Least Low Pay 11.47 13.61 2.15 (4.86)
Most Low Pay – Least Low Pay
-3.14 (3.19) -4.70 (3.79) -1.56 (.65)
Notes:
Table 3:
Regressions of Changes in Log(Crime Rates)
on the Initial Low Pay Proportion Across Police Force Areas in the Years Before And After Minimum Wage Introduction
(1) (2) (3)
Change in Log(Total Crime Rate)
Proportion Paid Beneath Minimum Wage in Year Before Introduction -1.235 (.268) -.980 (.239) -1.007 (.250)
Change in Clear Up Rate -.170
(.078)
-.175 (.081)
Change in Log(Unemployment Rate) .080
(.088)
Demographic Controls No Yes Yes
R-Squared .400 .468 .486
Change in Log(Property Crime Rate)
Proportion Paid Beneath Minimum Wage in Year Before Introduction -1.236 (.337) -.894 (.235) -.910 (.239)
Change in Clear Up Rate -.257
(.076)
-.260 (.078)
Change in Log(Unemployment Rate) .045
(.071)
Demographic Controls No Yes Yes
R-Squared .400 .572 .578
Change in Log(Vehicle Crime Rate)
Proportion Paid Beneath Minimum Wage in Year Before Introduction -1.166 (.253) -1.012 (.282) -1.002 (.283)
Change in Clear Up Rate -.157
(.091)
-.156 (.092)
Change in Log(Unemployment Rate) -.029
(.101)
Demographic Controls No Yes Yes
R-Squared .292 .378 .380
Change in Log(Violent Crime Rate)
Proportion Paid Beneath Minimum Wage in Year Before Introduction -1.079 (.281) -1.005 (.471) -1.053 (.520)
Change in Clear Up Rate -.003
(.126)
-.012 (.133)
Change in Log(Unemployment Rate) .141
(.064)
Demographic Controls No Yes Yes
R-Squared .121 .261 .285
Table 4: Benchmarking Against Earlier Time Periods
[Change in financial year 1998/99 to 1999/2000 benchmarked against change in financial year 1996/97 to 1997/98 and change in financial year 1995/6 to1996/7 in (1), (2), (3) and (5);
Change in financial year 1998/99 to 1999/2000 benchmarked against change in financial year 1997/98 to 1998/99 (scaled by Home Office factors for reporting changes), change in financial year 1996/97 to 1997/98 and change in financial year 1995/6 to1996/7 in (4)]
(1) (2) (3) (4) (5)
Basic Specification
(1) + Clear Up and Demographics
(2) + Unemployment
(3) + Add Definition Change Year (3) + Area Trends
Change in Log (Total Crime Rate) Proportion Paid Beneath Minimum Wage in Year Before Introduction in Period Surrounding Introduction -.963 (.317) -.770 (.255) -.764 (.257) -.917 (.270) -.479 (.298)
R-Squared .372 .421 .437 .284 .615
Change in Log
(Property Crime Rate) Proportion Paid Beneath Minimum Wage in Year Before Introduction in Period Surrounding Introduction -.962 (.359) -.806 (.250) -.809 (.249) -1.209 (.388) -.667 (.214)
R-Squared .488 .591 .595 .540 .763
Change in Log (Vehicle Crime Rate) Proportion Paid Beneath Minimum Wage in Year Before Introduction in Period Surrounding Introduction -.850 (.331) -.657 (.300) -.656 (.302) -.853 (.287) -.596 (.355)
R-Squared .461 .558 .558 .782 .686
Change in Log (Violent Crime Rate) Proportion Paid Beneath Minimum Wage in Year Before Introduction in Period Surrounding Introduction -.962 (.581) -1.104 (.645) -1.098 (.645) -1.155 (.599) -1.121 (.720)
R-Squared .186 .235 .245 .319 .480
Table 5:
Further Considerations
(1) (2) (3)
Low Skill
Males Low Pay Measure
Young Males Low Pay
Measure
Wage Bill Share Measure Change in Log(Total Crime Rate)
Proportion Paid Beneath Minimum Wage in Year Before Introduction in Period Surrounding Introduction
-.882 (.315)
-.387 (.179)
-6.660 (2.291)
R-Squared .432 .423 .431
Change in Log(Property Crime Rate)
Proportion Paid Beneath Minimum Wage in Year Before Introduction in Period Surrounding Introduction
-.969 (.301)
-.439 (.142)
-6.920 (2.267)
R-Squared .592 .571 .578
Change in Log(Vehicle Crime Rate)
Proportion Paid Beneath Minimum Wage in Year Before Introduction in Period Surrounding Introduction
-.798 (.367)
-.311 (.177)
-5.941 (2.683)
R-Squared .556 .547 .550
Change in Log(Violent Rate)
Proportion Paid Beneath Minimum Wage in Year Before Introduction in Period Surrounding Introduction
-1.292 (.776)
-.813 (.313)
-9.071 (5.062)
R-Squared .240 .248 .239