\/UOOD^
^OS-DATE DUE
f^-i
RESERVE
THESIS
00A.68
SIM
A Local Area Network Using
Spread Spectrum Techniques
A Thesis submitted for examination for the
Degree of Master of Engineering (Electrical)
By A. L. Simcock BSc(Hons) (Electronics) University of Kent at Canterbury,
Canterbury. England.
Table of Contents
Table of Contents i
List of Figures vii
List of Tables xi
Acknowledgements xii
Abstract xiii
1 INTRODUCTION 1
1.1 Summary 1
1.2 The Emergence of Local Area Networks 2
1.3 Spread Spectrum in LANs 3
1.4 Literature Survey and Existing Systems 5
1.4.1 System A 5
1.4.2 System B 6
1.4.3 System C 7
1.4.4 System D 7
1.5 Autocorrelation, Crosscorrelation and Orthogonality 8
1.6 Features Required in CDMA Codes 10
1.7 Maximal Length Sequences 11
1.8 Basic Spread Spectrum Theory 13
1.9 Multiple Access in a Spread Spectrum System 19
2 OUTLINE OF THE RESEARCH 23
2.1 Summary 23
2.2 Design Aims 23
CODES IN A CDMA SYSTEM 29
3.1 Summary 29
3.2 Coding Scheme Selection 29
3.2.1 Scheme A - Segments of Long m-sequences 30
3.2.2 Scheme B - Different m-sequences of the Same Length 30
3.2.3 Scheme C - Gold Codes 31
3.2.4 Scheme D - Phase Shifted Versions of a Single m-sequence 32
3.2.5 Scheme F - Modified Maximal Length Sequences 34
3.3 System Timing Concepts 37
3.4 Sliding Correlator 41
3.5 Collision Mechanisms and Characteristics 42
HARDWARE 43
4.1 Summary 43
4.2 Overview of Development Requirements 43
4.3 Brief Overview of Hardware 44
4.3.1 Microprocessor Control Circuit - Board M 44
4.3.2 Host Interface - Board M 48
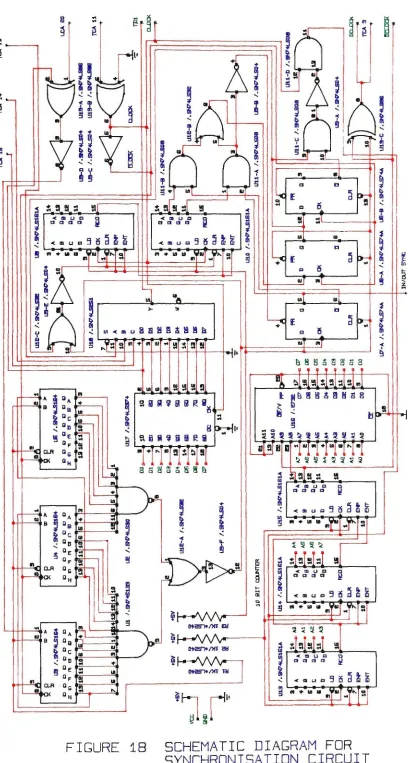
4.3.3 Synchronisation Circuit - Board P 48
4.3.4 Clock Recovery - Board M 48
4.3.5 Transmitter Line Driver - Board P 48
4.3.6 Code Select - Board P 49
4.3.7 A/D Converter - Board M 49
4.3.8 Receiver Sliding Correlator and Demodulator - Board M 49
4.3.9 Transmitter Sliding Correlator and Demodulator - Board P 50
4.3.10 Data Generator/Receiver - Board P 50
4.4 Detailed Hardware Description 50
4.4.1 Microprocessor Control Circuit 50
4.4.3.1 Performance Tests on the Sync Circuit 61
4.4.4 Clock Recovery 63
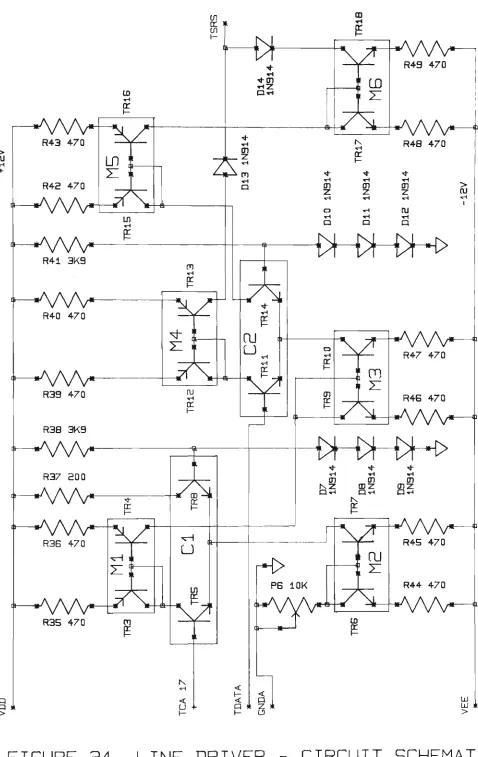
4.4.5 Transmitter Line Driver 67
4.4.6 Code Select 72
4.4.7 Analogue to Digital Converter (ADC) 72
4.4.8 Receiver 74
4.4.8.1 The Sliding Correlator 74
4.4.8.2 The Analogue Multiplier 76
4.4.8.3 Integrate and Dump 79
4.4.9 Transmitter 79
4.4.10 Data Generator/Receiver 81
5 HARDWARE FUNCTIONAL TESTING 83
5.1 Summary 83
5.2 Bit Error Rate (BER) Test 83
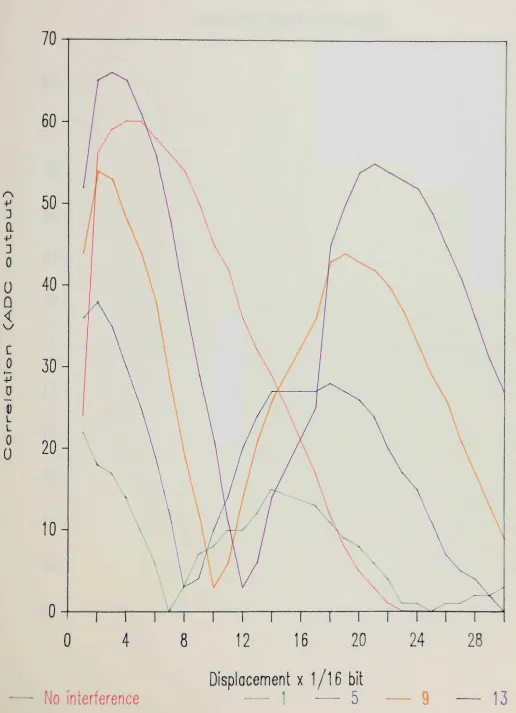
5.3 Sliding Correlator Test 89
5.4 Collision Detection Tests 91
5.4.1 Test 1 Additive interference (overlap < 1 bit) 91
5.4.2 Test 2 Additive interference (1 bit < overlap < 2 bits) 93
5.4.3 Test 3 Destructive interference (overlap < 1 bit) 93
5.4.4 Test 4 Destructive interference (1 bit < overlap <2 bits) 96
6 THROUGHPUT MODEL 101
6.1 Summary 101
6.2 Theoretical Throughput 101
6.3 Simulation of Throughput 110
7.3 Control of the Spread Spectrum Interface 117
7.3.1 Inputs 117
7.3.2 Outputs 118
7.4 ADLC Control 120
7.4.1 Receiver Control 121
7.4.2 Transmitter Control 122
7.5 Connection Testing 122
7.6 Throughput Performance Testing 124
7.6.1 Test Configuration and General Procedures 124
7.6.2 Test Results 127
7.6.2.1 Test#1 Peak Channel Occupancy - no collisions 127
7.6.2.2 Test #2 Throughput - with collisions 130
7.6.2.3 Test #3 Short (Pseudo random) Re-scheduling Times 131
7.7 Analysis of System Performance 136
CONCLUSIONS 137
8.1 Discussion of the Project 137
8.2 Comparison With Other Networks 140
8.3 Suggestions for Future Work 142
Bibliography 144
Appendices
A CIRCUIT DIAGRAMS 150
B.2 The Requirements 157
B.3 Circuit Description 158
B.4 Circuit Testing and Discussion of Results 166
B.4.1 Test#1 167
B.4.2 Test #2 173
B.4.3 Test #3 175
B.4.4 Tests #4 to #8 175
B.4.5 Tests #9 and #10 182
B.4.6 Tests #11 and #12 182
B.5 Appendix B Conclusions 189
C THE ANALOGUE MULTIPLIER 191
C.I Summary 191
C.2 Theory of Operation 191
C.3 Level Shifting 195
C.4 Analogue Multiplier Design Procedure 196
C.5 Level Shifter Design 199
D PROGRAM - CSMA/CD SIMULATOR 202
D.I Summary 202
D.2 Brief Outline of the Program 202
PROGRAM LISTING 204
E MICROPROCESSOR PROGRAM 209
E.I Summary 209
PROGRAM LISTING 210
F.2.1 Normal (Gaussian) 231
F.2.2 Poisson 232
F.3 The "Random" Programs 233
F.3.1 Normal Distribution Numbers 233
F.3.2 Poisson Number Program 234
F.4 The Traffic Program 234
PROGRAM LISTING 238
PUBLICATIONS 242
List of Figures
Figure Title Page
1 Maximal Length Sequence Generator 12
2 Single Channel Direct Sequence System 14
3 Relationship Between Chip and Data Signals 15
4 Spectral Occupancy of Signals 18
5 Multiple Access Concept 20
6 Typical Transmitter Waveforms 21
7 Network Bus Structure 26
8 Autocorrelation Function of a 1023 Bit MLS 33
9 "Modified" MLS Address Code Generation 35
10 Autocorrelation Function of "Modified" 1024 Bit MLS 36
11 System Delay and Timing Aspects 38
12a Overall System Block Diagram 45
12b Photograph of Microprocessor Board 46
12c Photograph of Peripheral Board 47
13 Microprocessor Control Circuit - Block Diagram 51
14 Memory Map for Microprocessor Control Circuit 53
15 V.I.A. Control Signal Pin Connections 54
16 Sync Circuit and Code Select - Block Diagram 55
17 Timing Diagram For Sync Circuit 57
18 Schematic Diagram for Synchronisation Circuit 58
19 Sync Dropout vs Error Rate 62
20 Cycles to Regain Sync vs Error Rate 64
21 Clock Recovery/Generator - Block Diagram 65
Figure Title Page
25 A to D Converter Circuit - Block Diagram 73
26 Receiver Circuit - Block Diagram 75
27 Sliding Correlator - Block Diagram 77
28 Analogue Multiplier - Block Diagram 78
29 Integrate and Dump Circuit and Timing Diagram 80
30 Transmitter Circuit - Block Diagram 82
31 Bit Error Rate Test Hardware Configuration 84
32 White Noise Generation 85
33a Photograph of Band Limited Spectrum 86
33b Photograph of Single Transmitter Spectrum 86
33c Photograph of Noise -i- Multi-Transmitters Spectrum 88
33d Photograph of Received Signal / Recovered Data 88
34 Bit Error Rate vs S/N Ratio 90
35 Correlation With Delayed Signals 92
36 Correlation of Additive Signals - Less Than 1 Bit Delay 94
37 Correlation of Additive Signals - Greater Than 1 Bit Delay 95
38 Correlation of Destructive Signals - Less Than 1 Bit Delay 97
39 Positive and Negative Correlation - Less Than 1 Bit Delay 98
40 Correlation of Destructive Signals - Greater Than 1 Bit Delay 99
41 Positive and Negative Correlation - Greater Than 1 Bit Delay 100
42 Channel Transmission Characteristics 104
43 Throughput vs Offered Traffic 107
44 Comparison of Throughput Characteristics 109
45 Theoretical and Simulated Throughput 113
46 Number of Collisions vs Offered Traffic 115
Figure Title Page
50 System Throughput - Alternative Protocol (small random rescheduling) 134
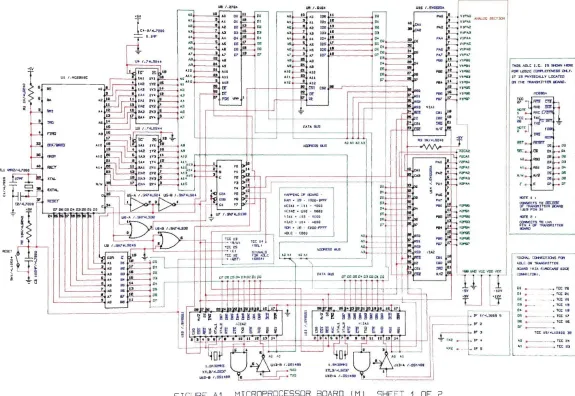
A1 Microprocessor Board (M) - sheet 1 of 2 151
A2 Microprocessor Board (M) - sheet 2 of 2 152
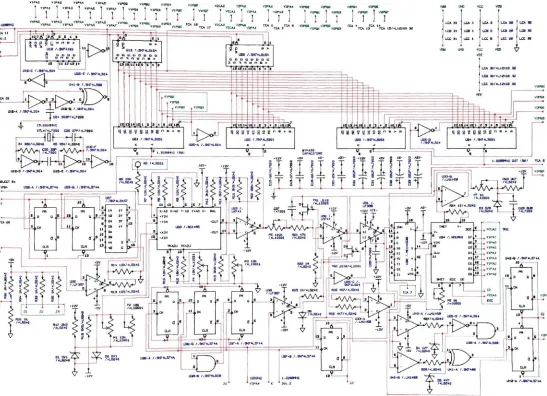
A3 Peripheral Board (P) - sheet 1 of 3 153
A4 Peripheral Board (P) - sheet 2 of 3 154
A5 Peripheral Board (P) - sheet 3 of 3 155
B1 Block Diagram for Error Generator 159
B2 Circuit Diagram for Error Generator - Board 1 162
B3 Circuit Diagram for Error Generator - Board 2 163
B4 Test Circuits A and C 168
B5 Test Circuits D,E and F 169
B6 Test Circuits G,H,I and J 170
B7 Distribution of All Errors (A). F = 1 MHz. R = 1 in 10 171
B8 Distribution of Any Error (B). F = lMHz. R = 1 in 10 174
B9 Distribution of 1 Bit Errors (C). F = iMHz. R = 1 in 10 176
B10 Distribution of 2 Bit Errors (D). F = 1MHz. R = 1 in 10 177
B11 Distribution of 3 Bit Errors (E). F = 1 MHz. R = 1 in 10 178
B12 Distribution of 4 Bit Errors (F). F = 1 MHz. R = 1 in 10 179
B13 Distribution of 5 Bit Errors (G). F = 1MHz. R = 1 in 10 180
B14 Distribution of 6 Bit Errors (H). F = 1MHz. R = 1 in 10 181
B15 Distribution of Separate Error Occurrences 183
B16 Multi-Bit Error Characteristics 184
B17 Distribution of All Errors (A). F = lOKHz. R = 1 in 10 185
Figure Title Page
Cl Circuit Schematic of the Analogue Multiplier 192
C2 Internal Schematic of the RSI 495 193
F1 Probability Distribution Normal (Gaussian) Characteristics 235
List of Tables
Table Title Page
1 System Timing and Delays 40
2 Peak Throughput as a Function of Vulnerable Period 108
3 Peak Throughput as a Function of System Model 110
4 Simulated and Theoretical Throughput Figures 112
5 Measured Peak Throughput - no interference 128
6 Measured Throughput - with interference 132
7 Alternative Protocol Throughput - short re-scheduling delay 135
B1 Error Generator PROM Details 164
B2 Error Generator Board 1 - Chip List 165
B3 Error Generator Board 2 - Chip List 166
Acknowledgements
This research project was supported by a grant from the Australian Telecommunications and Electronics
Research Board (ATERB).
The project was supervised by Dr. C. naRanong and Mr. P. Leung, for whose advice and support I am
grateful.
My warm thanks are extended to many people, in
particular:-My wife, Moira, for typing this thesis
My friends and colleagues at F.I.T., for their help and encouragement
Mr. F. Hayward, for laying-out the printed circuit boards
+ Mr. R. Ives, Mr. M. Dow, Mr. M. Faulkner and Mr. J. MacLeod, for their many informative
discussions
Abstract
Local Area Networks (LANs) have become fairly common in recent years. This thesis considers the
application of Spread Spectrum (SB) communication techniques to the implementation of a LAN.
Basic SS techniques are described and a model of a LAN using these techniques is developed. The major
difference between this LAN and most other l-AN implementations is that in this system many nodes (or
stations) may transmit concurrently. The primary feature of this model is the ability to distinguish between
transmissions intended for different users by the address code used to modulate the data. This is called
Code Division Multiple Access (CDMA). The properties of the codes, allocated to each node in the
network, are of paramount importance in a CDMA system. Several code allocation schemes are
considered in order to find one with the most suitable properties. System timing and synchronisation
concepts are also considered, since they, together with the code allocation scheme selected, determine
the characteristics of the system.
The hardware designed to implement and control network functions is described. Tests carried out to
verify the operation of the Independent hardware modules are also detailed. The ability of the system to
synchronise and transmit data in the presence of noise is tested, prior to complete system testing and
throughput measurement.
CDMA is used to separate information on different channels but there is still the need to consider possible
contention within a channel. A Carrier Sense Multiple Access with Collision Detection (CSMA/CD)
mechanism is used for this purpose. A theoretical model of a suitable mechanism is developed and
simulated. The theoretical and simulated results are compared and used to predict the results expected
This thesis concludes with a discussion of the major features highlighted by this development project.
Theoretical, simulated and actual measured results are also compared. Cost and certain system
performance parameters are compared with those of a more conventional CSMA/CD network, such as
1 INTRODUCTION
1.1 Summary
This thesis contains the description of the research carried out towards the production of a Local Area
Network (LAN) based on Spread Spectrum (SS) techniques [1]. The concept of using Spread Spectrum
techniques is attractive since simultaneous transmissions by several users is possible, using a Code
Division Multiple Access (CDMA) mechanism.
The evolution of the requirement, a brief introduction to the essential theory and a precis of the
contemporary Spread Spectrum LAN research projects are all outlined in chapter 1. An outline of the
project design criteria and system specifications are included in chapter 2. The choice of code generation
and distribution is crucial to the performance of a CDMA system. Chapter 3 briefly outlines the different
coding schemes considered before a final choice was made. After considering several schemes, a
synchronised system was adopted as an appropriate code allocation scheme. Timing and code related
matters are inseperable in a synchronised system; because of this, aspects of code recognition and
collision detection and certain system timing concepts are also described in chapter 3.
Chapter 4 describes the hardware required to generate the codes and meet the timing requirements etc
outlined in previous chapter. Photographs of the two printed circuit boards are also included to aid
description. Where individual circuit modules have been tested in isolation the tests descriptions are
included with the details of the hardware of that particular module. Multi-module and integration tests are,
however, detailed separately in chapter 5. Since the hardware is described in terms of the individual circuit
modules the complete circuit diagrams, for each of the two boards which constitute a system node, are
The hardware described in chapters 4 and 5 represents the physical components of the system; it is the
software which controls the hardware, however, in which the higher level system protocols are embedded.
Theoretical and simulation models of channel throughput were developed in order to predict system
performance before the control software was written. These models are described in chapter 6. The control
software and the tests carried out to verify system performance parameters are described in chapter 7.
A discussion of system performance parameters and ideas for further research are included with an overall
evaluation of the research project in the conclusions section, chapter 8.
The aim of this thesis is to describe the main points of the research carried out towards the development
of a Spread Spectrum LAN. For this reason all of the control, test and peripheral programs which were
written are included as appendices rather than in the main body of the text. Details of special purpose test
equipment, photographs of the circuit boards and complete circuit diagrams are also included as
appendices.
1.2 The Emergence of Local Area Networks
The advent of the microprocessor has had a significant impact on society. The substantial reduction in
the cost of computing power has resulted in the widescale use of computers for all kinds of data
manipulation and storage. Magnetic storage devices such as floppy disks have, to some extent, replaced
paper as a means of intra and inter company data transfer. Local Area Networks (LANs) were primarily
developed to allow the sharing of expensive resources, but their development has also allowed the sharing
of data between interested parties without the need to manually transport disks, paper tapes etc. The
expanding need for data communication channels in L^Ns has increased the pressure on the available
transmission bandwidth. This has led to developments in two broad areas : the extension of the usable
The ever increasing use of LANs has brought with it two problems with respect to the protection of data.
First it is necessary to protect the data against interference, be it deliberate or othenA/ise, in orderto ensure
delivery of correct information to the correct user. Second, as more proprietory information is appearing
on data bases, it is becoming increasingly necessary to protect the information against prying or
interception. Society has, indeed, become information conscious to the extent that the acquisition and
protection of data has become an industry in its own right.
SS techniques, which were originally developed in the mid 1950s [2] for military use as a means of
providing a jam resistant communication link, have only recently been considered seriously in a
commercial or civilian environment [3]. Areas of interest include mobile radio, radio telephony, amateur
radio and satellite communications [4].
13 Spread Spectrum in LANs
The adaptation of SS techniques to the development of a LAN appears to offer some advantages in the
areas of concern mentioned above. Its well known interference rejection capabilities [5] could be used to
advantage in allowing the system to work in an environment where electrical interference might be a
problem and where the use of alternatives such as fibre optic cables might not be appropriate[6,7]. SS
systems, by their very nature, also offer possible benefits [2,8,9] in the area of data privacy.
One definition of SS [5] which adequately reflects the major characteristics of this technique is as
follows:-"Spread Spectrum is a means of transmission in which the signal
oc-cupies a bandwidth in excess of the minimum necessary to send the
code is then used at the receiver in order to despread the signal and
facilitate data recovery."
What this definition means is that the data is modulated with the spreading code and that, through a
correlation process, the receiver restores the signal to its normal bandwidth and, in doing so, it enhances
the desired signal while substantially reducing the effects of interference and noise. Overall, the
communication channel capacity is not "wasted" because with a suitable selection of spreading codes
(having low crosscorrelation properties) several nodes may simultaneously transmit messages over the
same channel, with low, predictable, interference between nodes.
A LAN, where multiple nodes use a single communication channel - one pair at a time, is a prime candidate
for the application of SS techniques. By using CDMA techniques, alternatively called Spread Spectrum
Multiple Access (SSMA), it is possible to have several multi-pair communications in progress
simultaneously [10,11]. Being inherently multi-user, CDMA techniques have the potential to increase the
network's throughput, under conditions of heavy usage, by allowing many pairs of nodes to communicate
simultaneously, thus reducing contentions.
The three primary methods of spreading the data transmissions are
[5,12]:-Direct Sequence - in which the data is directly modulated with a fast pseudo random code
sequence.
Frequency Hopping - in which the carrier which is modulating the data is caused to hop from
Time Hopping - in which the time channel allocated to a particular transmission is changed
in a pseudo random manner.
1.4 Literature Survey and Existing Systems
A survey of literature revealed many papers on Spread Spectrum techniques and many more on Local
Area Networks, but only four papers which described research which combined both [13-16]. Several
more papers relating to one of the four existing research projects were published subsequently. These
papers described the project at various stages of its development, the most recent [17] was used as a
reference. The projects described were at various stages of completion, varying from systems which had
been extensively tested to those which had been simulated, but for which no hardware had been built.
The characteristics of each system in brief are as
follows:-1.4.1 System A [13 and 17]
Smythe and Spracklen [13] describe their SS LAN system, and the software simulations used to test it, in
general terms. Spracklen et. al. [17], however, give a much more comprehensive descnption of the system.
The system, called SPREADNET, is a bus topology system which is connected via fibre optics, and is
aimed specifically towards military applications, in this network, which can be up to 2 km. in length, as
many as 150 users can be accommodated. Direct sequence modulation is used and encoded data is
transmitted in baseband at 100 M bits/sec. Each node controller uses a 12 MHz MC68000 microprocessor.
system then informs the transmitter and receiver of the choice of codes. Contentions are avoided by this
elaborate network management interchange before logical code to physical device mapping is achieved.
All codes allocated in this manner are encrypted before delivery and are protected by a two key
cryptographic algorithm in conjunction with the Data Encryption Standard (DES). Dynamically allocated
codes are also used by the individual node controllers to transmit network management information
around the system.
Synchronisation is achieved by means of polarity coincidence correlators, and digital correlation is
performed continuously to overcome tracking problems. Modulation and demodulation are handled by
dedicated hardware (custom programmed logic arrays), and a sliding correlator is used in conjunction
with polarity coincidence correlation for data recovery.
1.4.2 System B [14]
System B was developed, to investigate network efficiency and performance criteria and compare them
with the classic Frequency Division Multiple Access (FDMA) ALOHA type of network. The system is cable
connected, and used "uplink' and "downlink' separation of transmission and reception paths interfaced
via a "Repeater and Sync generator". Bus topology and direct sequence (DS) modulation are used. Bit
synchronisation is achieved via a sophisticated mechanism whereby the Repeater and Sync generator
periodically interrupts traffic to inject sync information for each user. This must be done with sufficient
frequency so that the local clocks do not drift by more than one chip bit period between updates.
The system is designed to accommodate voice and data. Voice or data bits are transmitted in packets.
or data, are modulo 2 added to the direct address code sequence. The resulting binary array then balance
modulates a high frequency carrier which is transmitted in the uplink direction. The Multiple Access
protocol is via point to point CDMA, with the destination address being used, but no code allocation details
are included.
1.43 System C [15]
This system utilises what the designers call "a non-processed fibre optics bus", where non-processed is
defined as supressing the entire command and address part of the bus. A distributed star topology is used
to implement the bus, which is capable of supporting up to 25 users. Distributed 5 port optical couplers
are used to allow a bus do be developed which does not use handshaking or a master-slave configuration.
Fibre optic interconnections are used and modulation takes the form of Frequency Hopping superimposed
upon a Direct Sequence modulated data signal. 15 frequencies with a separation of 15 MHz centred on
155 MHz are used for the frequency hopping component, and a processing gain of 127 is used for the
direct sequence part. Surface wave acoustic convolvers centred on 155 MHz are used for synchronisation.
1.4.4 System D [16]
For this system a fibre optic connected ring network and a separate synchronisation bus are used. Both
synchronous and asynchronous data is catered for in the system.Node addresses are cyclically bit shifted
versions of the one m-sequence. The sync signal sent from the Sync Node is also a bit shifted m-sequence.
for node #1 from recirculating in the system. Each node conducts an "in-channel" busy test before
transmitting. When a node is transmitting it switches its receiver and transmitter m-sequence generators
to the destination address. This ensures that no collisions can occur in that channel as the node would
remove from any signal any component modulated with the same address code. It does, however, mean
that a node may not transmit and receive at the same time.
The research described in these papers appeared to be concentrating on the high speed, extremely
sophisticated end of possible applications. Considerable use was made of custom designed VLSI devices,
multiple high speed correlators etc. Network management, sophisticated synchronisation, layered SS
techniques, encryption and dynamic address code allocation were some of the other advanced features
of the systems referenced. Three of the systems used, or proposed using, fibre optic interconnections
and only one used cables. This concentration on the "high end" of possible applications left considerable
scope for the development of a SS LAN which could find applications where the advanced features
described above might not be appropriate (see System Specifications, section 2.4) and systems such as
those described above may be too complicated.
1.5 Autocorrelation, Crosscorrelation and Orthogonality
The correlation between two signals gives an indication of the similarity between the signals, as a function
of the time displacement (T). The crosscorrelation between two signals v(t) and w(t) is defined by the
scalar product shown below [18]
Thus, if the correlation value is high the signals have a marked degree of similarity; and if the
correla-tion value is very low the signals are essentially dissimilar. The autocorrelacorrela-tion funccorrela-tion is defined as
the correlation of a signal v(t) with a time displaced version of itself v(t-T) and is given
by:-R W ( T ) = by:-RV(T) = <v(t),v(t-T)> (2)
If |RV(T) I is large then the inference is that v(t) is very similar (proportional) to ±v(t) for that particular
value of T . Conversely if RV(T) = 0 then, at that particular value of T, v(t) and v(t-T) are said to be
orthogonal.
For a signal z(t) which is a summation of two signals v(t) and w(t), such that 2(t) = v(t) + w(t), the
correlation with one signal v(t) would be given by
RZV(T) = RV(T) + RWV(T) (3)
and if the component signals are orthogonal at this particular value of T ie. if
RZV(T) = RV(T) (5)
This extraction of a single correlation function from a signal which is the summation of two or more signals
is the basis upon which CDMA relies.
1.6 Features Required in CDMA Codes
In a CDMA system where one node is distinguished from another by means of the code used to modulate
its data, the selection and allocation of codes is of prime importance. The address codes used must have
certain properties [5,8] i.e.
they:-i) must be easy to generate.
ii) have randomness properties.
ill) have selectable length (long) periods.
iv) must be deterministic i.e. can be synchronised.
v) must be orthogonal
be:-vi) difficult to reconstruct from a short segment.
It can be seen that properties i), iv) and vi) are somewhat contradictory since, if it is simple, deterministic
and easy to synchronise for the intended receiver, it will probably prove to be relatively easy for an
interceptor to "break" the code. Since, however, cryptographic integrity is not a primary requisite of this
work, property vl) may be omitted thus opening the way to use codes which have only the first five
properties.
1.7 IMaximal Length Sequences
The most commonly used type of code which meets these five basic properties is the Maximal Length
Sequence (MLS or m-sequence). The normal method of generating these codes is using Linear
Feedback Shift Registers (LFSR) as illustrated in Figure la. For a code to be a maximal length code it
must have a length, N, which is equal to 2"-1, where n is the number of shift register stages in the generator.
Tables are available [19] which show the feedback taps necessary to generate m-sequences for up to 34
shift register stages. In an m-sequence all binary n-tuples, except the all zero state, are present. By
setting the initial contents of the shift registers to 0001 the pattern shown as code Cx in Figure 1 b would
result. This pattern repeats after 2^-1 = 15 bits. Figure 1 b also shows code Cy which is the result of
cyclically shifting code Cx by 1 bit such that Cxk = Cyk-i where k represents the bit position.
The signals v(t) and w(t) in section 1.5 were continuous signals. The autocorrelation and crosscorrelation
functions do, however, have a direct translation into discrete pseudo random signals such as
m-sequences. By defining the ± 1 sequence Cx'k = 1-2Cxk (where Cxk = 0,1 - see Figure 1 b) then
O
d
Q;
a
djo
Q-d
d
CD
CD
^ — I
T 1
CD
^ — I
CD
CD
CD
CD
V.; 1
CD
CD
CD
, •
CD
CD
CD
^ — I
This is the Periodic Autocorrelation of the m-sequence taken over the length, N, of the sequence, and
T is in whole bit increments. [5]
The Periodic Crosscorrelation of two sequences Cx' and Cy' would similarly be given by
RCx'Cy' = S Cx'kCy'k (7)
1
which is a bit by bit summation of the number of bits in code Cx' which are the same as those in code Cy'
over the length, N, of the codes. The periodic autocorrelation and crosscorrelation functions are of
extreme importance when considering SS systems.
1.8 Basic Spread Spectrum Theory
This research project uses the Direct Sequence method of data spreading, and the description will
concentrate on this aspect. The pseudo random binary sequence used to spread the data is also
commonly known as the "Chip" sequence. Figure 2 illustrates a conceptual model of a single channel
direct sequence system. In this system the chip sequence is used directly to modulate the data in
baseband.
Each data bit d(t), as illustrated in Figure 3, of energy Eb and duration T, may be represented by [5]
QJ
E
i
QJ
E P
+
i5
d
c
O)
Q.
u
c
d
d
p
d
c
QJ QJ $
P
QJ
PQ
Q .
JZ
iA
c O P
'QJ
CO
QJ
L.
3 O)
This one dimensional data bit is multiplied by a two level ± 1 chip sequence, C'(t), running at a frequency
of fc chips/sec, ie. a total of fcT chips per data bit. The resultant sequence d (t)C' (t) is then a fcT dimensional
signal. The relationship between the data and chip signals is shown in Figure 3
The ratio of the dimensionality of the chip sequence to the data is called the "Processing Gain", and is
defined as
:-Processing Gain = Gp = Bss (9)
BD
Where Bss = Bandwidth of the SS Signal and BD = Bandwidth of the Data Signal
The numerical value of the processing gain is an indication of a power improvement factor, which a
receiver, possessing a copy of the transmitter's chip sequence, can achieve by a process of correlation.
The processing gain gives an indication of the interference rejection capability [5].
If the "chipped data" signal, d(t)C'(t), is transmitted in the presence of an interfering signal J(t), the
received signal would be
r(t) = d(t)C'(t) + J{t) 0 < t < T (10)
At the receiver the correlation process is carried out by multiplying the received signal, r(t), with the same
fT
U = V(Eb/T) r(t)C'(t) dt (11)
0
From equation (11) it can be determined whether + V(Eb/T) or - \/(Eb/T) was sent, depending on
whether U is positive or negative. The integrand in equation (11) may then be expanded as follows
„2
r(t)C(t) = d(t)C"^(t) + J(t)C'(t) (12)
And, since C'(t) = ± 1 ( .-. C'^(t) = 1), the above equation may be rewritten as
r(t)C'(t) = d(t) + J(t)C'(t) (13)
With suitable filtering the high frequency component J(t)C'(t) may be removed and the original data signal,
d(t), recovered.
This fact can be illustrated by inspection of the the spectral occupancy of the signals shown in Figure 4,
where the power spectral densities of the data signal, d(t), and the spread data signal, d(t)C'(t), are
sketched. The data signal may be extracted by using a filter with a bandwidth of fd Hz. The fraction of
power due to the interfering signal which can pass through this filter is then 1/fcT. Thus the data can have
an effective power advantage over the interfering signal of n = fcT, i.e. the processing gain, defined in
d
c
O)
(>)
o
> ,
u
d
a
3
u
u
[Zl
"d
L
P
U
QJ
CL
00
QJ
In equation (13) the jamming signal J(t) may be an external interference signal, eg. nearby high voltage
equipment, and/or it may be interference from other transmitting nodes. The rejection of the other nodes
transmissions as noise depends upon the orthogonality of the codes [20] used for spreading each node's
data.
1.9 Multiple Access in a Spread Spectrum System
The concept of simultaneous multi-access is illustrated in Figure 5. This diagram shows a number of
transmitting nodes (n) and a single receiver (node #x) (where 1 < x < n). At each transmitter the data
bit, dn(t), is modulated with an address code, Cn'(t), to form the output, Sn(t), such that
Sn(t) = Cn'(t)dn(t) (14)
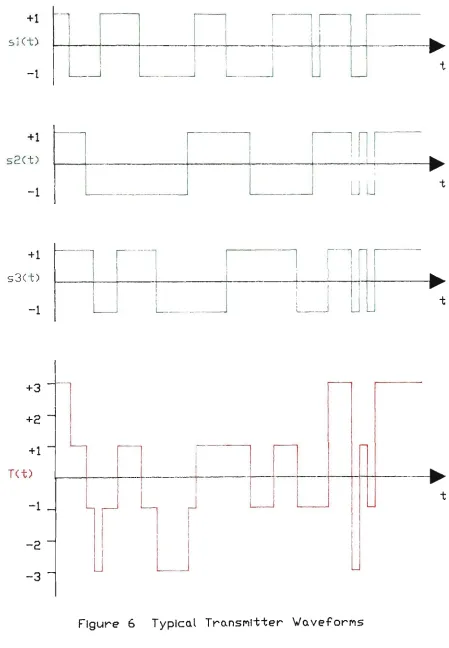
The signal from each transmitter is then "added into" the transmission medium as illustrated in Figure 6,
to produce a total transmission signal T(t) of the form
T(t) = si(t) + S2(t) + S3(t) + Sn(t) (15)
n
2 Sn(t) (16)
1
The transmission medium may be subjected to external noise or interference, J(t), which would then result
/-\
ii X
75
QJ CLP E
d 3
L T5
CD
QJ
75
P c
c d
QJ75
O
U
0)
<-cr
o
d
^T)
>75
c
1—1d
p
d
o
n
c
O)
l/l
d
4^
d
75
O
Cu
1 %d
'J
75
O
21
d
c
CD
W
75
QjP
P
r
in
c
d
1.
P
• - • ^d
P
o
h-0)
u
c
Cu
.' QJc+-f QJ P 1—1 ,
d
c
G)
in
75
<\) > -—* QJ U QJ0^
p "^
75
^
cu
+1
s j C t )
- 1
u
- •
•t
+1
s2(-t)
- 1
II
Ii
L
^
W
t
+1
s3(t)
-1
ir"
J u
•t+3
+2
+1
ret)
-1
- 2
- 3
i
1
1 r—' ' ]
J
1
_
1
1
•
r(t) = T(t)-h J(t) (17)
At the receiver the received signal, r(t), is demodulated by multiplying with the address code for that node,
Cx'(*). and, from equation (11)
r(t)Cx'(t) = dx(t) + I " Sn(t)Cx'(t) + i Sn(t)Cx'(t) + J(t)Cx'(t) (18) 1 x + 1
By suitable filtering the data signal, dx(t), may be extracted from all of the other components indicated in
equation (18). In this manner any receiver may extract its own data from all of the other signals which
have been simultaneously combined onto the network, ie. the receiver may access its own data by using
2 OUTLINE OF THE RESEARCH
2.1 Summary
Chapter 2 outlines the aims of this research project and the the breakdown of the overall task into smaller
packages with identifiable milestones. A brief description of the potential advantages of SS technology in
a network situation is then given. Finally, the system's network specifications are detailed.
2.2 Design Aims
The primary aim of this research is to produce a LAN using SS techniques, and to evaluate some of the
performance parameters of the system produced. The project should use either twisted pair or parallel
pair cables as the interconnection medium in order to maintain the simplicity of the design. The overall
network should use standard, off the shelf, components wherever possible.
In order to satisfy these requirements the research was divided into separate sections
:-Selection of appropriate coding sequences.
Development of timing, synchronisation and decoding philosophies for these sequences.
Development of a d riving technique suitable to ensure that the connection or disconnection of a station
(or a number of stations) would not substantially affect the electrical characteristics of the network.
Design of data recovery hardware.
• Design of microprocessor control circuit for the system.
Investigation Into the hardware and software protocol structure to fulfil the requirements of the lower
levels of the International Standards Organisation (ISO) seven layer model.
Demonstration of concurrent transmissions.
23 Spread Spectrum vs Current Networks
Current bus and ring LAN topologies typified by Ethernet and Cambridge ring [21,22] respectively employ
some form of (asynchronous) time division multiplexing. This may be in the (more or less) fixed
compartment format of Cambridge Ring or the "packet message" type format of Ethernet. Whichever
system is used, any node wishing to access the network must wait until a time when no other users are
transmitting. The node will then transmit at a high frequency in the order of 10 MBits/sec into the system.
The overall effect is that each node emits bursts of data at high bit rates for relatively short periods, and
then remains dormant for a much longer period.
Special chip sets (e.g. Intel 82586), capable of this high speed "bursty" type of transmission have been
very modest data rates of a few bits per second would need to be able to accommodate these high speed
transmissions.
In a SS system, however, the node would only need to be able to cater for a data rate much more modest
than the 10 M bits/sec of Ethernet. This reduces the need for specialised high speed or customised devices
at each node and increases the use of standard, commercially available, components [23]. This may well
allowa L^N to be used In areas, hitherto considered unsuitable, because the cost component outweighed
the possible advantages.
2.4 System Specifications
The primary specifications of the system are as follows
:-. The system will use a bus topology as shown in Figure 7, with separate Data/Network and
Synchronisation lines.
. The node interconnections will be via twisted pair or parallel pair wires for simplicity and ease of
connection/disconnection. The cable is terminated with an appropriate resistance at both ends in
order to minimise mismatches and reflections. Using this mechanism means that connections may
be made at any point in the system with "Tap-in" connectors and not only at discrete intervals as
would be the case with a fibre optic system (requiring optical couplers) or a co- axial system (requiring
"T pieces). It means, furthermore, that in orderto accommodate a new node there would be no need
to break the line to insert an optical coupler or "T' piece If a conveniently situated connection point
a 1)
+^ ^
d - "
Q
QJ
i n
75 #
O
c
QJ
L
3
P
U
3
L
P
00
in
3
pq
- ^
L
O
^
P
QJ
t
l/l QJ
+^
CL
E
O
u
QJ
CO
75 4 t
O
c
QJ
High impedance current drivers will be used to interface onto the network line, thus ensuring minimum
perturbation to overall network traffic when nodes connect or disconnect.
. These drivers are not necessary for the synchronisation line. One node (eg. node #1) acts as the
sync transmitter and all other nodes use the transmission on the sync line to recover clock and code
synchronisation information. The overall synchronisation means that all data may be transmitted in a
synchronous, rather than an asynchronous, format. This has significant implications in the choice of
code allocation scheme and in the implementation of the system timing and data recovery sections
(as shown in chapters 3 and 4).
. The system will use the point to point communication protocol. Each node will be allocated its own
chip sequence, or spreading code, which will act as an address for that node; thus if node # 1 wishes
to transmit to node # 2 then node # 1 will modulate its data with the chip sequence for node #2.
Hence the transmitter of each node must be able to modulate its data with any recipient's address
code. In this manner simultaneously multi-pair transmissions are allowed with transmission channels
being identified by the codes being used to modulate the data, ie. CDMA. It is obvious, however, that
no two nodes may simultaneously transmit to the same recipient, otherwise a collision would occur.
The multiple access features reduce the probability of collisions occurring but do not eliminate them
totally.
A Carrier Sense Multiple Access with Collision Detection, (CSMA/CD), type of protocol will be used
to detect and resolve intra-channel collisions. Each transmitter will have a built-in demodulator to
pre-check for traffic in the desired channel and to continuously check for collisions whilst transmitting.
Each node, therefore, requires two demodulators - one for monitoring the channel for its own received
messages and the other for collision avoidance and detection. The first demodulator works exclusively
rule of thumb which indicates that the number of potential users is approximately 10% of the
3 CODES AND SYSTEM TIMING
3.1 Summary
Chapter 3 outlines the properties required of the codes in a CDMA system. A brief description of each
coding scheme considered is given. This is followed by a description of the important timing characteristics
of the system.
3.2 Coding Scheme Selection
Several possible generation and allocation schemes were considered before one was finally chosen. The
properties of major concern were
:-Simplicity of generation and synchronisation.
Crosscorrelation between members of the code set.
The first three schemes considered (schemes A, B and C) were designed to allow the network to be
operated asynchronously, ie. the data bits from each user do not have to coincide. The other two schemes
considered (schemes D and E) were designed for synchronous system operation, where data bits from
3.2.1 Scheme A - Segments of Long m-sequences
In this scheme the concept was to allocate to each node a segment of M bits of a much longer code of
length N. Every node would generate the same long MLS, each node would then be identified by the
segment of this long code allocated to it. The crosscorrelation between these segments transmitted
simultaneously would determine the interference between one transmission and another.
Lindholm [24] found, in his consideration of the moments of the distribution of weights of M-tuples of
MLSs, that this type of system gave more predictable crosscorrelation values as M tends towards N. This
figures would, in the limit, result In the full code length N being used and in fact producing the
autocorrelation function of the MLS. For this reason this scheme was not considered further.
3.2.2 Scheme B - Different m-sequences of the Same Length
This scheme considered the use of different m-sequences. Each node would be allocated a series of tap
settings which would be used to produce a different m-sequence. Each m-sequence would be of identical
length since shift registers of the same length would be used in each node. Producing m-sequences in
this manner is a relatively straight-fonA^ard procedure and tables of polynomials for the production of such
sequences are readily available [19]. Some sequences do, however, require many taps to produce, and
since each transmitter must be able to transmit to any receiver, this implies that each node must have
sophisticated hardware in orderto produce any code allocated.
The crosscorrelation between sequences produced by Linear Feedback Shift Registers (LFSRs) of the
same length but with different tappings was considered. A problem arises with this scheme in that there
number of codes available for allocation under this scheme would, therefore, restrict the number of users
to 60. This, coupled with the level of correlation interference indicated above, was considered significant
enough to prevent further investigation of this scheme.
* N o t e A maximally connected set is one in which all members of the set act as part of a preferred pair with any other member of the set [20]. A preferred pair is a pair of m-sequences of period N = 2"-1
which has a "3 valued" crosscorrelation function where the peak magnitude of the crosscorrelation is
given by
[27]:-,2(n + i)/2^., for n odd
|2(n+^;/^ +1 for n even n = mod 4 (19)
For N = 1023 the maximum crosscorrelation for a preferred pair is 65, and the three correlation values
are -65, -1 and +63. (Note the peak value 65 is given by 2^^°+^^^^+1).
3.2.3 Scheme C - Gold Codes
The third scheme considered the use of GOLD codes allocated to each node. Gold codes are a class of
periodic sequences which provide larger sets of sequences with predictable crosscorrelation properties
[20,25]. A set of Gold sequences of period N = 2"-1 consists of N -»-2 sequences. The adoption of this
scheme would, however, require each sequence generator to have a 20 bit shift register, to generate the
1023 bit codes. Two such registers would be required to cater for the fixed receiver and the switchable
transmitter. The transmitter stage would also require a method of pre-setting the LSFR with the required
seed in order to generate the particular Gold code required. The correlation between members of the
Gold Code set is the same as that between the preferred pairs of m-sequences used to generate them
3.2.4 Scheme D - Phase Shifted Versions of a Single m-sequence
Taking advantage of the fact that the whole system could be synchronised means that a code allocation
scheme, using MLSs, could be devised such that the codes allocated would not be produced by different
shift registers, rather that a single m-sequence would be used throughout and each node would be
allocated a phase or bit shifted version of the same sequence. The crosscorrelation between codes of
each node would then become the autocorrelation of the single code. Codes allocated on this phase
shifted basis would have the following
format:-Cn-1'k = Cn'k-s (20)
n indicates the nth code and s is the separation factor, ie. the phase shift between successive codes.
Using separate synchronisation and data lines means that the synchronisation overhead could be kept
to a minimum by using phase zero of the network's m-sequence as the synchronisation pattern. Locking
to the sync code automatically synchronises the address codes which are phase shifted versions of the
same sequence.
With this scheme, however, each user injects approximately 0.1 % error in the correlation process of every
other user. This may be explained by inspection of the autocorrelation function of a m-sequence as shown
in Figure 8 and by consideration of the autocorrelation value of a two level m-sequence, Cx', which, from
equation (6), is given by [5]
C/0
1 ^
i ^
1 \ ^
+>
u
<4-\ • t - H
+
U-1/
f
•7)
ll
cq
r)
OJ
o
T—1
O
c
o
- pu
c
3 L_
ocorrelatio
n
8
Au
t
0)
1.
It can be seen that for zero phase shift the correlation is equivalent to the length of the code (i.e. 1023 in
this case) and that for all other phase shift positions the correlation is -1. This residual -1 effect from every
code being simultaneously transmitted causes this decrease in the correlation output at the receiver. It
is obviously unsatisfactory to have this progressive level of interference caused by other users, and
directly proportional to the number of these other users. These observations are supported by the findings
of Hasegawa, Hirosaki and Sawai [16] in their performance analysis of a fibre optics system.
This scheme has two basic drawbacks, firstly the cross channel interference inherent in m-sequences and
secondly the fact that the code length Is an odd number, 1023. A more suitable code would be a binary
multiple in length, generators and correlators etc. could then use binary counters directly, and would have
ideal 'Iwo valued" autocorrelation values of 0 and N, where N = 1024 in this case. This being the case
it was decided to attempt to modify the m-sequences to eliminate this residual interference effect inherent
in the m-sequences.
3.2.5 Scheme E - Modified Maximal Length Sequences
This scheme uses "Modified" Maximal Length Sequences. Each node is allocated one of these Modified
MLSs, which is essentially a MLS cyclically bit shifted within its 1023 bit length, refer also to Figure l b ,
with an additional binary zero transmitted as bit 1024. This address code generation concept is illustrated
in Figure 10. Because of this extra logic zero ail codes produce an additional correlation factor of"-(-1"
when compared to the m-sequence value shown in equation (21). This modification to the MLS produces
a code with the ideal 1024, 0 crosscorrelation characteristics illustrated in Figure 9. The correlation values
produced by code members of this system will then be given by
:-|RmCx'(t)|
N + 1 T = 0, N, 2N,
c
75
Oi_
CD
75 0 LO U T ^
75 - H
75 <i ! ^<^^
^n^
CO 1/1cu -P
2.5
— _» ^—_oo
I1
>- p
'c?
Cl
cu
CD
^—1r
> "C < — 1 (/) 2 : -p COcu
''^~'C+-o
- pC4-h
[A UCyc
l
: p q N ^
c O H-* U c 3 0 -O - P 1-O
u
o
p 3 OJ oo
\
s:
• p CD c U\
+
U\
_J CO n jo
75 75 O 21 O c O 4-> u c 3 Li_ c O P _^ " Q ;33 System Timing Concepts
This section gives a description of the important timing characteristics of the system. Physical network
dimensions and delay features are also considered. Since the code allocation scheme is so intimately
involved with system timing, those aspects of timing important to code allocation are also described.
Timing and code allocation are vital to data recovery, and for this reason the recovery of data from
transmissions subjected to delays is also considered.
As previously noted, this system allows a node to be connected at any point along the interconnection
medium. Node # 1 is the station transmitting the synchronisation code (ie. phase zero of the system's
"Modified" MLS) onto the sync line, and this node is connected in the centre of both the Data and Sync
transmission lines. The overall configuration may be represented as shown in Figure 11. The
synchronisation information travels in both directions, along the Sync line, towards nodes # 2 and #5,
which are assumed to be at the ends of the transmission lines. Both transmission lines are terminated in
an appropriate resistance to minimise reflections. The clock timing lines in Figure 11 show an example
of possible system delays where the Sync signal takes 1 bit period to reach nodes # 2 and #5. At a Chip
rate of 1.2288 MHz (ie. 1200 Hz data rate multiplied by the 1024 processing gain) this 1 bit delay represents
one Chip Bit clock period, Tc = 813.8 ns. This represents a distance of 244 metres from node # 1 to
node #2 or node #5, or a total distance from node # 2 to node # 5 of 488 metres.
Since node # 1 is the synchronisation transmitter it represents the system time reference zero (Tref) and
it is this time reference which is used to to generate the synchronisation code (Cref'k), which is the zero
phase of the system coding sequence. This signal takes 1 bit period to arrive at node #2. Node # 2 locks
onto this as a reference to absolute system time zero. Node # 2 has therefore, a time reference, Tref-1, or
1 bit delayed from the system norm. Node # 5 is, similariy, 1 bit delayed, and nodes # 3 and # 4 are each
in
-p
S2
cu
1
"f — •
I
cu
* «—1 ! 11 ^
^1
H-11 m .
1 -p
^ 1 ^
I OJ ' ?^ 1. 1 H-t—1 ' 1
1
i
^ T—11
Q-(UL
1—
r
in
i
bi
t
T - H
^
L ii
-p5
1/
2
V
A
-p ^cu
\ ,—1 f y^^ A
t - H
^! -p
SI
cu
.—1
— ^
r
i
-p _Qcu
\ t—<^ 1 '
r1
1
+^ i
^ ^ !t
I
.1
-p 1
SIt—1 .
'
t
1
o
L QJ Nt
CU 1re
f
I— CO ! 1 Ul • pu
cu
l/l < : CD c E ^ 1 •-75
•<—1 c c5
1/
2
> , c31 — '
i
, «
1 g
T ^• / A
C^ ^—1
»—1
cu
c > ^
^ o ,—
j_> - ^ Li_
0 d . ^ U 75 -P
If node # 1 transmits a message to node # 2 using a code which has a separation factor, s, of 2 (ie. Cref'k-2)
it will arrive 1 bit delayed at node # 2 (ie. it should look like Cref'k-3), but since node # 2 has a relative time
reference which is also 1 bit delayed the two delays will cancel and the transmission will appear to node
#2 to be using code Cref'k-2 . Thus, the code which appears as Cref'k-3 with respect to system time
reference, Tref will appear as Cref'k-2 with respect to node #2's time reference of Tref-i.
If, on the other hand, node # 2 transmits to node # 1 , the timing reference of node # 2 (Tref-i) used to
select the transmission address code will mean that any address code selected (eg. one subjected to a
separation factor, s, of x, which produces code Cref'k-x) will appear 1 bit delayed (as Cref'k-(x+i)) with
respect to node#1's time reference, Tref. The transmission from node # 2 will also be subject to a
propagation delay of 1 bit before reaching node # 1 . The transmission would, therefore, appear to be
using code Cref'k-(x+2) with respect to node #1'stime reference of Tref, ie. the transmission code appears
to have a separation factor of x + 2 as far as node # 1 is concerned. In this case the time reference delay
Is added to the data propagation delay to produce this effective delay of 2 bits. Table 1 lists examples
from Figure 11 to explain the situation. In this table column A is the transmitting node, column B is the
receiving node and column C is the total delay as seen by the receiver. This delay is made up of timing
reference delay plus data propagation delay. The calculation of the effective delay for the first two rows
in this table, ie. node # 1 to node # 2 and node # 2 to node # 1 , is shown above. These delays are with
T.?.^!e.l...SYStem Timing an^^
From
A
1
2
2
3
2
1
3
3
2
To
B
2
1
5
2
3
4
1
4
4
Delay (Bits) as seen by receiver
C
Zero
2
2
Zero
1
Zero
1
1
2
It can be seen that the relative delay is dependent on the respective positions of the nodes in the system.
One way of overcoming the difficulties posed by these position dependent delays would be to allocate
fixed positions to each node and measure all time delays etc. and then provide a look-up table to each
node so that suitable compensation could be made. This solution detracts from the flexibility of the
system, but could be used to match the transmitting node's ID with the delay characteristics in the look-up
table in order to provide a means of verifying the transmitter's identity. This would be an attractive
proposition if security was a major requirement of the system. Another solution is to adopt a code
allocation scheme such that codes allocated to each node are selected using a separation factor, s, which
is greater than the maximum accumulation of delays in the system.
Since the maximum system delay is dependent on the length of the transmission lines used, ie. between
node # 2 and node # 5 in the example shown In Figure 11, the maximum delay can be calculated when
the code allocations are being made. In this way no valid code, no matter what delays it is subjected to,
could possibly mimic any other valid code.
3,4 Sliding Correlator
The fact that transmissions are subject to different propagation delays implies that the receiver must be
able to detect its own messages at any point in a time window, with delays up to the maximum propagation
delay in the system. With the two bit delay used in the example above, it means that a receiver expecting
to demodulate a transmission using code Cx'k must be able to demodulate in the range Cx'k to Cx'k-2.
To this end each receiver incorporates a "Sliding Correlator" with which it can scan across this 2 bit
window looking for its own data. If no such transmission is present the correlation should be zero across
the whole 2 bit window and the search process can begin again, if a valid transmission is present the
receiver should be able to determine the delay at which the correlation peaks and use this delay factor
throughout the transmission, as the delay will remain constant.
Up to this point all aspects of code allocation and modulation/demodulation had been considered in the
light of whole bit delays between codes. This is, obviously, impractical in a real system as the delay is
node placement dependent, and the nodes may be positioned at any point along the transmission line.
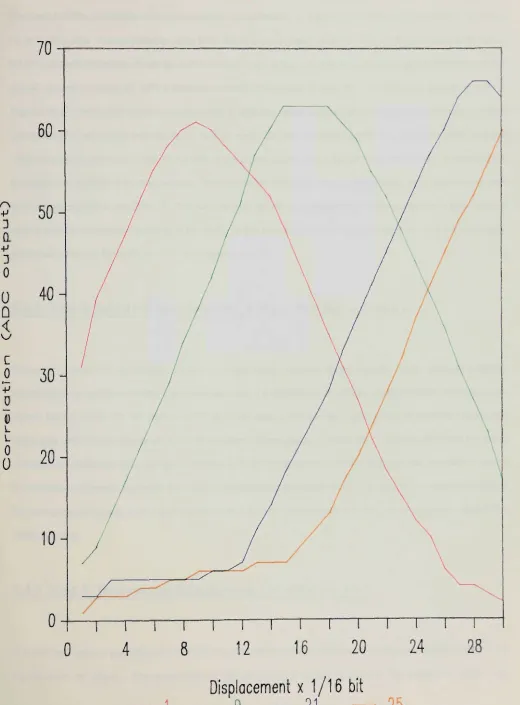
The sliding correlator designed for the system is capable, therefore, of delaying the local correlating code
in increments, v, of 1/16th of a bit upto a maximum of 2 bits. The local correlating code thus takes the
If the received and local codes are separated by more than 1 full bit the correaltion will be 0. As the delay
between the correlating codes reduces the correlation will increase uniformly towards a peak of 1024, as
shown in Figure 10.
3,5 Collision Mechanisms and Characteristics
Having seen that the output of the integrator is dependent on the relative partial chip bit overiap of the
transmitter and the receiver, it is important to consider the possible situation surrounding collisions. A
collision would occur when two transmitters simultaneously use the same destination address code. For
positively colliding transmissions the effect would be to simulate a received signal where the energy of
the data bit being encoded varies between V(Eb/T) and V(2Eb/T), depending on the relative overiap of
the two signals with the local correlating code. The result will be to produce a decision variable with a
value between U and 2U, referto equation (11). For negatively colliding signals, ie. subtractive interference,
the value of the decision variable will be in the range 0 to U. For collisions involving more than two
transmissions, the value of the decision variable may be extrapolated from the relative polarities and
overiaps of the colliding signals.
The node should, therefore, be capable of making a decision based on the magnitude of the actual final
value of the decision variable, and not just on the fact that a prescribed threshold has been reached. The
shape of the correlator output (ie. the value of the decision variable) will not follow the characteristic
inverted cone, illustrated in Figure 10, across the 2 bit sliding correlator window when colliding signals
are present. The node should, therefore, be capable of using this information when deciding whether a