77 |
P a g e
CHARACTARIZATION AND SURFACE ROUGHNESS
STUDY OF HCHCR MATERIAL TO PREPARE
PRECISION STAMPING PUNCH
R. J. Naik
1, S.C.Kulkarni
2, Amar Pawar
31,2,3
Department of Mechanical Engineering, K.L.S’s Gogte Institute of Technology, Belgaum, (India)
ABSTRACT
Objective of present work is preparation of punches by characterization study and using ‘wire electrical
discharge machining process (WEDM). For the proposed study HCHCr material is selected as punch material
which Hardening and Tempering at three different temperature viz.,350 0C, 450 0C, 550 0C by conducting
mechanical testing like Tensile test, Compression test , Impact test Hardness test. The input parameters chosen
for WEDM are Intensity of current, pulse duration time and pulse interval time. To optimize the process
parameters response surface method (RSM) is employed for experimentation where in that we using and central
composite design (CCD) to create design matrix to conduct the experimentation to prepare & study the surface
roughness of precision punches.
Keywords:
High Crbon High Cromium Steel (Hchcr),
Hardening And Tempering, Wire Cut Electrical
Discharge Machining (WEDM) Response Surface Methodology (RSM) Central Composite Design
(CCD), And Surface Roughness (SR), Analysis Of Variance (ANOVA)
I. INTRODUCTION
There are many machining process which used now a days, but to machine very hard materials with more
accuracy it‘s better to go non-conventional machining process. For example preparation of punches which used
in many industries, the main property requirement for punch is hardness and sum other mechanical properties
and also material selection very important. Materials which mainly used for punches is die steels in this paper
HCHCr material used and further it hardening and tempering at three different temperature and test are
conducted to study the properties like tensile strength, compression strength, Impact strength, and hardness of
the material and then based on test results material is selected to prepare punches by using WEDM machining
process and also process parameters are optimized based on Surface Roughness study by using ANOVA
analysis[1].
II. EXPERIMENTAL WORK
78 |
P a g e
Table 1 Chemical Composition HCHCr
Material type Composition in %
carbon 2.10
Silicon 0.30
chromium 11.50
Magnesium 0.40
Nickel 0.31
2.1
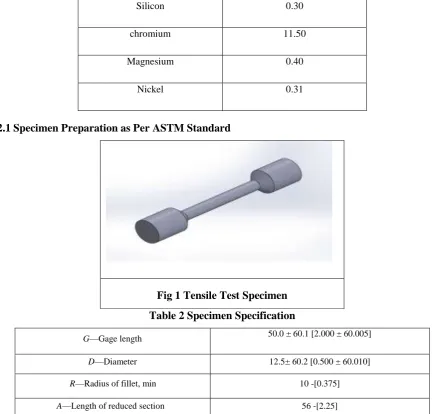
Specimen Preparation as Per ASTM Standard
Fig 1
Tensile Test Specimen
Table 2 Specimen Specification
G—Gage length 50.0 ± 60.1 [2.000 ± 60.005]
D—Diameter 12.5± 60.2 [0.500 ± 60.010]
“R—Radius of fillet, min‖ 10 -[0.375]
A—Length of reduced section‖ 56 -[2.25]
2.2 Impact Test Specimen: (IZOD) as per ASTM E8M
79 |
P a g e
Table 3 Specimen Specification
For material HCHCr
Length in mm 75
Width in mm 10
Breath in mm 10
V- notch angle 45
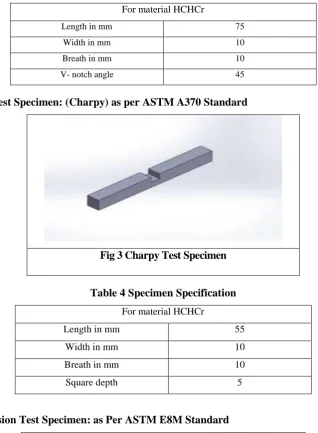
2.3 Impact Test Specimen: (Charpy) as per ASTM A370 Standard
Fig 3 Charpy Test Specimen
Table 4 Specimen Specification
For material HCHCr
Length in mm 55
Width in mm 10
Breath in mm 10
Square depth 5
2.4 Compression Test Specimen: as Per ASTM E8M Standard
Fig 4 Compression Test Specimen
Table 5 Specimen Specification
For material HCHCr
Diameter in mm 12.7
80 |
P a g e
2.5 Hardening Process
To change the hardness of the material or to produce surface that gives the progress is subsequent manufacturing
operation to produce a structure, the general purpose heat treatment is done. The main purpose of hardening
done to develop less than greater hardness when first stage of cooling is done 1000 F within 1 second with skill
full where further cooling is done at sum interval of time at slower rate. Composition of material is specific the
rate of quenching alloy steel where slower quench is done for steel hardening compare to mail carbon steel
hardening there are many quenching methods but over project work we used water quenching method where of
water quenching temperature of water bath must be not rise 80 F therefore 70F is best for quenching generally
for plain carbon steel water or brine quenching media is used because brine consist less tendency to produce
steam pockets to form these pockets are coursed soft or uneven stress next agitation of steel remove the bubbles
which forms on surface material as quenching temperature is reached to 200 F to 25 F the material is dried
carefully without too match sizzle[2].
Fig 5 Hardening Equipment
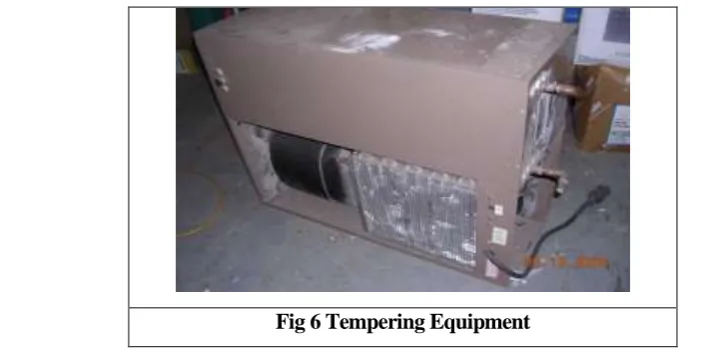
2.6 Tempering Process
To reduce brittleness most of alloy after hardening process material tempered and relive sum of high internal stress
which developed during hardening process where tempering is done slowly from its tempering temperature by
cooling in still air usually tempering is done before the material is cooled from its hardening process where according
to thickness of the material holding temperature and time is varies, but minimum time is one hour. For over work we
take the holding time as 60, 90,120 minutes for different temperature due to more thickness holding time is increased
to one hour for each specimen.
81 |
P a g e
2.7 Tensile Test
For metallic materials universal testing machine designed for the testing. Machine applied hydraulically operated load
and microprocessor controlled for accurate measurement. A variety of grips or holders are used which make this
machine very useful for tensile testing, compression, elongation etc. The digital controls and readout permit accurate
measurement of all applicable data[3].
2.8 Compression test
Compression test gives the material status when it subjected to compressive load from low to high uniformly
until material get fail or fracture. This test gives the standard method to obtain dada for research work.
Compressive test carried out on universal testing machine with very high capacity of compression. Where test
specimen is prepaid as per ASTM standard then suitable testing machine will chosen for get more accurate dada
within time, VERTEX 60HVL universal testing machine is used for testing.
2.9 Hardness Test
Rockwell hardness tester most popular hardness test method, since there is some other methods also used. In
Rockwell hardness test it consist number of different indenter and load equivalent to scale, steel indenter made
very hard which used to make a contact with material where hardness value are obtained directly on machine
dialer. Other test machine is microscope hardness tester which used for thin material[4]l.
2.10 Impact Test
Impact test where material striker by pendulum or drop hammer as supported to static load. Where costume
scientific instrument the impact test is a dynamic test where striking of a specimen falling draft is used for
impact testing, where specimen is made either V notch Or U notch for Izod and Charpy test as per ASTM
standard[5].
2.11 Design of Experiments (DOE)
Design of experiments (DOE) is an engineering tool for analysis where it is systematic technique to engineering
problem solving where it applies different technique and principals at collection of dada for accurate generation
of dada or valued, supportable and defensible engineering conclusion. It also helps to all of above carried under
the constrained or minimum spending of engineering runs time and money[6].
2.12 Full Factorial Design with 3 Factors
A full factorial design indicates all probable combinations of a set of factors. This is the most take in proof
design approach‖ also it is the most costly in experimental resources compeer to other design approach. It
supports both categorical factors and incessant factors with up to nine levels. In full factorial designs, we
perform an experimental run at every possible combination of the factor levels. The sample size is the product
of the numbers of levels of the factors‖. For example a factorial experiment with a two-level factor, a three-level
factor, and a four-level factor has 2 x 3 x 4 = 24 runs[7].
The three inputs (factors) that are considered important to the operation are Intensity of current (X1), Pulse
Duration (X2), and Pulse interval (X3).
Intensity of current, Pulse Duration and Pulse interval can all be varied continuously along their own scales,
82 |
P a g e
Table 6 High (+1) Low (-1) and Mid Value (0) Settings for a Cutting Operation
Factors Low- (-1) Standard- (0) High-
(+1) Unit
Intensity of Current
(X1)
3 4 5 Amp
Pulse Duration
(X2)
30 45 60 µs
Pulse Interval
(X3)
3 4 5 µs
III.
RESULTS AND DISCUSSION
3.1 Tensile Test Results
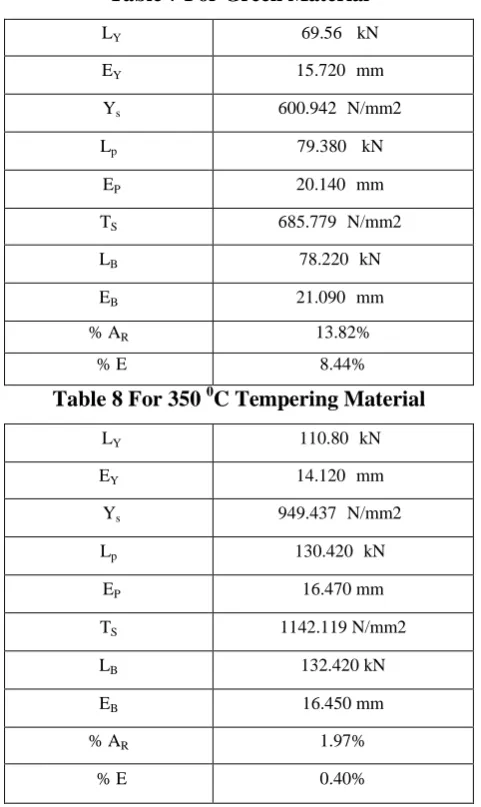
Table 7 For Green Material
‗LY 69.56 ‗kN‘
‗EY 15.720 ‗mm‘
‗Ys 600.942 ‗N/mm2‘
Lp 79.380 ‗ kN‘
‗EP 20.140 ‗mm‘
TS 685.779 ‗N/mm2‘
LB 78.220 ‗kN‘
EB 21.090 ‗mm‘
% AR 13.82%
‗% E 8.44%
Table 8 For 350
0C Tempering Material
‗LY 110.80 ‗kN‘
EY 14.120 ‗mm‘
‗Ys 949.437 ‗N/mm2‘
Lp 130.420 ‗kN‘
‗EP 16.470 mm
TS 1142.119 N/mm2
LB 132.420 kN
EB 16.450 mm
% AR 1.97%
83 |
P a g e
Table 9 For 450
0C Tempering Material
‗LY 106.52 kN
EY 14.700 mm
‗Ys 896.461 N/mm2
Lp 135.600 kN
‗EP 23.970 mm
TS 1141.195 N/mm2
LB 135.600 kN
EB 16.240 mm
% AR …..
‗% E 0.08%
Table 10 For 550
0C Tempering Material
‗LY 117.32 kN
EY 14.560 mm
‗Ys 959.077 N/mm2
Lp 147.360kN
‗EP 24.870 mm
TS 1204.650 N/mm2
LB 147.360 kN
EB 16.130 mm
% AR 0.32
‗% E 0.12%
3.2 Hardness Test Results
Table 11 Hardness Values
Green material 54 HRC
350 0C Tempering material 60 HRC
450 0C Tempering material 58 HRC
84 |
P a g e
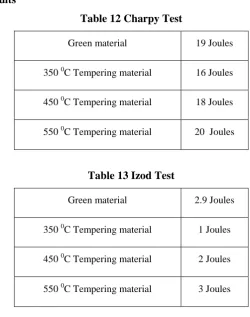
3.3 Impact Test Results
Table 12 Charpy Test
Green material 19 Joules
350 0C Tempering material 16 Joules
450 0C Tempering material 18 Joules
550 0C Tempering material 20 Joules
Table 13 Izod Test
Green material 2.9 Joules
350 0C Tempering material 1 Joules
450 0C Tempering material 2 Joules
550 0C Tempering material 3 Joules
3.4 Effect of Tempering Temperature on Ultimate Tensile Strength
Fig 7 Tensile Strength v/s Temperature
In Fig 7 shows the tensile test v/s tempering temperature where single material tempered at three different
temperature which caused to increase in hardness or other mechanical properties of the materials, in this graph
we can seen that tensile that tensile strength of the material increase as material is tempered where we get higher
85 |
P a g e
3.5 Effect of Tempering Temperature on Impact Strength
Fig 8 Impact Strength v/s Temperature
In Fig 8 shows the effect of tempering temperature on impact strength of the material, where graph is between
the impact strength v/s tempering temperatures in graph we can be seen that impact strength of material is
changed as material undergoes tempering process, where higher value of impact strength is obtained at 550 0c
tempered specimen which nearly at 1200 n/mm2. Where from graph we can seen that the value of impact in
decreases at 350 0c temperature which is mainly at this temperature makes material very brittle and have low
strength.
3.6 Effect of Tempering Temperature on Hardness
Fig 9 Hardness v/s Temperature
The variation is hardness of material HCHCr due to hardening and tempering process as shown in above graph
which plotted as hardness v/s temperature, graph shows all three tempering temperature and respective hardness.
Where hardness is varies frequently with temperature this variation is based on quenching time at materials
quenching during hardening and tempering process, by considering the experimental results and graphs we can
observed that material having higher value of hardness at 350 0c tempering material. But due to high hardness
86 |
P a g e
3.7 Final Selection of Punch Material
HCHCr Tempered at 550 0C
Tensile Strength 1204.650 N/mm2
Hardness 56 HRC
Impact Strength 20 Joules
By considering the all above test results like tensile test results, Impact test results, Hardness test,
microstructure etc. where we get maximum tensile strength of material out of all four readings at 550 0c
tempered material, where in impact test the higher value of impact strength also we get for same tempered
material (at 550 0c), since hardness of material we get higher at 350 0c tempered material but for this value of
hardness makes material brittle in nature which not suitable for preparation of punch. Therefore we select
material which tempered at 550 0c where hardness is nearly around 56HRC which is higher than green materials
hardness 56HRC. Therefore material selected for punch is HCHCr material tempered at 550 0c with tensile
strength 1200 n/mm2, Impact strength 20 joules, and hardness is 58HRC.
3.8 Wire Electrical Discharge Marching Results
Run Intensity of current X1 Amps Pulse duration X2 Micro-second Pulse interval X3 Micro-second Surface roughness Ra Micro-meter
1 5 30 3 4.70
2 3 60 5 3
3 5 60 3 3.30
4 4 45 4 3.90
5 3 30 3 4.20
6 5 45 4 3.50
7 4 30 4 3.20
8 4 45 5 4.20
9 4 45 4 3.60
10 4 45 4 4.20
11 4 45 4 4.40
12 5 60 5 3.90
13 3 60 3 3.40
14 3 45 4 3.20
15 3 30 5 5
87 |
P a g e
17 4 60 4 3.50
18 5 30 5 3.52
19 4 45 4 3.8
20 4 45 3 3
Fig 4.10 Punch Made by WEDM
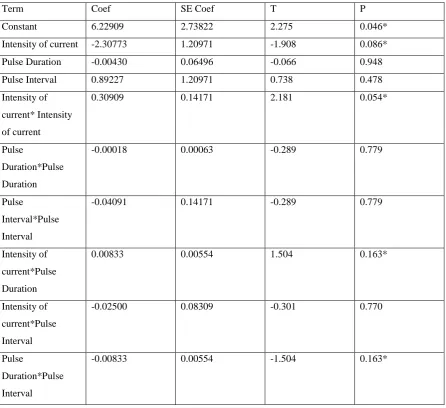
Table 13 Estimated Regression Coefficients for Surface Roughness
Term Coef SE Coef T P
Constant 6.22909 2.73822 2.275 0.046*
Intensity of current -2.30773 1.20971 -1.908 0.086*
Pulse Duration -0.00430 0.06496 -0.066 0.948
Pulse Interval 0.89227 1.20971 0.738 0.478
Intensity of
current* Intensity
of current
0.30909 0.14171 2.181 0.054*
Pulse
Duration*Pulse
Duration
-0.00018 0.00063 -0.289 0.779
Pulse
Interval*Pulse
Interval
-0.04091 0.14171 -0.289 0.779
Intensity of
current*Pulse
Duration
0.00833 0.00554 1.504 0.163*
Intensity of
current*Pulse
Interval
-0.02500 0.08309 -0.301 0.770
Pulse
Duration*Pulse
Interval
88 |
P a g e
S = 0.235005 PRESS = 3.95253R-Sq = 86.65% R-Sq(pred) = 4.48% R-Sq(adj) = 74.64%
In above table 10 shown the Estimated Regression Coefficients for Surface Roughness where we set 85% of
accuracy at this percentage we only get affect Intensity of current on surface roughness. Star mark indicates
these effects.
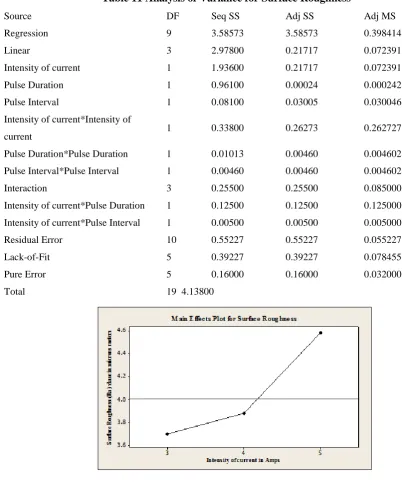
Table 11 Analysis of Variance for Surface Roughness
”
Source DF Seq SS Adj SS Adj MS
Regression 9 3.58573 3.58573 0.398414
Linear 3 2.97800 0.21717 0.072391
Intensity of current 1 1.93600 0.21717 0.072391
Pulse Duration 1 0.96100 0.00024 0.000242
Pulse Interval 1 0.08100 0.03005 0.030046
Intensity of current*Intensity of
current 1 0.33800 0.26273 0.262727
Pulse Duration*Pulse Duration 1 0.01013 0.00460 0.004602
Pulse Interval*Pulse Interval 1 0.00460 0.00460 0.004602
Interaction 3 0.25500 0.25500 0.085000
Intensity of current*Pulse Duration 1 0.12500 0.12500 0.125000
Intensity of current*Pulse Interval 1 0.00500 0.00500 0.005000
Residual Error 10 0.55227 0.55227 0.055227
Lack-of-Fit 5 0.39227 0.39227 0.078455
Pure Error 5 0.16000 0.16000 0.032000
Total 19 4.13800
Fig 11 Intensity of Current v/s Surface Roughness
Fig 11 shown the effect of Intensity of current on surface roughness where we can seen when current increased
between 3 to 4 amps Surface- roughness value Ra also increased slightly around 3.7 to 3.9 where current at 4 to
5 Ra value increased rapidly up to 4.5 as shown in graph. This is because the crater size generated by a single
pulse becomes larger with an increase in single pulse energy. Single pulse energy increases with increasing
89 |
P a g e
Fig 12 Interaction Plot For Surface Roughness Vs Intensity of Current
And Pulse Duration Time
Fig 12 shows the interaction plot for pulse duration and intensity of current With Surface Roughness. Where at
the current intensity 3 to 4 roughness of the material is interact at pulse duration of 40 micro seconds as shown
in above graph.
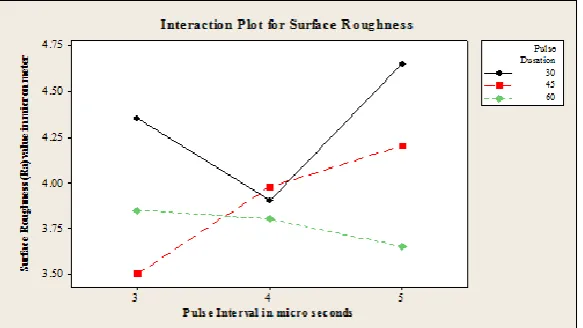
Fig 12 Interaction Plot for Surface Roughness Vs Pulse Duration and Pulse Interval Time
Fig 12
shows the interaction plot between pulse duration and pulse interval with surface-roughness. Where at the pulse duration 30 to 45 micro seconds at the pulse interval of 4 micro seconds surface roughness valueachieved as 3.9.and at pulse duration 30 to 45 micro second at interval of 3.7 surface roughness shows as3.75
IV. CONCLUSION
In the present work characterization and experimental study was performed on HCHCr material to manufacture
stamping punch, which hardened and tempered at three different temperature for characterization study. DOE
technics is applied to consider machining characteristics in wire EDM.
1. Mechanical property test results shows good tensile strength of 1204.65 N/mm2, Impact strength 20 Joules,
hardness 56 HRC of material which hardened and tempered at 550 0C
2. Punch results and ANOVA analysis presents shows two set of optimal process parameters.
3. To manufacture punch wire cut EDM process was adopted.
90 |
P a g e
5. Interaction affects of intensity of pulse duration and pulse interval has the significant effect on Ra value.6. Lower Ra value has been achieved by optimizing the parameters significantly such as current, pulse
duration and pulse interval set at 3 amps, 60 micro seconds and 3 micro seconds.
7. The individual effect and interaction affects of process parameters on Ra value is better understand by plots.
8. For the research and theoretical work data base of results provides useful reference.
REFERENCES
[1] S.K. Saha, Lalta Prasad, Virendra Kumar/ International Journal of Engineering Research and
Applications (IJERA) ISSN: 2248-9622 www.ijera.com Vol. 2, Issue 2, Mar-Apr 2012, pp.510-519.
[2] S.Z. Qamar , A.K. Sheikh , A.F.M. Arif b, T. Pervez , R.A. Siddiqui , Journal of Heat treatment of a
hot-work die steel.
[3] Rajan, T.V. Sharma, C.P Sharma, ―Heat treatment – Principles and Techniques‖, Prentice- Hall of India
Private Limited, New Delhi, India, pp36-42, 1988.
[4] Jacob Klinginsmith, Russ Glass, and Naomi Sanders, Becky Moffitt, ‖The Science and Engineering of
Materials―(Fourth Edition): Donald R. Askland and Pradeep P. Phule: Brooks/Cole copyright 2003.
[5] Jamiu Kolawole odusote, Tajudeen Kolawole Ajuboye, Abdulkarim Baba Rabiu, Evaluation of
mechanical properties of medium carbon steel quenched in water and oil, AU J.T.15 (14), pp 218-224,
2010.
[6] Ahmet Kaynar, Suleyman Gunduz, Mustafa Turkmen, Investigation on the behavior of medium carbon
and vanadium micro alloyed steels by hot forging test, Materials and Design, Elsevier, 51 (2013), 819–
825.
[7] S.S.M. Tavares, P.D. Pedroza, J.R. Teodosia, T. Gurova, Mechanical properties of a quenched and
tempered dual phase steel, Scripta Mater. 40 (1999) 887-892.
[8] Božo Smoljan* - Dario Iljkić - Furio Traven University of Rijeka, Faculty of Engineering, Department of
Materials Science and Engineering, Croatia 56(2010)2, 115-120
[9] Smoljan, B., Butković, M. (1998) Simulation of mechanical properties of hardened steel. Proceedings of
MicroCAD ‘98, Miskolc.
[10] Smoljan, B. (2002) Numerical simulation of steel quenching. Journal of Materials Engineering and
Performance, vol. 11, no. 1, p. 75-80.
[10] Ren Jie, LIU YongHong, (2012)Compound machining of silicon carbide ceramic by high speed end
electrical discharge milling and mechanical grinding. Chinese science bulletin Mechanical Engineering,