Effect of temperature and magnetic fields on the structural state of the
Fe-Zr-B amorphous alloy below crystallization temperature
N.A. Minina1, O.K. Belousov1, V.A. Yermishkin1 and N.L. Fedotova2
1 Baikov Institute of Metallurgy and Materials Science, RAS, Leninskii pr. 49, Moscow, Russia
2 Bardin Central Scientific Research Institute of Ferrous Metallurgy, Vtoraya Baumanskaya ul. 6, Moscow, Russia
Abstract. Amorphous materials give the possibility to observe the phase and structural transformations in sufficiently narrow temperature intervals with the retention of their unchanged chemical composition. The present report is concerned with the results of the study of structure evolution and its dependence on magnetic field upon heating in the Fe-Zr-B amorphous alloy by the method of the photometric analysis of structural images (PHASI). The PHASI method makes it possible to establish the effect of external temperature and magnetic fields on the brightness spectra of the reflection from the surface of the object under study and the distribution of the zones, in which these changes are localized. The established temperature dependence of the energy characteristics of the reflection brightness spectrum in arbitrary units indicates the complex structural transformations caused by heating of the alloy under study. Also it is shown that the magnetic field produces residual structural changes in the alloy in comparison with its initial state.
1. Introduction
The interatomic forces, which provide the existence of substances in the condensed state in nature, can be considered as the manifestation of one of the fundamental physical interactions, namely, electromagnetic interaction. The visible light is also of electromagnetic nature, and its interaction with condensed media is of scientific interest. The study of such interaction makes it possible to obtain the fundamental information about the elementary processes occurring in the microcosm. In particular, such studies allow one to estimate the concentration of conduction electrons on the Fermi surface, to explain the specific features of the geometric shape of this surface, and to determine the electron collision frequencies [1]. The regularities of metal optics directly depend on the surface condition of metals and alloys, and this hampers the reliable experimental estimation of the reflection and absorption coefficients of the visible light falling to it. However, the examination of the specific features of the visible light reflection from surface of the material subjected to external physical or chemical actions allows one to explain their effect on the structural state of the material. It is known that the surface state of metals and alloys is noticeably changed under the action of mechanical loads, e.g., a polished surface becomes rough, and the surface micro roughness height increases. In this case, the surface
reflectivity substantially changes from the mirror reflection observed prior to the loading to the diffuse
reflection after it. Virtually any external action manifests itself on the surface and, if we introduce quantitative measure for the integral estimation of local variation in the surface state, then, with the known intensities and the durations of the external actions, we can obtain the calibration curve, which transforms the measurements of structural changes on the surface into the evaluated parameters of external actions. The study of the interaction of the emission from external source with the substance whose surface is under radiation can give information about the structural state of the substance, if the physical characteristics of the incident beam of light are known. This requires the beams of electromagnetic radiation with the known characteristics (energy, intensity, etc.). On the other side, if the structural characteristics of the target material are known, then the radiation characteristics (energy, spectral, etc.) can be obtained from the experiments on the interaction of emission with the substance. Both these possibilities are used in the contemporary physical methods. The application of visible light for the structural analysis of the surface condition of materials is not fraught with such consequences due to low energies of light photons. It should be noted that the optical light instruments in resolution rank substantially below electron microscopes and X-ray diffractometers.
EPJ Web of Conferences
This is evident from the known Rayleigh formula for the angular resolution (αmin) of collimated light source:
d
min
1
.
22
(1)where: is the wavelength of the emission used, and d is the diameter of the objective aperture. However, the sizes of the structure elements newly formed under the external energy effects substantially exceed the resolution of optical light instruments and, therefore, the results obtained with them frequently prove to be useful and important. Furthermore, our investigations showed that, for the correct comparison of the data on the physical characteristics of metals and alloys with the parameters of their structural state, it is necessary to determine them for the objects commensurate in sizes, i.e., the macroscopic physical characteristics should be put in correspondence with the structural state parameters averaged over the volume of the sample, in which the properties are determined. To correctly estimate the possibilities of the photometric analysis of structural images, one should consider the physics of the interaction of emission with the substance at the level of elementary events. Photons are the quanta of electromagnetic fields, and they have all properties typical of the objects of dual nature: particle and wave. As the pseudo-particles, the photons can interact with the valence electrons by the mechanism of direct collision with the conduction electrons of metals with the exchange of the energy pulses as well as this takes place in the Compton effect during scattering of X-radiation quanta on electrons [2]. The wave properties of photon can be described by the Poynting vector (S), which has meaning of the power radiated from a unit surface:
(2) where c is the constant such as the speed of light, ko =
9109 nm2/C2 is the constant having the sense of
dimension coefficient, E is the intensity of electric field of photon, and B is the intensity of the magnetic field of photon. The electromagnetic field of photon with its approach to metal or alloy forces free (valence) electrons to oscillate with the oscillation frequency of the intensity of its electric field, thus exciting the alternating surface current in the direction opposite to the E direction in the metal. The alternating surface current according to the Faraday law in turn creates a variable electromagnetic field, which in the case of metal with a good conductivity is virtually entirely reflected without any energy loss. In the conductors with lower conductivity, the energy of incident radiation will be partially absorbed as a result of the liberation of Joule heat and partially transferred by the wave reflected. Depending on the preparation of surface, the thickness of the surface layer, in which the surface current is localized, varies from 100 µm for mechanically polished surface to 150A for
electropolished surface. Despite the fact that only thin surface layer is examined in metal-optical studies, their results are important, since the phenomena of light reflection and absorption in them are analyzed at the level of photon-electron interaction. For metals, this interaction is realized for valence collective electrons, and just they play the leading role in the formation of the physical properties of condensed substances.
2. Experimental
p↑
I→ a and b
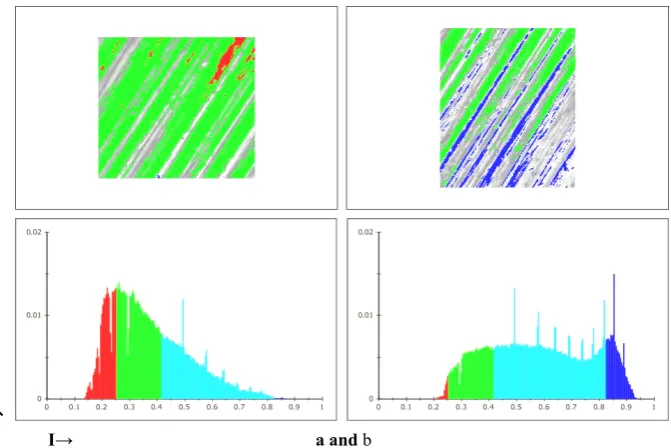
Fig. 1. Image of the surface fragment (x250) of the alloy under study (in this case fragment was 2.49·10-4 cm2, the total surface area of
sample under investigation was 3·10-2 cm2) and reflection brightness spectrum of visible light at temperatures of (a) 294 K and (b) 378
K from the same fragment.
3. Results and discussion
For the analysis of the surface images of nanostructural alloy, the image obtained prior to heating was used as the reference spectrum for the comparison with the reflection brightness spectra obtained at elevated temperatures. Figure 1 shows the typical representation form for the results treated in PHASI. The physical fundamentals of the PHASI method are described in [3-5]. Here we consider only the procedural aspect of its application. The brightness spectra of visible light reflection from the negative image obtained from the sample surface in the high-temperature metallographic microscope are constructed in the coordinates representing the spectral density of the reflection brightness along the Y-axis vs. the corresponding reflection brightness intensity along the X-axis. Two images of the same fragment are compared before and after the external energy action of known nature or this fragment is compared with a reference image, which can be the reflection of the illumination source spectrum in a mirror. The reflection brightness intensity in arbitrary units is depicted in the X-axis. The spectral density of a given brightness is understood as the relation of the number of the image pixels with the same nuance of black and white on the negative image of the object surface to the total number of fragments, into which the image is divided. On the scale of intensities, we select individual brightness ranges (up to 5) by coloring. The interval size is selected upon the PHASI tuning. In the present work, we selected 3 intervals: (I) in the spectrum region with prevailing low-energy emission; (II) in the spectrum zone surrounding the maximum of the spectral density; (III) in the region corresponding to the high-energy emission of visible light. It is seen from Figure 1 that the character of the
100K. The distribution of the spectral densities corresponding to different intensities became more uniform. The maximum of the spectrum was displaced to higher brightness. The spectral density in the interval corresponding to the lower-energy part of the visible spectrum was noticeably reduced. Under identical conditions, the images obtained from the sample fragment in a temperature range of 378-873 K were compared with its initial image obtained at T = 294 K. Figure 2 shows the temperature dependences of the average spectral density of the emission brightness in the highest-energy and lowest-energy parts of the spectrum. Both dependences have nonmonotonic character with distinct maxima and minima, which reflect the specific features of structural transformations of the alloy upon the assigned heating regime.
‐0.20 0.00 0.20 0.40 0.60 0.80 1.00
200 300 400 500 600 700 800 900 1000
p(s)
T, K
Fig. 2. Temperature dependences of average spectral density in the low-energy (___) and high-energy intervals of the
reflection brightness spectrum (---).
If we integrate the area under the curve of spectral brightness distribution, then we will obtain the radiation spectrum energy (Ep) in conventional units. The
EPJ Web of Conferences
dependences of Ep and Er. The character of the
dependences given in Fig. 3 shows that the specific features of the emission of the reflection brightness spectrum are tightly connected with the structure transformations, which are developed in the all upon heating. In a temperature range of 378-473 K, the thermal energy supplied to the material is consumed mainly for the acceleration of the diffusion processes, which provide the relaxation structural transformations in it.
Fig. 3. Temperature dependences of total radiation energy Ep
(□) and increase in the radiation energy of the sample fragment upon heating, E r (◊).
In a temperature range of 473-673 K, the structure of material is in a comparatively stable state. At temperatures above 693 K, the stability of structural state is sharply disrupted, and a large part of the input energy is consumed for the transition of the material into a new metastable state. According to the theory of the electromagnetism, the attracting force of electromagnet F is expressed by the formula:
F = (3) where B is the induction of magnetic field inside the magnet core, S is the joining area between core and solenoid, and µo is a magnetic constant of 4·10-7 H/m.
At the known electromagnet construction, the magnetic induction can be determined from formula (3), using the experimentally measured attracting force. Then we can estimate the magnetic field energy of the electromagnet from the formula:
(4)
As was noted above, two series of experiments were performed for the calibration of the electromagnet for obtaining the calibration curve F = f(I). Figure 4 shows the calibration curve with the depicted results of both
series of the experiments, which principally differ from each other. Both procedures, which principally differ in the scheme of experiment, showed sufficiently close results. This allowed us to obtain the united calibration curve, which transforms the current of the solenoid into the attracting force of the electromagnet. Using this curve, we obtained dependence (5) from formulas (3) and (4) for the calculation of the magnetic energy affecting the samples from the measured attracting force
= (5)
0 1 2 3 4 5 6
0 0.1 0.2 0.3 0.4 0.5
P,
N
I, A
Fig. 4. Calibration curve F = f (I) built by two independent
experiment procedures using (◊) the detachment of load from the electromagnet; (□) the bend of the beam, where F is the
load weight, and I is the amperage in the solenoid.
0 0.01 0.02 0.03 0.04 0.05 0.06 0.07 0.08
0 0.005 0.01 0.015
E,
c.u.
E, J
Fig. 5. Dependence of the total energy radiated by the alloy on the energy of external magnetic field (◊) under the field action
p↑
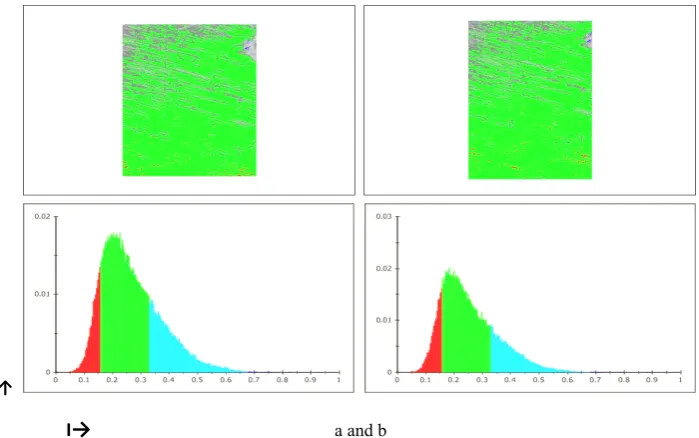
I→ a and b
Fig. 6. Images of the alloy fragment (x250) and the brightness spectra of the visible light reflection from it (a) prior to the switching on of the external magnetic field and (b) after the switching on of the field of 0,256 T in induction.
In the experiment performed by the PHASI method, we studied the structure of the sample surface and the brightness spectra of the reflection from it. Figure 5 shows the dependence of the total energy radiated by the material from the magnetic energy Ep = f(Em) acting
on it and the energy radiated by the material processed by magnetic field after the termination of its action. It is evident from Figure 5 that the energy of the applied external magnetic field substantially changes the energy of the emission brightness spectrum. This dependence has a distinct maximum in the area of the acting magnetic field of 0.262 T in induction. A noticeable
aftereffect of the magnetic field affects the reflection brightness spectrum of the material after the field switching-off. For explaining the physical nature of the specific dependences (Figure 5.) established by the PHASI method, the "in situ" electron-microscopic examinations are required. Figure 6 shows the surface structure changes of the alloy under the maximum effect of magnetic field on the emission brightness spectrum. The observed changes of the surface reflectivity have a good correlation with bulk structural transitions introduced by temperature, magnetic field on the alloys, but for investigated alloy there are no bulk samples.
4. Conclusions
1. The PHASI method makes it possible to establish the effect of external temperature and magnetic fields on the brightness spectra of the reflection from the surface of the object under study and the distribution of the zones, in which these changes are localized. The method allows one to quantitatively measure the spectrum parameters, which characterize these changes.
2. The established temperature dependence of the energy characteristics of the reflection brightness spectrum in arbitrary units indicates the complex structural transformations caused by heating of the alloy under study.
3. The energy characteristics of the reflection brightness spectrum of the alloy are studied as a function of the energy of external magnetic field. The established dependence is characterized by the maximum at a magnetic induction of 0.262 T. It is shown that the magnetic field produces residual structural changes in the alloy in comparison with its initial state.
The work is supported by RFBR (RU)
09-08-References
1. Stroganov V.I. Nonlinear metal opticis. Novosibirsk: Nauka. 1972. P. 95. Beiser A., Perspectives of modern physics. US, McGraw-Hill Inc., International Ed. P. 624 (1969) 2. Orear J. Physics. Russian translation, Moscow:
Mir. 1 and 2. P. 622 (1979)
3. Yermishkin V.A., Lepeshkin Yu.D., Murat D.P., Ovchinnikov I.N. Method of photometric diagnostics of the structural state of materials according to the data of the analysis of the digital coded image of their surface. Patent No.2387974, Byull. Izobr. No. 13, P. 14. (2010)
4. Yermishkin V.A., Murat D.P., Podbelskiy V.V. Information technology of the photometric analysis of the fatigue damageability of materials. Informatsionnye Tekhnologii. No. 11, P. 65-70 (2007)