Scholarship@Western
Scholarship@Western
Electronic Thesis and Dissertation Repository
3-25-2011 12:00 AM
Finding Faulty Functions From the Traces of Field Failures
Finding Faulty Functions From the Traces of Field Failures
Syed Shariyar Murtaza
The University of Western Ontario Supervisor
Dr. Nazim H. Madhavji
The University of Western Ontario Joint Supervisor Dr. Mechelle S. Gittens
The University of Western Ontario Graduate Program in Computer Science
A thesis submitted in partial fulfillment of the requirements for the degree in Doctor of Philosophy
© Syed Shariyar Murtaza 2011
Follow this and additional works at: https://ir.lib.uwo.ca/etd Part of the Software Engineering Commons
Recommended Citation Recommended Citation
Murtaza, Syed Shariyar, "Finding Faulty Functions From the Traces of Field Failures" (2011). Electronic Thesis and Dissertation Repository. 106.
https://ir.lib.uwo.ca/etd/106
This Dissertation/Thesis is brought to you for free and open access by Scholarship@Western. It has been accepted for inclusion in Electronic Thesis and Dissertation Repository by an authorized administrator of
FINDING FAULTY FUNCTIONS FROM THE TRACES OF FIELD FAILURES
(Spine title: Finding Faulty Functions from the Function-call Level Traces)
(Thesis format: Integrated Article)
by
Syed Shariyar Murtaza
Graduate Program in Computer Science
A thesis submitted in partial fulfillment of the requirements for the degree of
Doctor of Philosophy
The School of Graduate and Postdoctoral Studies The University of Western Ontario
London, Ontario, Canada
ii
THE UNIVERSITY OF WESTERN ONTARIO School of Graduate and Postdoctoral Studies
CERTIFICATE OF EXAMINATION
Supervisor
______________________________ Dr. Nazim H. Madhavji
Co-supervisor
______________________________ Dr. Mechelle S. Gittens
Examiners
______________________________ Dr. Michael W. Godfrey
______________________________ Dr. Luiz Capretz
______________________________ Dr. Charles X. Ling
______________________________ Dr. James H. Andrews
The thesis by
Syed Shariyar Murtaza
entitled:
Finding Faulty Functions from the Traces of Field Failures
is accepted in partial fulfillment of the requirements for the degree of
Doctor of Philosophy
iii
Abstract
Corrective maintenance, which rectifies field faults, consumes 30-60% time of software maintenance. Literature indicates that 50% to 90% of the field failures are rediscoveries of previous faults, and that 20% of the code is responsible for 80% of the faults. Despite this, identification of the location of the field failures in system code remains challenging and consumes substantial (30-40%) time of corrective maintenance. Prior fault discovery techniques for field traces require many pass-fail traces, discover only crashing failures, or identify faulty coarse grain code such as files as the source of faults. This thesis (which is in the integrated article format) first describes a novel technique (F007) that focuses on identifying finer grain faulty code (faulty functions) from only the failing traces of deployed software. F007 works by training the decision trees on the function-call level failed traces of previous faults of a program. When a new failed trace arrives, F007 then predicts a ranked list of faulty functions based on the probability of fault proneness obtained via the decision trees. Second, this thesis describes a novel strategy, F007-plus, that trains F007 on the failed traces of mutants (artificial faults) and previous faults. F007-plus facilitates F007 in discovering new faulty functions that could not be discovered because they were not faulty in the traces of previously known actual faults. F007 (including F007-plus) was evaluated on the Siemens suite, Space program, four UNIX utilities, and a large commercial application of size approximately 20 millions LOC. F007 (including the use of F007-plus) was able to identify faulty functions in approximately 90% of the failed traces by reviewing approximately less than 10% of the code (i.e., by reviewing only the first few functions in the ranked list). These results, in fact, lead to an emerging theory that a faulty function can be identified by using prior traces of at least one fault in that function. Thus, F007 and F007-plus can correctly identify faulty functions in the failed traces of the majority (80%-90%) of the field failures by using the knowledge of faults in a small percentage (20%) of functions.
Keywords
iv
Co-Authorship Statement
This thesis is written in an integrate-article format. There were several co-authors of the papers (published or submitted) related to this thesis. The author of this dissertation is the primary author of all the publications arising out of this dissertation. Dr. Nazim H. Madhavji is a co-author of all the publications in the capacity of a supervisor of the research conducted. Similarly, Dr. Mechelle Gittens is also a co-author of all the publications in the capacity of a co-supervisor. From the inception of the idea of the F007 technique, their role has been active in carving out the technique for the impact on the body of knowledge. Zude Li is also a co-author of some of the papers in the capacity of his help in building a mathematical model for the pattern mining technique used in the paper, and providing feedback in editing and writing of papers.
v
Acknowledgments
Above all, I thank Almighty God for strength and perseverance in times of weariness. I continue to progress because You have set great things for me.
I would like to thank my father, mother, brothers and their families who have patiently waited for me, motivated me, and above all strengthened me with their love and unrelenting support during the fulfillment of my goals.
Most importantly, sincere thanks and gratitude to my supervisor Dr. Nazim H. Madhavji and co-supervisor Dr. Mechelle Gittens. Without your support, guidance and tireless effort this thesis would not have been possible. I am truly indebted to your invaluable supervision and priceless advices that helped me to cultivate the skills to succeed in this endeavor and those advices will continue to influence me throughout my career.
I would like to acknowledge the support of all current and former colleagues in my lab, staff members (especially Graduate Secretary Janice Weirsma) and professors at Western, and other colleagues who have been instrumental in developing a congenial and conducive research environment. In particular, I am grateful to Zude Li for his suggestions on my thesis, Andriy Miranskyy of IBM for his help in data collection, Mark Wilding of IBM for providing me with resources needed to conduct an industrial-scale study at IBM, and Dr. Jamie Andrews for providing the mutation tool for this research.
I am also thankful to the University of Western Ontario for giving me the opportunity to conduct doctoral studies with full financial support during the last four years. I would also like to thank Ontario Graduate Scholarship for funding me during the course of this research and NSERC Canada for providing the funding necessary to collaborate with industry. I would also like to acknowledge IBM, Canada, for providing the resources needed for this research.
vi
Table of Contents
CERTIFICATE OF EXAMINATION ... ii
Abstract ... iii
Co-Authorship Statement... iv
Acknowledgments ...v
Table of Contents ... vi
List of Tables... xi
List of Figures ... xiii
Chapter 1 ...1
1 Introduction ...1
1.1 Research Problem ...2
1.2 Research Contribution ...2
1.3 Thesis Structure ...5
1.4 References ...7
Chapter 2 ... 10
2 F007: Finding Faulty Functions from the Function-call level Traces of the Field Failures ... 10
2.1 Introduction ... 10
2.2 Related Work ... 15
2.2.1 In-house Fault Localization Techniques ... 16
2.2.2 Statistically Identifying Field Failures ... 17
2.2.3 Classifying “Pass-fail” Field Traces ... 18
2.2.4 Rediscovery of Problems ... 19
2.2.5 Localizing System Level Faults ... 19
vii
2.3 The F007 Technique ... 21
2.3.1 MINEPI ... 23
2.3.2 Decision Tree Algorithm ... 29
2.4 Experimental Setup ... 32
2.4.1 The Data Set ... 32
2.4.2 The Empirical Process ... 35
2.5 Executing F007 ... 37
2.6 Results ... 41
2.6.1 Episode Rules ... 41
2.6.2 Identifying Faulty Functions in Failed Traces using Minimal-earlier Failed Traces ... 46
2.6.3 Rules of Decision Tree in Understanding Fault Proneness of Faulty Functions ... 57
2.6.4 Entry Exit Events in Traces ... 58
2.7 Case Study on a Large Commercial Application ... 61
2.7.1 Data Collection ... 62
2.7.2 Executing F007 using different heuristics ... 63
2.7.3 Evaluating Heuristic ‘a’ ... 64
2.7.4 Evaluating the Heuristic ‘b’ ... 66
2.7.5 Evaluating the Heuristic ‘c’ ... 66
2.7.6 Identifying the Faulty Functions and Components across Releases ... 68
2.8 Executing F007 across Releases: Revisiting Example Execution ... 73
2.9 Summary of the Results ... 74
2.10Comparison with Contemporary Techniques ... 76
2.11Threats to Validity ... 81
viii
2.11.2 Internal Validity ... 82
2.11.3 Construct Validity ... 82
2.11.4 External Validity ... 84
2.12Conclusions and Future Work ... 85
2.13References ... 87
Chapter 3 ... 91
3 Using Mutants to Discover New and Rediscovered Field Faults by Exploiting the Similarity of Traces among Different Faulty Functions ... 91
3.1 Introduction ... 91
3.2 Related Work ... 96
3.2.1 Fault Discovery Techniques for Inhouse Faults... 96
3.2.2 Fault Discovery Techniques for Field Failures ... 97
3.2.3 Fault Discovery Using Mutation ... 98
3.2.4 Research Gap ... 99
3.3 F007-basic and F007-plus Overview ... 100
3.3.1 F007-basic ... 100
3.3.2 F007-plus ... 101
3.4 Fundamentals ... 102
3.4.1 Subject Programs ... 102
3.4.2 Mutation ... 105
3.4.3 Decision Tree ... 108
3.5 The F007-plus Strategy ... 113
3.5.1 Step 1: Measuring the code metrics of functions ... 114
3.5.2 Step 2: Using the decision tree on the code metrics ... 116
3.5.3 Step 3: Generating mutants of the suspected functions ... 119
ix
3.5.5 Executing F007-plus ... 119
3.6 Implementation, Scalability and Runtime Performance of F007-plus ... 123
3.6.1 Implementation Details ... 123
3.6.2 Scalability ... 124
3.6.3 Execution Time ... 125
3.7 Case Studies to Investigate Research Questions: (Q1) Similarity of Traces among Faulty Functions and (Q2) Discovering Actual Faults using Mutant Faults ... 126
3.7.1 Making every function faulty using mutants to identify faulty functions in actual traces... 126
3.7.2 Making only the selected functions faulty using mutants to identify faulty functions in the traces of actual faults ... 133
3.7.3 Summary of the Key findings ... 137
3.8 Evaluating F007-plus ... 138
3.8.1 Using F007-plus to Identify Faulty Functions in the UNIX utilities ... 138
3.8.2 Measuring statements-effort in identification of faulty functions ... 142
3.8.3 Identifying Multiple Faulty Functions ... 145
3.8.4 Rules of Decision Tree in Understanding Fault Proneness of Faulty Functions ... 149
3.9 Summary of the Findings ... 150
3.10Comparison Against Other Techniques ... 151
3.11Threats to Validity ... 155
3.11.1 Conclusion Validity ... 155
3.11.2 Internal Validity ... 156
3.11.3 Construct Validity ... 156
3.11.4 External Validity ... 157
x
3.13References ... 160
Chapter 4 ... 164
4 Emerging Theory ... 164
4.1 Introduction ... 164
4.2 An Emerging Theory ... 164
4.2.1 Explanation of propositions (P11 and P12) from the study [S1] ... 166
4.2.2 Explanation of propositions (P13, P14 and P15) from the study [S2] ... 168
4.2.3 Explanation of proposition P21 ... 169
4.3 Emerging Theory Statement ... 169
4.4 Evaluating Emerging Theory... 169
4.5 Implications ... 174
4.6 Conclusion ... 175
4.7 References ... 175
Chapter 5 ... 177
5 Conclusions and Future Work ... 177
5.1 Conclusions ... 177
5.2 Future Work ... 179
5.3 References ... 180
Appendix ... 182
Glossary of Terms ... 189
xi
List of Tables
Table 1: Thesis core. ...6
Table 2. Characterization of F007 and closely related techniques. ... 20
Table 3: Epsiode rules from a parallel episode of length 3... 28
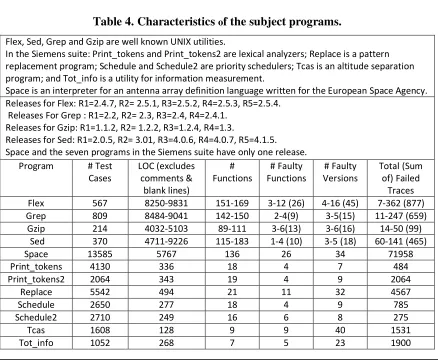
Table 4. Characteristics of the subject programs. ... 33
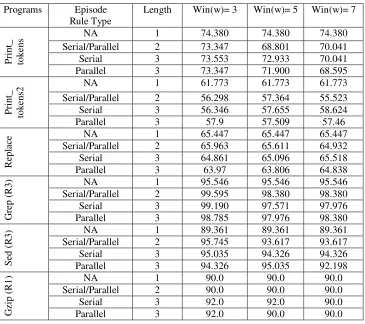
Table 5: Faulty functions prediction accuracy (in percentage) for failed traces of the programs using window widths 3, 5 and 7. ... 42
Table 6: Execution statistics of the best episodes. ... 45
Table 7: Classification accuracy for “function entry and exit” and “function entry or exit” (in percentage) using F007. ... 59
Table 8: Characteristics of the commercial application under study. ... 62
Table 9: Identifying the faulty functions in the failed traces of a large software system by reviewing less than 1 % of the code (functions). ... 65
Table 10: Comparison of related techniques focusing on function-call pattern analysis. . 79
Table 11: Characteristics of the subject programs. ... 103
Table 12: Misclassification cost ratio “Cf : Cnf ” for the following releases of the UNIX utilities using training-set of previous releases. ... 120
Table 13: Mutation time for the subject programs. ... 125
Table 14: Processing time for traces... 126
Table 15: List of multiple faulty functions in release 3 of the Flex and the Grep program. ... 146
xii
Table 17: Accuracy of F007 using the patterns of function-calls (the MINEPI algorithm) and using only single function-calls. ... 182
Table 18: Accuracy of identifying faulty functions using the episodes of length 1 with frequency and confidence. ... 185
xiii
List of Figures
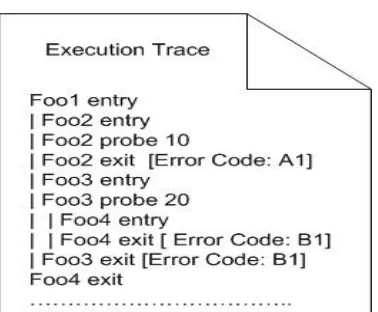
Figure 1: A function-call level execution trace. ...3
Figure 2: An example of common patterns in failed function-call level executions of the Space program. ... 11
Figure 3: Event (function) sequences and episodes. ... 24
Figure 4: Length 3 serial episode rules and a trace with confidence and pre-known faulty functions from history... 30
Figure 5: Length 2 episode rules, faulty functions and traces of 23 versions of “Tot_info” from the Siemens suite. ... 38
Figure 6: The C4.5 decision tree model for the faulty function “gser” of “Tot_info”. ... 39
Figure 7: Faulty function ranking for trace “T1013” of version 1 of program “Tot_info”. ... 40
Figure 8: Accuracy of F007 on: all the releases of Flex, Grep, Gzip and Sed programs; the seven programs of the Siemens suite; and the Space program. ... 49
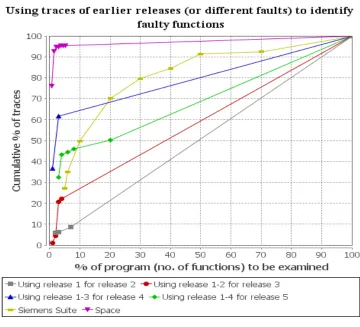
Figure 9: Using traces of earlier releases or different faults for training F007 and testing F007 on successive releases. ... 51
Figure 10: Using traces of earlier releases and 10% traces of the following releases to train F007 and identify faulty functions in the rest of the traces of the following release. ... 53
Figure 11: Statements-effort using F007 in identifying faulty functions. ... 55
xiv
Figure 13: Functions vs. size graph of randomly selected releases of the UNIX utilities (X-axis shows labeled by numbers instead of names and Y-axis shows the size of each
function). ... 57
Figure 14: Decision tree models for faulty functions of Flex and grep program. ... 58
Figure 15: Example execution trace of the large commercial software (with names obfuscated for privacy reasons). ... 64
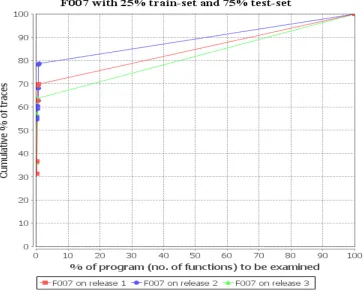
Figure 16: F007 on three releases of a large commercial application. ... 69
Figure 17: Identifying the faulty functions across releases. ... 70
Figure 18: Identifying faulty functions across releases. ... 71
Figure 19: Identifying faulty components across releases (a total of 300 components make 100% program in this figure). ... 72
Figure 20: Comparing Frequent Pattern Mining (FP) using function sequences and Tarantula on function coverage against F007. ... 77
Figure 21: Comparing Effective Fault Localization and Tarantula on statement coverage against the statement-effort of F007. ... 78
Figure 22: Best and worst case accuracies using F007 for the UNIX utilities. ... 83
Figure 23: Failed function-call level execution traces for faults in function “sgrrot”, “GetReal” and “mksnode” of the Space program. ... 92
Figure 24: A scenario of fault discovery in failed traces of deployed software. ... 101
Figure 25: Correct source code of the function “Get1Real” of the Space program, its real faulty version and its faults generated using mutants. ... 106
xv
Figure 27: The C4.5 decision tree model for the function “Get1Real” of the Space
program from failed traces of mutants by using one-against-all approach. ... 111
Figure 28: Ranking of suspected faulty functions in real failed traces obtained from the decision tree model of failed traces of mutants. ... 113
Figure 29: Average misclassification cost for the UNIX utilities. ... 122
Figure 30: Faulty function prediction accuracy for the Space program on its failed traces of actual faults using the failed traces of mutants of all functions. ... 128
Figure 31: Accuracy of identification of faulty functions in the actual traces using mutant traces on the UNIX utilities. ... 131
Figure 32: Faulty function prediction accuracy by using failed traces of the same faulty functions on the Space program. ... 134
Figure 33: Faulty function prediction accuracy by using failed traces of the same faulty functions on the UNIX utilities. ... 135
Figure 34: Faulty function prediction accuracy on the actual failed traces of the following release using the failed traces of selected mutants and the actual failed traces of the preceding release. ... 139
Figure 35: Faulty function prediction accuracy on the actual failed traces of the current release using the failed traces of selected mutants, actual failed traces of the preceding release, and the 10% traces of the current release. ... 141
Figure 36: Faulty function prediction accuracy in terms of statements-effort on the actual failed traces of the current release using the failed traces of selected mutants and actual failed traces of the preceding release. ... 143
xvi
Figure 38: Identifying multiple faulty functions in the Flex and Grep program using mutant traces and actual traces. ... 147
Figure 39: Decision tree models for faulty functions of Flex and grep program. ... 149
Figure 40: F007-basic on the UNIX utilities. ... 152
Figure 41: F007-plus on the UNIX utilities and straw-man approach for prediction of faulty functions. ... 153
Chapter 1
1
Introduction
According to an industrial poll (Erlikh, 2000), 85-90% of software systems’ budget goes to software maintenance. Considering the high cost of software maintenance several researchers measure the cost associated with different categories of software maintenance. Schach et al. (2003) measures change logs and code modules of three software products (a commercial real-time product, a Linux kernel, and the GCC compiler) and finds that 53.4% to 56.7% of maintenance time is spent in corrective maintenance, 36.4-39% of time in perfective maintenance and 2.2-4% in adaptive maintenance. Lee & Jefferson (2005)also measures a Web-based Java (TM) application which reveals that 32% of maintenance time is spent in corrective maintenance along with 62% in perfective maintenance and 6% in adaptive maintenance.
The time spent in adaptive maintenance is small, and the time spent in perfective maintenance is difficult to avoid because it deals with the addition of new features or functionality. The time spent in corrective maintenance, however, is alarming because it deals with faults in a software system. Faults in a software system negatively affect software quality, customers’ businesses and the market reputation of an organization. Thus corrective maintenance requires greater attention of the software engineering researchers.
functions) can be easily or automatically identified, then this will significantly reduce the corrective maintenance effort, cost and time.
1.1 Research Problem
This thesis, therefore, addresses the problem of identifying faulty functions in the execution traces1 of crashing and non-crashing failures of deployed software.
Previous techniques focusing on the field failures: (i) require many passing and failing traces to identify the fault origin (e.g., using statistical debugging to identify important locations in the proximity of faulty source code (Chilimbi et al., 2009; Liu and Han, 2006)); (ii) discover only crashing failures by matching symptom of a problem with previously known faulty symptoms (Brodie et al., 2005; Lee and Iyer, 2000); (iii) identify faulty coarse grain code from execution traces such as files as the source of the field failure (Podgurski et al., 2003); and (iv) classify a field trace as passing trace or failing trace (Haran et al., 2007). Note that a non-crashing failure is more difficult to diagnose than a crashing failure because a non-crashing failure could manifest itself well after the executions of faulty code. However, the origin of the crashing failure can be readily identified by the same sequence of last function-calls after a crash.
1.2 Research Contribution
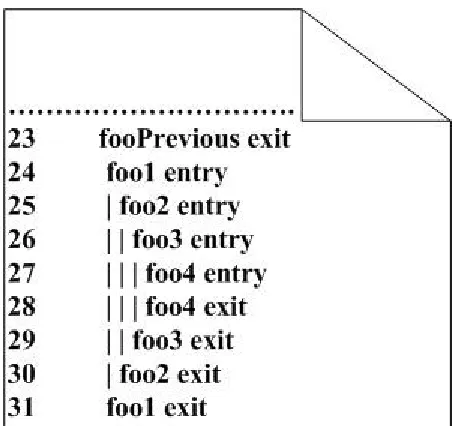
We solved the research problem, described in previous section, by developing an automated solution that identifies faulty functions in a (function-call level) failed trace of a deployed software system by using previously resolved (function-call level) failed traces of that program. Figure 1 shows a function-call level trace where “function entry” shows when control enters a function and “function exit” shows when it leaves a function. The proposed solution fills the gap of finer-grained discovery of fault origin (faulty function) from only a failed field trace of crashing and non-crashing failures.
1
Figure 1: A function-call level execution trace.
The contributions of this thesis are:
(a) A technique F007 that identifies the list of suspected faulty functions in a trace of field failure by training the decision tree on previous failed traces of past releases and current release of a program (see Section 2.3). F007 can discover new and rediscovered faults in a function if traces of at least one (same or different) fault in that function are present in a previous collection of failed traces (see Section 2.6.2 and Section 2.7.6).
(b) A novel strategy called F007-plus that trains F007 on the failed traces of mutants2 (artificial faults) and previous actual faults. F007-plus facilitates F007 to discover new faulty functions that were not discovered by F007 – F007 was able to discover only those faulty functions that were found previously faulty due to actual faults (see Chapter 3 and Section 3.5).
2
(c) Identification of faulty functions in a trace of a current release by using the traces of prior faults in that function with the help of F007 and F007-plus. Traces of prior faults are obtained from pevious releases, mutants (artificial faults), or the current release (see Section 2.6.2 and Section 2.7; and Section 3.8).
(d) Faulty functions in approximately a maximum of 90% failed traces of subject programs can be identified on reviewing 10% or less of the code by using F007 and F007-plus (different settings result in different results; see, for example: Section 2.6.2 and Section 2.7; and Section 3.8).
(e) A discovery that only “function entry” or “function exits” in a function-call level trace (see Figure 1) are adequate to discover a fault’s origin and their combine use does not affect the accuracy of identifying the fault’s origin. This discovery reduces the size and run time overhead of the function-call level trace to approximately half (see Section 2.6.4).
(f) Patterns (or combinations) of function-calls (e.g., three functions that always appear together in a trace) do not produce better results than single function-calls when used with the decision tree algorithm (see Section 2.6.1).
(g) Faults generated using mutants (artificial faults) can be used to discover real faults (see Section 3.7 and Section 3.8).
(h) Traces (function-calls) of different faults in a group of related functions are similar; and traces of faults in one group of functions are different from traces of faults in another group of functions (see Section 3.7).
(i) An emerging theory: “A faulty function can be so identified if the traces of at least one fault in that function are already known; and the accuracy of
identification increases with the decreasing proportion of faulty functions in the
this dissertation. The details of these two studies are described in the next section (see Chapter 4).
These research contributions are significant for deployed systems when only a few traces are available which is mostly the case because: (a) collection of multiple passing and failing traces for deployed systems can impede business operations by incurring extra overhead on them; and (b) collection of many traces consumes customers’ resources and time. F007 (including F007-plus) addresses this need by using only the “failed” and reduced (i.e., “function entry” OR “function exit”) function-call level traces. F007 is also very useful in the field testing such as alpha testing and beta testing. F007 is significant for the corrective maintenance from the point of view of reducing effort in locating the finer-grained fault origin (faulty functions) in the traces of the field failures.
1.3 Thesis Structure
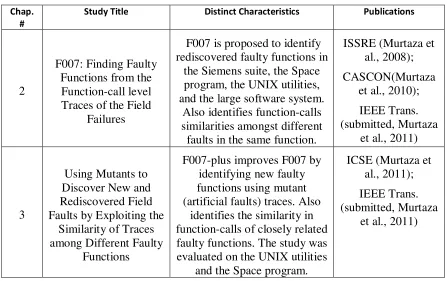
The contributions of this thesis span the two studies of this dissertation. These two studies form the core of this thesis and are characterized in Table 1 with the following information: chapter number where the study is described in this thesis, study title, distinct characteristics of one study from another study, and publications year with the publications venues. Table 1 briefly provides the description of these studies by highlighting their differences.
The first study (in Chapter 2) proposes F007 and shows that: (a) patterns of function-calls are not better than single function-calls in discovering the fault origin; (b) only “function entry” or “function exit” are sufficient to discover the fault origin; and (c) different faults in the same function have similar function-calls. The second study, in Chapter 3, proposes F007-plus and shows that: (a) different faults in closely related functions occur with similar function-calls; and (b) mutants can be used to discover actual faults. Thus, it can be observed from Table 1 that these two studies are incrementally built over each other with the general focus on identifying faulty functions in the field traces.
program (Do et al., 2005); (c) Flex, Grep, Gzip and Sed--the four open source UNIX utilities--and their four to five releases (Do et al., 2009); and (d) a very large scale commercial program deployed in the field for about 20 or more years, with 20 million LOC and 200,000 functions. We evaluated F007 and improved strategy F007-plus by using a metric, also used by other researchers working on fault localization such as Jones and Harrold (2005) and Chilimbi et al. (2009), that quantifies a developer’s effort in discovering fault locations. This effort measurement metric measures the number of functions or statements reviewed in discovering faulty functions or component. For example, F007 can identify faulty functions in 70-90% of the field failures on reviewing 10% or less of the program (i.e., 2-3 functions; see Section 2.6.2).
Table 1: Thesis core.
Chap. #
Study Title Distinct Characteristics Publications
2
F007: Finding Faulty Functions from the Function-call level Traces of the Field
Failures
F007 is proposed to identify rediscovered faulty functions in
the Siemens suite, the Space program, the UNIX utilities, and the large software system.
Also identifies function-calls similarities amongst different faults in the same function.
ISSRE (Murtaza et al., 2008); CASCON(Murtaza
et al., 2010); IEEE Trans. (submitted, Murtaza
et al., 2011)
3
Using Mutants to Discover New and Rediscovered Field Faults by Exploiting the
Similarity of Traces among Different Faulty
Functions
F007-plus improves F007 by identifying new faulty functions using mutant (artificial faults) traces. Also
identifies the similarity in function-calls of closely related faulty functions. The study was evaluated on the UNIX utilities
and the Space program.
ICSE (Murtaza et al., 2011); IEEE Trans. (submitted, Murtaza
et al., 2011)
This thesis is actually documented in the “integrated-article” format. Official guidelines pertaining to the “integrated-article” format can be found on the website of the University of Western Ontario3. In the “integrated-article” format, each chapter is a separate study
3
and contains its own introduction, related work, procedure, evaluation and bibliography. However, the studies should not be disparate and the dissertation should show the logical relation amongst them. In our case, the research problem is the same but solutions are different: the second solution incrementally extends and overcomes the limitation of the first solution. In our case, the related work also overlaps in the two studies because of the same research problem. Thus, this thesis is structured as follows: Chapter 2 and Chapter 3 articulate two studies as shown in Table 1; Chapter 4 derives and validates an emerging theory based on the findings of the two studies; and Chapter 5 concludes this thesis with the directions to future work.
1.4 References
Boehm, B. & Basili V., R. "Software Defect Reduction Top 10 List", Computer, Vol. 34, No. 1, IEEE CS Press, Jan. 2001, pp. 135-137.
Brodie, M.; Sheng Ma; Lohman, G.; Mignet, L.; Modani, N.; Wilding, M.; Champlin, J.; and Sohn, P. “Quickly Finding Known Software Problems via Automated
Symptom Matching.” Proc. 2nd Int’l Conf. on Autonomic Computing, Seattle, USA, June 2005, pp. 101-110.
Chilimbi, T. M.; Liblit, B.; Mehra, K.; Nori, A. V.; and Vaswani, K; “HOLMES:
Effective Statistical Debugging via Efficient Path Profiling”. Proc. 31st Intl. Conf. on Softw. Eng., IEEE CS, Canada, May, 2009, pp. 34-44.
Do, H., Elbaum, S. G.; and Rothermel, G. “Supporting Controlled Experimentation with Testing Techniques: An Infrastructure and its Potential Impact." Empirical Softw. Eng., Vol. 10, Springer, Oct. 2005, pp. 405-435.
Erlikh, L."Leveraging Legacy System Dollars For E-Business," IT Professional, Vol.2, No.3, May-Jun, 2000, pp.17-23.
Gittens M.; Kim Y.; and Godwin D. “The Vital Few Versus the Trivial Many: Examining the Pareto Principle for Software.”Proc. 29th Int'l Computer Softw. and Appl. Conf., Edinburgh, Scotland, July 2005, pp. 179-185.
Haran, M.; Karr, A.; Last, M.; Orso, A.; Porter, A.A.; Sanil, A.; Fouche, S. “Techniques for Classifying Executions of Deployed Software to Support Software
Engineering Tasks.” IEEE Trans. on Softw. Eng. Vol. 33, No.5, May, 2007, pp. 287-304.
IEEE Std. 610.12, Standard Glossary of Software Engineering Terminology, IEEE Computer Society Press, Los Alamitos, CA, 1990.
Lee M. G. and Jefferson T. L. “An Empirical Study of Software Maintenance of a Web-based Java Application.” Proc. Int’l Conf. on Soft. Maintenance, IEEE, Budapest, Hungary, Sep., 2005, pp. 571-576.
Lee, I. and Iyer, R. “Diagnosing Rediscovered Problems Using Symptoms.” IEEE Trans. on Sofw. Eng., Vol. 26, No. 2, Feb, 2000, pp.113-127.
Liu, C. and Han, J. “Failure Proximity: A Fault Localization-based Approach.” Proc. of the 14th SIGSOFT Symp. on Foundations of Softw. Engg., ACM, Portland, USA, Nov. 2006, pp. 45-56.
Murtaza, S.,S.; Gittens, M.; Li, Z.; Madhavji, N.,H.; “F007: Finding Rediscovered Faults from the Field using Function-level Failed Traces of Software in the Field”. Proc. Conf. of the Center for Advanced Studies on Collaborative Research: Meeting of Minds, ACM, Canada, Nov. 2010, pp. 61-75.
Murtaza, S.S.; Gittens, M.; and Madhavji, N.H. “Discovering the Fault Origin from Field Traces”, Proc. of 19th International Symposium on Software Reliability Engineering, IEEE CS, Seattle, USA, Nov. 2008, pp. 295-296.
Murtaza, S.S.; Madhavji, N.H.; Gittens, M.; Li, Z.; “Diagnosing New Faults Using Mutants and Faults of Prior Releases (NIER Track)”, Proc. of 33rd International Conference on Software Engineering, ACM, Honolulu, Hawaii, USA, May, 2011--accepted.
Murtaza, S.S.; Madhavji, N.H.; Gittens, M.; Li, Z.; Wilding, M.; Miranskyy, A.; Godwin, D.; “F007: Finding Faulty Functions from the Function-call level Traces of the Field Failures”, IEEE Transactions on Software Engineering,IEEE, USA, 2011--submitted. Murtaza, S.S.; Madhavji, N.H.; Gittens, M.; Li, Z.; “Using Mutants to Discover New and
Rediscovered Field Faults by Exploiting the Similarity of Traces among Different Faulty Functions”, IEEE Transactions on Software Engineering, IEEE, USA, 2011--submitted.
Offutt, A., J.; and Untch, R., H. “Mutation 2000: Uniting the Orthogonal,” in Mutation Testing for the New Century, Wong W,E., Ed., USA: Kluwer Academic
Publishers, 2001, pp. 34-44.
Ostrand T. J.; Weyuker E.; and Bell R. M. “Predicting the Location and Number of Faults in Large Software Systems.” IEEE Trans. on Software Engineering, Vol. 31, No. 4, 2005, pp. 340-355.
Podgurski, A.; Leon, D.; Francis, P.; Masri,W.; Minch, M.; & Sun, J.; Wang, B,
“Automated Support for Classifying Software Failure Reports”. Proc. Intl. Conf. on Software Engineering, IEEE CS, Portland, US, May, 2003, pp. 465-475 Proprietary workshop on large commercial software, Sep., 2008.
Schach S. R.; Jin B.; Yu L.; Heller G. Z.; and Offutt J.; “Determining the Distribution of Maintenance Categories: Survey versus Measurement”. Empirical Softw. Eng. Vol. 8, No. 4, Springer, Dec., 2003, pp. 351-365.
Chapter 2
2
F007: Finding Faulty Functions from the Function-call
level Traces of the Field Failures
2.1 Introduction
Corrective software maintenance activity rectifies faults in a program (e.g., faults reported by users) (Chapin, 2000). Schach et al. (2003) measured change logs and code modules of three software products (a commercial real-time product, a Linux kernel, and the GCC compiler) and found that approximately 53% to 57% of the maintenance time is spent in corrective maintenance, approximately 36-39% in perfective maintenance and approximately 2-4% in adaptive maintenance. Also, Lee & Jefferson (2005)measured a Web-based Java (TM) application, revealing that 32% of the maintenance time is spent in corrective maintenance, 62% in perfective maintenance, and 6% in adaptive maintenance. Likewise, Sousa (1998) conducted a survey of large financial organizations in Portugal and reported that approximately 36% of the maintenance time is spent in corrective maintenance, approximately 49% in adaptive maintenance and approximately 14% in perfective maintenance. Previous research thus suggests that corrective maintenance effort is significant and, thus, research aimed at reducing this effort should be of high priority in software engineering.
Also, studies have reported that as much as 100% of the field faults originate in 10% of the code (Gittens et al., 2005), and 92% of the overall faults originate in 20% of the files (Ostrand et al., 2005) — this is the “80-20 Pareto rule” for software. Thus, if 50-90% of the field failures are rediscoveries of previous faults, and the faults originate from 20% of the code, then 20% of the code is causing 50-90% of the field failures. If the faulty code (e.g., components, functions or such abstractions) can be easily or automatically identified, then this should significantly reduce the maintenance effort, cost and time.
Figure 2: An example of common patterns in failed function-call level executions of
the Space program.
During our preliminary experiments involving the Space4 program (Do et al., 2005), we observed that if the same, or different, fault occurs in the same function then, in the most cases, the function-call level execution traces involving that function have similar function-call sequences. For example, Figure 2 (part ‘a’) shows that the sequence of last function-calls for two different faults (version5 12 and 18) in the same function “sgrrot” are exactly the same. On the other hand, in part ‘b’ the sequence of the last function-calls due to a fault in function “GetReal” is different from the sequence in part ‘a’. Figure 2
4
Space is a C program, an interpreter for an antenna array definition language written for the European space Agency and faults were found during development.
5
shows only the last function-calls but similar characteristics (with some variations) were also observed in the sequences of earlier function-calls. Moreover, in the cases of other faulty functions of the Space program, we observed similar characteristics as described for Figure 2.
These early observations, as explained above for Figure 2, warranted further empirical
investigation. In particular, if these observations of similar function-call patterns held; and 50-90% of the faults were rediscoveries; and the Pareto rule also held, then the faults causing the majority of the field failures could be discovered by using the “failed” traces of a few earlier faults originating in a small percentage of the code. This is the fundamental motivation and basis of our investigation and it represents a divergent approach to locating faulty functions from execution traces.
This paper, therefore, addresses the problem of identifying the “function”-level origin of the field failures in the code. Our focus is on those field failures that can occur due to: (a) previously known faults or (b) a new fault in a previously known faulty function. The rationale behind this is rooted in empirical findings: (i) a significant amount (50-90%) of the field failures are rediscoveries (Brodie et al., 2005; Lee and Iyer, 2000; Wood, 2003); and (ii) 80% of the field failures are concentrated in a relatively minor segment (20%) of a system (Gittens et al., 2005; Ostrand et al., 2005). Also, supporting this rationale is that faults in the same function occur with similar patterns of function calls (see Figure 2)6. In short, this paper focuses on using only a small part (20%) of the software system to solve the problem of identifying most (80-90%) of the rediscovered faults of a software system.
Our technique (called F007) uses a pre-classified, historical, collection of only “failed” function-call traces to identify faulty functions in newly collected failed traces. F007 trains a decision tree on the pre-classified collection to identify faulty functions in new failed traces. This pre-classified collection can be built from a collection of failed traces with the known faulty functions, obtained from the executions of software test cases. The
6
reason for using in-house traces is in one of our studies on a very large commercial application (Gittens et al., 2005): we found an overlap in the location of faults in source code between field and pre-release failure; and we found that in general 20% of the code is responsible for 80% of the faults. Later on, failed traces from the field, as they get resolved, can be added to the collection, since the majority of faults are rediscoveries.
Previous techniques related to the field failures focus on: (a) classifying successful and failed traces (e.g., using decision trees (Haran et al., 2007), and using Markov model (Bowring et al., 2004)); (b) classifying rediscovered crashing failures via symptoms (Brodie et al., 2005; Lee and Iyer, 2000); (c) clustering traces related to coarse-grained code (e.g., files) (Podgurski et al., 2003); and (d) using statistical debugging (Chilimbi et al., 2009; Liu et al., 2005) to identify the origin of the field failures. The novelty of F007 can be readily seen from the contrast with previous approaches:
1. F007 can identify faulty functions (of rediscovered or new faults in the same function) in failed traces of both crashing (e.g., segmentation fault) and non-crashing (e.g., logical error) faults by using the knowledge of only previously resolved failed traces. In contrast, other techniques (Brodie et al., 2005; Lee and Iyer, 2000) identify faults in only crashing situations, identify faults at coarse grained level (e.g., files) (Podgurski et al., 2003), need knowledge of the type of a fault (Liu et al., 2005), and require a collection of passing traces with failing traces related to a fault (Chilimbi et al., 2009; Liu et al., 2005). It should be noted that: (a) the non-crashing failures are more difficult to solve because a user may not recognize the failure until well after the execution of the faulty code; whereas the origin of the crashing failure can be readily identified by the same last sequence of function-calls after a crash (Podgurski et al., 2003); and (b) collecting many passing and failing traces is not feasible in the field because of the overhead of trace collection and the user’s resources consumption in fault reporting.
this by further examining only the failed traces to identify a faulty function in a failed trace.
3. When experimenting for F007, we discovered that only function entry OR exit points are required for finding the faulty functions in the failed trace. This reduces the overhead (runtime and size) by approximately half. This further distinguishes F007 from other techniques.
4. This paper further validates our previous work (Murtaza et al., 2010) on F007. Previously (Murtaza et al., 2010), we evaluated F007 only on the Siemens suite (Hutchins et al., 1994) which contains one release of seven small programs (128-494 LOC). This paper extends our work on F007: (a) by evaluating F007 on larger programs, such as: Space program (5767 LOC) (Do et al., 2005); several releases of four open source UNIX utilities. Flex, Grep, Gzip and Sed (4032-9831 LOC) (Do et al., 2005); and three releases of a very large commercial enterprise-level software of approximately 20 millions LOC and 200,000 functions; (b) by showing that F007 can use the traces of faulty functions of earlier releases to accurately identify the same faulty functions in subsequent releases; and (c) by showing that F007 can be used efficiently on very large programs by removing irrelevant function-calls. This further strengthens the significance of F007.
on reviewing 5% or less of the code and (ii) 65-80% in the very large software system on reviewing 3% or less of the code. A direct comparison of F007 with other techniques does not exist (see Section 3.10). However, previous approaches that use function-call level traces (e.g., Di Fatta et al. (2006) and Tarantula (Jones and Harrold, 2005) on function coverage by Di Fatta et al. (2006)) identify only up to 40% faults (i.e., faulty functions) by reviewing 20% of the code in the Siemens suite; whereas, F007 can identify 70% faults (i.e., faulty functions) by reviewing 20% of the code.
These results imply that: (a) F007 can identify faulty functions in majority of the failed traces by using a small percentage of the previous failed traces; and (b) faults in the same function occur with similar function-call traces. F007 actually identifies faulty functions in a failed trace which makes it important when only a few traces are available for the fault discovery from deployed software—mostly the case due to trace overhead or user’s resources consumption in fault reporting. F007 is therefore valuable since most of the field failures are rediscoveries of the faults originating from the same area of source of code. Thus F007 has the potential to reduce the corrective maintenance effort from the point of view of locating the finer-grained fault origin (faulty functions) from the field.
This paper continues as follows: Section 2.2 describes related work; Section 2.3 describes the F007 technique; Section 2.4 discusses the experimental setup; Section 2.5 shows an example of F007 from the Siemens suite (Do et al., 2005; Hutchins et al., 1994) ; Section 2.6 evaluates the results of executing F007 with the Siemens suite, the Space program (Do et al., 2005) and the UNIX utilities (Do et al., 2005); Section 2.7 validates F007 on a very large commercial application; Section 2.8 elaborates on the example execution from the perspective of prediction of faulty functions across releases; Section 2.9 summarizes the results on all the programs; Section 2.10 compares F007 against the contemporary techniques; Section 2.11 explains threats to validity; and Section 2.12 concludes and describes future work.
2.2 Related Work
Wong et al., 2007) and recording function sequences (Dallmeier et al., 2005; Di Fatta et al., 2006); and (b) fault discovery techniques for field failures scuh as statistically identifying field failures (Liu and Han, 2006; Podgurski et al., 2003), techniques for classifying field failures (Bowring et al., 2004; Haran et al., 2007; Elbaum et al., 2007), techniques for rediscovering known problems (Brodie et al., 2005; Lee and Iyer, 2000), and techniques for localizing system configuration level faults (Chen et al., 2004; Ding et al., 2008; Yuan et al., 2006). In the following sub-sections, we elaborate on each of these techniques.
2.2.1
In-house Fault Localization Techniques
Agrawal et al. (1995) present a heuristic method which considers that the fault lies in the difference between a successful test case execution and a failed test case execution, known as a dice. Wong et al. (2006) present two improvements over this dice-based technique (Agrawal et al., 1995): (a) if a bug is not found in a dice, then the first improvement, called augmentation, incrementally includes the code from the intersection of a failed test case and a successful test case; and (b) if a dice is too big then another improvement, called refining, gradually decreases the code by differentiating the dice with another successful test case
Jones and Harrold (2005) and Wong et al. (2007) discover faulty statements in a program by using a theory that statements executed by passing test cases are less likely to be faulty compared to those executed by failing test cases. Zhang et al. (2009) identify suspected statements by contrasting edge profiles (i.e., paths executed when control moves from one branch to another) of failing and passing runs. They (Zhang et al., 2009) argue that propagating faulty program states can be captured using edge profiles, which can identify faulty statements better than coverage based techniques such as the technique by Jones and Harrold (2005).
weight assertions (e.g., null pointer check) and then apply a statistical utility function on the assertions obtained from failed and successful executions. This is to discover faulty assertions (e.g., null pointers).
These techniques are suitable for in-house testing but not for deployed software because: (a) mostly they require a collection of failing traces related to one fault7, but failure traces in the field do not necessarily result due to the same fault; (b) in deployed software, often only a few traces (at the time of fault) are available due to the overhead incurred in trace collection, and sometimes it is not known if a trace is passing or failing; (c) different customer usages can result into many different normal execution paths that are not observed in passing executions in in-house testing, and it is not feasible to collect many passing traces from customers due to overhead involved in trace collection; (d) finer grained (e.g., statement coverage) coverage profiles are costlier to collect than function coverage; and (e) the statistical-debugging based techniques require the knowledge of the type of bug for instrumentation, and if a fault is not found another type of assertion (e.g., null pointer check) is instrumented in source code, and so on the process is repeated until the fault is found.
2.2.2
Statistically Identifying Field Failures
Podgurski et al. (2003) form clusters of execution traces of the field failures based on common faulty source files. The granularity in the Podgurski et al. approach is a faulty file, whereas the majority of the clusters contained failed traces with multiple files (fault origin), making it unsuitable for the manual investigation of the correct faulty file (and finer-grain origin gets even more difficult). In contrast, F007 discovers faults automatically at the finer-grained, function-level; and the faults in the majority of traces can be discovered correctly by reviewing the first suspected function. Podgurski et al. (2003) experimented on GCC, Javac and Jikes; whereas, we experimented on the Siemens suite, the Space, the UNIX utilities and the large commercial program.
7
Liu and Han (2006) cluster failing runs according to a rank list of assertions obtained using the statistical debugging tool SOBER (Liu et al., 2005). In the approach by Liu and Han (2006), the fault locations (in the Siemens suite) are discovered by following the top rank predicates in the list produced using SOBER. However, their approach also requires a collection of the passing traces and the failing traces for the same fault. Their work (Liu and Han, 2006) also suffers from the limitations of statistical debugging (see Section 2.2.1). F007 can discover faulty functions without such limitations.
Another statistical debugging tool, HOLMES (Chilimbi et al., 2009), uses path profiles to classify faults for deployed software. Their technique can only be applied to the server side applications (Chilimbi et al., 2009), because they have to redeploy software components with instrumentation of selected functions to collect the passing traces and the failing traces pertaining to one fault (a limitation, see Section 2.2.1). In some cases, this may not be feasible for running servers as well due to the runtime redeployment of instrumented software components.
2.2.3
Classifying “Pass-fail” Field Traces
2.2.4
Rediscovery of Problems
Brodie et al. (2004) use string matching to group one function-call trace of a crash with other groups of function-call traces for different crashes. The groups of crashes were formed by exactly matching the function-call paths of different crashes. They claim that every group, formed on the basis of the same trace matches, has the same crashing reason. However, traces due to the same crashing reason (or same fault) are not exactly the same, and they can take different approaches. Lee and Iyer (2000) propose a technique to classify the rediscovered crashing failure by literal matching of its function-call trace with already known failure traces. They consider a variety of heuristics to match several function-call paths followed by the same fault. In F007, we model several paths leading to the same fault by the decision tree algorithm. F007 addresses the more difficult problem of non-crashing failure classification, where a user may notice a failure well after the execution of the faulty code (Podgurski et al., 2003). For example, if a Statement object is not de-initialized in a Java program, memory consumption continues to increase, and application slows down due to swapping by OS: this occurs long after many functions execute that object. Similarly, initialization of a wrong value to a variable can influence in the wrong output well after the manipulation of that variable. F007 can discover faulty functions in both the non-crashing and crashing failure traces.
2.2.5
Localizing System Level Faults
techniques (Chen et al., 2004; Ding et al., 2008; Yuan et al., 2006) could first identify faults at the system level (e.g., memory overload); F007 can then identify logical faults within a program (e.g., infinite loop).
2.2.6
Research Gap
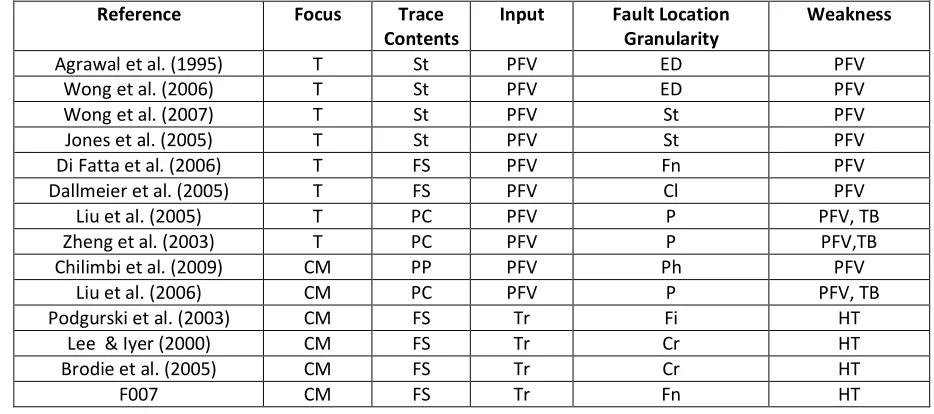
Table 2 characterizes closely related techniques in four categories: focus of the research; fault localization at a level of single trace or at a level of collection of traces for one fault; fault localization granularity; and the specific type of knowledge required to discover faults. Each category further classifies each technique. For example, the focus of research classifies each technique into testing and corrective maintenance.
Table 2. Characterization of F007 and closely related techniques.
• Focus: Testing (T); and Corrective Maintenance (CM).
• Trace Contents: Statement coverage (St); Function Sequence (FS); Predicate Count (PC); and Path Profile (PP).
• Input: Single Trace (Tr); and Collection of Passing Traces and Failing Traces for one Fault of a Program (PFV)
• Fault Location Granularity: Function (Fn); Statement (St), File (Fi), Predicates (check points in code)(P); Paths (Ph); Cause of Only Crashing Failures (hardware, software) (Cr ); Execution Dice (ED); and Class (Cl). • Weakness: Type of bug (TB); Collection of Passing Traces and Failing Traces for one fault of a program (PFV); and Historical Traces for Faults (HT).
Reference Focus Trace
Contents
Input Fault Location
Granularity
Weakness
Agrawal et al. (1995) T St PFV ED PFV Wong et al. (2006) T St PFV ED PFV Wong et al. (2007) T St PFV St PFV Jones et al. (2005) T St PFV St PFV Di Fatta et al. (2006) T FS PFV Fn PFV Dallmeier et al. (2005) T FS PFV Cl PFV Liu et al. (2005) T PC PFV P PFV, TB Zheng et al. (2003) T PC PFV P PFV,TB Chilimbi et al. (2009) CM PP PFV Ph PFV
Liu et al. (2006) CM PC PFV P PFV, TB Podgurski et al. (2003) CM FS Tr Fi HT
Lee & Iyer (2000) CM FS Tr Cr HT Brodie et al. (2005) CM FS Tr Cr HT
The closest techniques to F007 (i.e., techniques for corrective maintenance) focus on: (a) finding a fault in a trace at coarser (file) level (manual investigation of the finer-grain origin of fault remains difficult) (Podgurski et al., 2003); (b) discovering only crashing faults (Brodie et al., 2005; Lee and Iyer, 2000); and (c) identifying fault by using many passing traces and failing traces for a fault (Chilimbi et al., 2009; Liu and Han, 2006). F007 fills the gap of finer-grained discovery of fault origin (faulty function) from only a failed field trace of the deployed instance of a software application (by using previous failed traces from field or in-house testing). F007 distinguishes from these techniques in the following ways:
• F007 contributes by showing that different faults in the same function occur with similar function-calls (see Section 2.6.2).
• F007 can discover (new or old faults in the same) faulty functions in a failed field trace by reviewing only a small percentage of the code (e.g., first two to three functions; described in detail in Section 2.6.2 and Section 2.7).
• F007 shows that only “function-entry” or only “function-exit” are sufficient to identify faulty functions (or fault origin) from a function-call trace (see Section 2.6.4). This discovery facilitates in reducing the size and trace collection overhead to approximately half.
These distinguishing factors of F007 are significant for the deployed systems when only a few traces are available—mostly the case due to user’s time consumption and trace overhead. Also, if most of the field failures are (50-90%) rediscoveries and originate from the same area (20%) of code, then (considering the above factors) F007 can discover the origin (faulty functions) of the majority of faults (see Section 2.6.2 and Section 2.7).
2.3 The F007 Technique
from failed executions (e.g., as in Figure 2). F007 also assumes that the faulty functions have previously been identified in a historical collection of traces.
Also recall from Section 2.1 that an initial collection of traces can be built using in-house test case traces of software because there is an overlap between the origin of in-house and the field faults (Gittens et al., 2005). Subsequently, failed traces from the field can be added to the collection. This is because most of the faults (80-90%) are rediscoveries originating with similar patterns from the same area (20%) of source code.
Following are the primary two steps of F007:
Step 1: F007 first extracts patterns (combinations) of function-calls from the given function-call traces using the MINEPI algorithm (Mannila et al., 1997). (Function-call level execution traces are shown in Figure 2, where “function entry” and “function exit” show when control enters and exits a function respectively.) The MINEPI algorithm is used to identify temporal patterns in sequences; e.g., if function “TapeGet” is called in part ‘b’ of Figure 2 then another “TapeGet” would follow within the distance of one function-call.
Step 2: F007 then trains decision trees (Witten and Frank, 2005) on these patterns (obtained from historical traces of in-house or field faults) to discover faulty functions in a given set of new trace of failure. The decision tree is a well known classification algorithm (Witten and Frank, 2005). For example, F007 trains a decision tree on the historical collection of traces for each faulty function. Whenever a new failed trace arrives, each decision tree tries to associate the patterns in the new trace with its knowledge of patterns. Each decision tree then predicts its faulty function for a new trace with a probability. Predicted faulty functions are then arranged in a list in the decreasing order of their predicted probabilities. The list of faulty functions is then presented to developers with the knowledge that functions with the highest probabilities should be considered highly suspected faulty functions.
and the decision tree algorithm (in the second step) can further leverage these similar patterns by associating them to common faulty functions. An example of similar patterns of function-calls is shown in Section 2.1.
Section 2.3.1 describes step 1 of F007 (the MINEPI algorithm to extract patterns of function-calls), and Section 2.3.2 describes step 2 of F007 (the decision tree algorithm).
2.3.1
MINEPI
Mannila et al. (1997) propose two algorithms (WINEPI and MINEPI) to discover temporal patterns in log files such as telecommunication alarms and data logs for Web servers. The sequences of function-calls (see Figure 2) bear similar temporal relationships to each other. Association rules (Witten and Frank, 2005) do not discover such temporal relationships. For example, the time duration of two function-calls is not considered in the association rules; whereas the function-calls in a trace bear temporal relationships and MINEPI can extract the temporal relationship. MINEPI is preferred over WINEPI because it can discover patterns not discovered by WINEPI (Mannila et al., 1997).
Fundamental Definitions: We shall now summarize the MINEPI algorithm (Mannila et
al., 1997) by using the notations and definitions used by Mannila et al. (1997), with minor modifications and simplifications:
• First, consider a set R of event types.
• An event is expressed as a pair (A, t), where:
A ∈ R is an event type, and t is an occurrence time of the event expressed as an integer --indicating the order of this event in the temporal sequence.
For example, in our case the name of a function in a function-call level trace is an event type (A) and the t is the calling order of the function in a function-call trace.
Ts <= Te and Ts is the (integer) starting time, and Te is the (integer) ending time, and s= < (A1, t1), (A2, t2)……. (An, tn) > is an ordered sequence of events such that
Ai ∈ R for all i=1….. n, and ti <= ti+1 for all i=1….. n-1, and Ts <= ti < =Te for all i
= 1 to n.
For example, a sequence of events is shown in Figure 3 (which we use in examples in the rest of this section; serial and parallel episodes in Figure 3 are explained later). In Figure 3, foo1, foo2, foo3 and foo4 are the event types (functions), (foo1,1) is an example of the
event (A,t), Ts= 1 and Te=12; and s= < (foo1,1), (foo2,2)…… (foo4,12) >.
Figure 3: Event (function) sequences and episodes.
• An episode α is a pair (V, ≤) where V⊂ R and “≤” is a partial order relationship on V. If a partial order ≤ among predicates of an episode is a trivial partial order (unordered) then the episode is called a parallel episode; that is, Ai ≰ Aj for all Ai, Aj ∈ V such that
Ai≠ Aj. If a partial order “≤” among predicates of an episode is a total (fixed) order then
the episode is called a serial episode; that is, Ai ≤ Aj or Aj ≤ Ai for all Ai, Aj ∈ V. An
episode α = (V, ≤) occurs in an event sequence S if: (i) for all Ai ∈ V there is an event
(Ai, ti) in S; and (ii) for all Ai, Aj∈ V with Ai ≤ Aj and Ai ≠ Aj there are events (Ai , ti)
and (Aj, tj) in S such that ti < tj. The length ‘L’ of an episode α is the number of event
types in an episode, i.e., |V|.
In this text, we denote trivial partial order by “:”symbol between two event types of a parallel episode and a total (fixed) order by “<” symbol between two event types of a serial episode. Suppose A1, A2 .… An∈ V then we represent a serial episode as “A1 < A2
represents a serial episode of Length 2 in Figure 3, and it shows that foo3 precedes foo4.
Similarly, “foo1 : foo2” is a parallel episode of Length 2 in Figure 3 that shows that foo1
and foo2 occcur together but not in a fixed order.
• A episode β = (V' , ≤ ' ) is a sub-episode of α= (V, ≤), denoted by β ⊂α , if there exists an injective mapping f: V' V such that f(A') = A for all A' ∈V ' and A ∈V, and for all Ai' , Aj' ∈ V ' with Ai' ≤' Aj' then f(Ai') ≤ f(Aj') such that f(Ai') = Ai and f(Aj')=
Aj and Ai , Aj∈V.
• A window on an event sequence S (s,Ts,Te) is also an event sequence W (w, ts, te), where: ts <= Te, te >= Ts, ts <= te, and w consists of the events (Ai, ti) with ts <= ti <=
te and Window width,win(w), is the time span te –ts.
An example of the window width of win (w)= 3 is shown in Figure 3, and it is W (<(foo2,
4), (foo1,5), (foo3,6), (foo4,7) >, 4, 7).
• The minimal occurrence of an episode α in an event sequence S is the interval [ts, te], if α occurs in a window W(w, ts, te) and α does not occur in any proper sub-window W'(w', ts', te') such that ts<= ts' and te'<=te and win(w') < win(w). The set of minimal occurrences of an episode α in a given event sequence is denoted by mowin (w)(
α
):mo win (w)(
α
) = { [ts,te] | [ts,te] is a minimal occurrence of α }• The number of minimal occurrences of an episode in a sequence is the frequency8 “|mowin(w)(α)|” of an episode.
Thus, we extract only those episodes which have minimal occurrences for a window width. For example:
8
(1) Serial episode “foo1 < foo2” minimally occurs twice ( |mo4(foo1<foo2)|=2 ) in the
event sequence in Figure 3 during the intervals {[1,2],[8,11]} for the window width win(w)=4. In the interval [1,4] “foo1<foo2” is minimally true for “foo1” at t1
and “foo2” at t2, but not for ‘foo2’ at t4 because there exists ‘foo2’ at t2 which is
true for the minimal occurrence of “foo1 < foo2” in the interval [1,4]. Length ‘L’
of the episode “foo1< foo2” is 2.
(2) Parallel episode “foo1 : foo2” (length L=2) minimally occurs in the event sequence
of Figure 3 for the win(w)=2 at the intervals [1,2], [4,5], [8,9].
(3)Parallel episode “foo1:foo2:foo3” (Length L=3) is minimally true for win(w)=3 in
intervals {[1,3], [3,5], [4,6], [6,9],[8,11]}, and is not minimally true for the interval [2,5] because there exists a sub-interval [3,5], i.e., [3,5] is the minimal occurrence within the interval [2,5]. Similarly, it is also not minimally true for the interval [1,4] because [1,3] is the minimal occurrence.
• An episode rule is an expression of the form β [win(w1)] ⇒ α [win(w2)], where β ⊂
α (β is a sub-episode of α) and win(w1), win(w2) are integers. Episode β has a minimal
occurrence at the interval [ts,te] with window W1(w1, ts, te) and te – ts ≤ win(w1), and
episode α has the minimal occurrence at the interval [ts,t'e] with window W2(w2, ts, t'e)
for some t'e such that t'e – ts ≤win(w2) and t'e > te. Confidence of the rule β [win(w1)] ⇒α [win(w2)] is given as:
|
)
(
|
|
)}
(
|
)
(
{
|
) ( ) ( ) ( 1 2 1β
α
β
w win w win w winmo
mo
mo
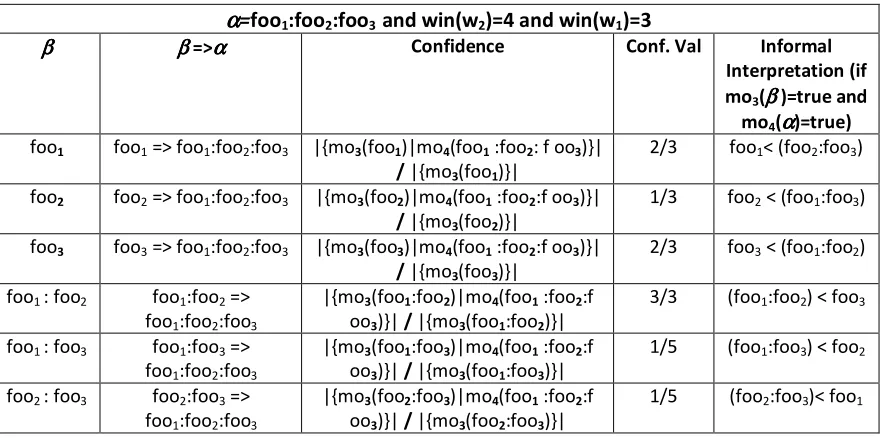
For example, “foo1” is the only sub-episode of the serial episode “foo1 < foo2” that could be extracted according to the definition of episode rule (i.e, a subepisode should begin at the same time as an episode and subepisode’s time interval should not be greater than an episode). The episode rule for this serial episode with win(w2)=4 and win(w1)=3
is “foo1[3] => (foo1< foo2)[4]”. Confidence of this episode rule, from the event sequence
3 2 ) ( | )} ( | ) ( { | 1 3 2 1 4 1
3 < =
foo mo foo foo mo foo mo
This rule is read as “if ‘foo1’ minimally occurs within the window width of 3 time units,
then there is a 67% (2/3=0.67) chance that ‘foo2’ will follow ‘foo1’ such that “foo1 <foo2”
occurs minimally within 4 time units.”
Executing MINEPI: The MINEPI algorithm starts by first extracting minimal occurrences
of all the episodes of length L=1. Subsequently, it extracts minimal occurrences of all the higher length episodes (serial or parallel) of length L = 2, 3 to n incrementally for a particular window width. Maximum value of the length ‘L’ and the window-width is decided by the user in the MINEPI algorithm. Also, the minimum frequency is set by the user. This is to select the frequent episodes beyond a minimum frequency value. For example, a user can select episodes with minimum frequency greater than 5.
After extracting all the episodes, episode rules are generated for each episode by identifying every sub-episode of an episode as per the definition of episode-rule. An episode rule β [win(w1)] ⇒α [win(w2)] is generated if conf (β [win(w1)] ⇒α [win(w2)])
is greater than the minimum confidence. (The minimum confidence for an episode rule is also set by a user.) To keep things simple: we chose win(w2) in the rule to be the
maximum window width set by the user and set win(w1)= win(w2) - 1, for all our rules;
and we also write the rule β [win(w1)] ⇒α [win(w2)] as β⇒α. For example “foo1[3] =>
(foo1< foo2)[4]” can be written as “foo1=> foo1< foo2” that is foo1 within window width 3
precedes foo2 with 67% chance within a window width of 4.