Efficient Range Alignment Algorithm for Real-Time
Range-Doppler Algorithm
Joo-Ho Jung1, 2, Si-Ho Kim3, Ji-Hoon Bae4, Kyung-Tae Kim4, and Sang-Hong Park5, *
Abstract—When deriving a range-Doppler image or a time-frequency image of a fast-maneuvering target at long range, existing range alignment methods yield poor results due to the large numbers of range profiles (RPs) and range bins that are required for this task. This paper proposes a three-step range alignment method to overcome the problems of these existing methods and to yield focused images: (1) coarse alignment using the interpolated center of mass of each RP, (2) fine alignment with an integer step using an entropy cost function, and (3) fine-tuning using particle swarm optimization. Compared to existing methods, the proposed method is computationally more efficient and provides better image focus.
1. INTRODUCTION
The range-Doppler algorithm (RDA) is widely used to generate a micro-Doppler (MD) or inverse synthetic aperture radar (ISAR) image of a target [1–3]. MD and ISAR images can be generated by synthesizing range profiles (RPs) obtained from various observation angles. An MD image is represented in the time-frequency domain to describe the time-varying MD signal; an ISAR image is represented in the range-Doppler domain to express the Doppler frequency of a rigid body. The key step of the RDA is a compensation for the translational motion that occurs between RPs. If translational motion compensation is not applied, images can be seriously blurred because a given scatterer can become located in different range bins in different RPs. In translational motion compensation, RPs are aligned by a range alignment (RA) algorithm that places the scatterer in the same range bin, and residual phase error of each RP is removed by a phase adjustment algorithm.
A nonparametric method RA that minimizes a 1-D entropy function is widely used because it is insensitive to noise or scintillation of scatterers [4]. Some derived methods [5–8] reduce the computation time and increase the accuracy of alignment. However, the main problem of existing RA methods is that the results were mostly obtained when the flight trajectory of the targets was very short and nearly linear. In real imaging situations, a long flight trajectory is required to obtain the aspect angle needed for a given Doppler resolution; as a result, the number of range bins increases drastically, and the trajectory can be highly nonlinear. Consequently, the computation time of the methods in [4] increases, and the alignment results of [5–7] based on the trajectory modeling degrade due to mismatch between the trajectory and the polynomial function that is used to approximate it. The algorithm in [8] also consumes more computation time because of the poor convergence of the cost function.
This paper proposes a fast and accurate RA method that is an improved version of the method introduced in [9] and is conducted in three steps: (1) coarse alignment using the interpolated center of
Received 1 September 2017, Accepted 23 October 2017, Scheduled 5 November 2017 * Corresponding author: Sang-Hong Park ([email protected]).
mass (COM) of each RP, (2) fine alignment with an integer step using an entropy cost function in [4], and (3) fine-tuning using particle swarm optimization (PSO). In simulations using the measured range profile of a ballistic missile model, the proposed method aligned images faster and provided better image focus than did existing methods.
2. FUNDAMENTALS OF TRANSLATIONAL MOTION COMPENSATION AND PROPOSED METHOD
2.1. Translational Motion Compensation
If a target is stationary and rotating or engaged in micro-motion, scatterers will remain in fixed range bins. However, because targets engaged in the translational motion may travel several range bins between radar pulses, a specific scatterer is generally located in different range bins in different RPs; when this shift occurs for numerous scatterers the reconstructed image can be corrupted. Therefore, RPs must be moved so that scatterers are positioned in the same range bin. In addition, phase errors occur in each RP if RPs are aligned without any phase compensation; these errors must be corrected.
Because accurate information about the motion parameters of a target is generally not given, the relative shifts and the phase errors cannot be determined. For this reason, methods must not depend on the information on the motion. RA methods that use cost functions such as entropy [4] and correlation [1] to exploit the similarity between RPs have been popular. The 1D entropy cost function is very efficient and insensitive to background noise and scintillation of targets. Assumingαis the integer shift for RA,
nis the range bin index, |Gm(n)|and |Gm+1(n)|are the absolute values of the mth and the (m+ 1)th
RPs, andN is the total number of range bins, the 1D entropy is defined as [4]:
HGm,Gm+1 =− N−1
0
G(α, n) lnG(α, n), where G(α, n) = |Gm(n)|+|Gm+1(n−α)|
N−1
0
(|Gm(n)|+|Gm+1(n−α)|)
. (1)
In general, to minimize the error accumulation in the alignment, the average of the 1st to mth RPs is used instead of Gm(n). Then, the α that minimizes the 1D entropy is the shift that best aligns the
(m+ 1)th RP.
New global methods that model the range shifts as a polynomial have been proposed, to reduce error accumulation caused by integer shifts in Eq. (1) [5–7]. These methods utilize a polynomial or a combination of a polynomial and Gaussian basis functions to represent the shifts of the RPs and find the parameters that maximize the total energy of the sum of aligned RPs. One recently-proposed algorithm [8] reduces the computation time considerably by minimizing the cross-correlation between each RP and the average range profile (ARP) to minimize the entropy of the ARP. The cross-correlation in this method is conducted in the frequency domain to avoid an exhaustive search operation.
2.2. Problems of the Existing Method and the Proposed Method
The RA methods mentioned above assume that the trajectory of an imaged target is short and linear. Therefore, little computation time is consumed for alignment because only the number of range bins considered is small. However, when a target is located at a long range, the task of obtaining the aspect angle variation that gives a cross-range resolution requires a long flight trajectory. In addition, when a fast target such as a ballistic missile is considered, the trajectory is long even if the target is observed briefly. Therefore, much computation time is required to calculate Eq. (1) for all range bins; moreover, the trajectory can be significantly different from the polynomials in [5–7], so alignment errors may be large; in this case, the time that the method in [8] devotes to FFT increases as the number of range bins increases. The computation time can further increase if the cost function decreases slowly.
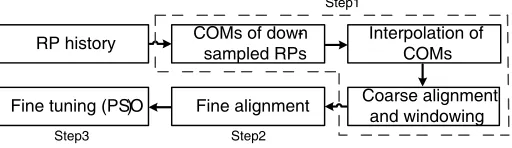
RP history COMs of down -sampled RPs
Interpolation of COMs
Coarse alignment and windowing Fine alignment
Fine tuning (PSO)
Step 1
Step 2 Step 3
Figure 1. Proposed range alignment method.
themth RP
COMm=
N−1
n=0
|Gm(n)| ×n N−1
k=0
|Gm(k)|
, (2)
where the parameters are the same as in Eq. (1). Because values are very small in most range bins that are not in the target regions, COMs in Eq. (2) are located in the target region. Therefore, RPs can be coarsely aligned by using the COM of each RP as a mark. This process is direct and can be done in real time. However, if the time difference between two RPs is short and the trajectory is piecewise linear, computing Eq. (2) as in [9] for all RPs can cause unnecessary computation time. Considerable computation time can be saved by interpolating the COM of an RP that is located between two RPs. Thus, RPs are down-sampled and COMs of the down-sampled RPs are computed. Then, COMs of the remaining RPs are interpolated using the two neighboring RPs. In this paper, we use a simple linear interpolation method because it is faster than polynomial-based methods. Using two RPsp and p+q, COMr forr=p+ 1 to p+q−1 can be interpolated as
COMr=
COMp+q−COMp
q (r−p) +COMp. (3)
Care must be taken in selecting the down-sampling rate: if it is too large, the interpolation error can be large, and if the rate is too small, computation time can be unnecessarily long.
After completing the coarse alignment, the range bins that belong to the target in each RP are located in a close range and the number of range bins that contain target returns is very small compared to the total number of range bins; the amplitudeAin most range bins is close to zero. The search space for the second step to find the minimum entropy can be considerably reduced by removing range bins that are irrelevant to the target. This process can be done by discarding range bins that have low A
and selecting those that have high A. Because the range of target region is different in each RP due to coarse alignment, the union of target regions of all RPs is selected; i.e., for each RP, the algorithm finds the minimum and the maximum range bins indices for which A is larger than a threshold set to be 3 ∼5% of the maximum peak value. Then the algorithm removes range bins that have indices smaller than the smallest minimum index and larger than the largest maximum index. For the better understanding of the proposed procedure, let ka be the range bin index where the amplitude is larger
thanη% (3≤η ≤5%) as follows: ˆ
k= arg
k
{|Gm(k)|> ηAmax}, 0≤k≤n−1, (4)
whereAmax= max{|Gm(k)|}. Then the window to clip the target range is given as
win= [ˆkminˆkmin+ 1ˆkmin+ 2. . .kˆmax], (5)
where ˆkmin= min(ˆk) and ˆkmax= max(ˆk). Finally, the RPm containing the target (=Gm win) is Gm win(r) =Gm(wim(r)), 0≤r≤ˆkmax−ˆkmin+ 1. (6)
The second step is performed by minimizing the 1D entropy of the clipped RPs with an integer step of 1 [4]. Because the clipped RPs have a small number of range bins, the alignment time is very short. In addition, because the RPs need not be shifted for the entire number of range bins, computation time can be further reduced if the range of relative shift among RPs is set appropriately. In this paper, we use the range bin with the maximum amplitude (RM). RM is found for each RP, the average RM (ARM) is computed, andD= ARM−RM is calculated for each RM. The range of the relative shifts is set to be between the most-positive and most-negative values of Dand the minimum entropy is found for the shifts in the range found.
However, minimization of the entropy of two RPs with an integer step of 1 can incur error within ±1
2 range bin. To solve this problem, we applied PSO [10]. Particles, each of which is a vector that
consists of a candidate set of shifts of the entire RPs, were randomly initialized within ±12 range bin and the one that minimizes the cost function was found by using particle dynamics to changing the velocity of each particle i:
vi(t) =φvi(t−1) +ρ1(xpbest−xi(t)) +ρ2(xgbest−xi(t)), (7)
whereρ1 =r1c1,ρ2 =r2c2,c1,c2 >0, andc1,c2 <4. r1 and r2 are random numbers that each have a
uniform distribution between 0 and 1.
For the cost function, the energy of the sum of the aligned RPs E, which shows the degree of the contrast of aligned RPs [6], was used as follows:
E =
N
i=1
|S(i)|2, where S(i) =
M
k=1
Gwin k(i), (8)
whereGwin kis thekth RP windowed by Eq. (6), and M and N are the number of RPs and range bins
respectively. To accelerate computation of the cost function, maximization of Eq. (8) is conducted in the frequency domain as follows (See [6] for the detailed procedure):
E=
N/2−1
k=1
|Q(k)|2, where Q(k) =
M−1
m=0
Am(k) exp
−j2π Nknm
, 1≤k≤ N
2 −1, (9) whereAm is the discrete Fourier transform of the absolute value of themth RP, and nm is the residual
shift of the mth RP. N and M are the same as in Eq. (8). Because RPs are well-aligned in the second step, PSO converges within a small number of iterations.
3. EXPERIMENTAL RESULTS
3.1. Simulation Results Using a Target of Point Scatterers
For the signal model, we assume a monostatic chirp waveform widely used for high resolution radar imaging [11]. The transmitted chirp signal can be expressed as
r(t) =A0e
j2πf0t+Bt2
2τ ×rect t τ , (10)
wherer(t) is a transmitted signal at timet,A0the initial amplitude of the signal,f0the start frequency, B the bandwidth, andrect(·) = 1 ift−τ /2≤t≤t+τ/2 and 0 otherwise. The received signal at each aspect angleθ from a target composed ofK scatterers is
g(θ, t) =
K
k=1 Ake
j2π
f0(t−dθ,k)+
B(t−dθ,k)2 2τ
×rect
t−dθ,k τ
, (11)
whereAk is the amplitude of thekth scattering center, anddθ,k is the time delay and thekthscattering
center. dθ,k is calculated using plane wave approximation, in which the distance to a scattering center
A target consisting of 50 isotropic point scatterers was used for the simulation. To be realistic, it was modeled using the 3D CAD data of a real F-14 fighter (www.3dcadbrowser.com). The radar signal was generated at the signal-to-noise-ratio = 10 dB by flying the aircraft from the initial position [x0y0z0] = [1 100 4] km in the [−1 −0.75 0] direction with v = 280 m/s and a = 10 m/s2
until the angular variation = 1.26◦ that corresponds to the down-range resolution was obtained. The signal had pulse repetition frequency PRF = 2 kHz, center frequency f0 = 9.15 GHz and bandwidth
BW = 200 MHz. To accelerate computation, the pulses were down-sampled to 128. The parameters used in the PSO are population size = 10, number of generations = 10, ϕ= 0.5, c1 =c2 = 1.49. The
program was written in Matlab R2010a and run in Windows 7 on Intel i7 processor. The source code for the fast Fourier transform was composed for fair comparison.
The efficiency of the proposed method was demonstrated by comparing its alignment results with those obtained using the entropy minimization proposed in [4], the polynomial method in [6], the minimum entropy of ARP method in [8], and the previous version of the proposed method in [9]. The polynomial used in [6] is defined as
nm= ∞
i=1 βi
2m M −1
i
, 0≤m≤M−1, (12)
wherenm andM are the same as in Eq. (9). For each iteration,βi was increased by a given step sizeμ
until Eq. (9) stopped increasing. Then,μwas halved andβi decreased until Eq. (6) stopped increasing.
This process of halvingμand increasing or decreasingβi was repeated until the cost function converged.
In this step, initial step size is very important because the wrong value can be selected if the cost function has local maxima.
(a) Alignment result (b) ISAR image
Figure 2. Alignment results using the polynomial method in [6].
(a) Iteration 1 (b) Iteration 2
Figure 3. Cost function values for 1st and 2nd iterations versus varying βi in [6]. Note that a local
(a) Alignment result (b) ISAR image
(c) Decrease of entropy versus iteration number
Figure 4. Alignment results using the minimum entropy of ARP in [8].
The method in [6] did not align the RPs correctly when initial step size was N/4, where N is the number of range bins in each RP (Fig. 2). Even though eight iterations were performed, serious alignment errors occurred basically because the polynomial does not represent the flight trajectory correctly. For this reason, an unrecognizable image was produced. The values of the cost function for the varyingβ1 (Fig. 3) demonstrate the reason for the poor alignment. In the first iteration, which finds
the linear component ofnm, the cost function had only one global minimum ∼3600. However, in the
second iteration,β2 found by the given algorithm with the step size ofN/4 had a local maximum near
280. Therefore, the alignment result was poor.
The alignment result (Fig. 4(a)) and the ISAR image (Fig. 4(b)) obtained using the minimum entropy of ARP method in [8] were much better than those in Fig. 2. The algorithm stopped when the entropy of ARP ceased to decrease after eight iterations (Fig. 4(c)). The computation time was relatively long (6.14 s) because of the large number of range bins. In addition, because this algorithm assumes that entropy decreases unimodally (no local minima), the sharpness of the ISAR image can be decreased if the entropy variation near the global minimum has several local minima.
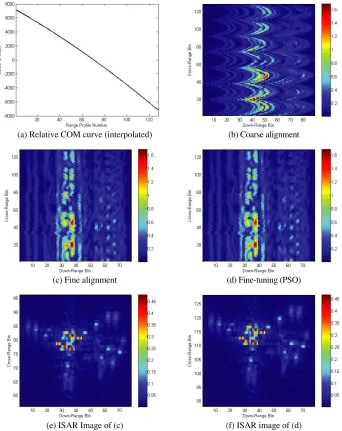
The proposed method provided well-aligned RPs and well-focused ISAR images (Fig. 5). To derive the COM curve, down-sampling rate ds= 20 was used; i.e., starting from the 1st RP, every 20th RPs
(a) Relative COM curve (interpolated) (b) Coarse alignment
(c) Fine alignment (d) Fine-tuning (PSO)
(e) ISAR Image of (c) (f) ISAR image of (d)
Figure 5. Alignment results using the proposed method (point scatterers).
result, the ISAR images derived from Figs. 5(c) and 5(d) had almost the same image focus (Figs. 5(e), 5(f)).
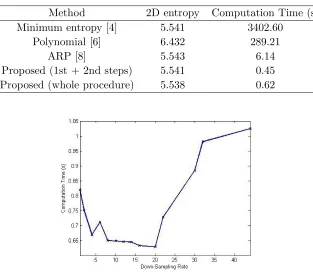
Computation time of the proposed method decreased asymptotically as ds increased from 0 to 20
(Fig. 6), then increased quickly at ds= 20. The increase occurs because as the number of ds increased,
the number of range bins that contain the target increases, because the difference between the linearly-interpolated COM curve and the real trajectory increased, so RPs were spread over several range bins (Fig. 5(b)). Therefore, care must be taken in selecting ds. In our numerous simulations, 14≤ds≤22
was appropriate.
The entropy of the image after phase adjustment [12, 13] and the computation time for the alignment were calculated for each method (Table 1). The entropy of the image was calculated as
Ent=
M
i=1 N
j=1
|I(i, j)|2ln|I(i, j)|2,0≤m≤M−1, (13)
Table 1. Comparison of each method (point scatterers, (ds= 20)).
Method 2D entropy Computation Time (s) Minimum entropy [4] 5.541 3402.60
Polynomial [6] 6.432 289.21
ARP [8] 5.543 6.14
Proposed (1st + 2nd steps) 5.541 0.45 Proposed (whole procedure) 5.538 0.62
Figure 6. Computation time vs. down-sampling rate.
entropy method with an integer step [4] only without the coarse alignment yielded a very accurate result, the same as in step 2 of the proposed method, but consumed an enormous time because>14000 range bins were for each alignment. The alignment using the polynomial in Eq. (9) gave the poorest result because of local minima were encountered during alignment (Fig. 2); entropy of the ISAR image was the highest and the computation time was>4 min due to the slow convergence of the cost function. The minimum entropy of ARP method in [8] consumed a relatively long computation time (6.1450 s) due to the large number of range bins. Furthermore, the iteration was stopped at a local minimum near the global minimum, so the entropy of the ISAR images were slightly poorer than in those given by the proposed method. Obviously, the proposed method was the fastest and provided the most-focused image. Fine-tuning provided a decrease of 0.003 in entropy at the cost of 0.1705 s increase in computation time.
3.2. Experimental Results Using Measured Data
Two experiments were conducted to demonstrate the efficiency of the proposed method.
In the first experiment, RPs of a fixed 1-m ballistic missile model located 7 m from the radar were obtained to extract the MD image. The model was engaged in spinning and coning motion and was observed for 1 s using an X-band radar with a bandwidth = 20 MHz (Fig. 7(a)). Because the target was fixed, RPs were located in the same position. Therefore, to simulate the ISAR imaging condition, each RP was shifted following a polynomial:
f(x) =−0.0005x2−x+ 1590, (14) forx = 1, 2, . . . , 1000. After range alignment, short-time Fourier transform [14] was applied to range bin containing the target to represent the MD signal in time-frequency domain.
(a) Measurement setup
(b) Aligned RPs (c) MD of (b)
Figure 7. Experimental results of the proposed method (missile model).
(a) Aligned RPs (b) MD of (b)
Figure 8. Experimental results of the polynomial method [6] (missile model).
least computation time (Fig. 7(c), Table 2). The polynomial-based method [6] was slower and less accurate than the proposed method because of the mismatch between the polynomial and the flight trajectory (Fig. 8). The ARP method [8] failed at alignment because the algorithm did not converge. Comparison between the results of the proposed algorithm after the 2nd step and after the whole procedure demonstrates that fine-tuning provided negligible improvement of the image and is therefore optional.
Table 2. Comparison of each method (missile model, (ds = 20)).
Method 2D entropy Computation time (s)
Polynomial [6] 8.9167 18.82
ARP [8] Unmeasurable Unmeasurable Proposed (1st + 2nd steps) 8.7808 0.85 Proposed (whole procedure) 8.7807 1.98
shifted using the following polynomial:
P oly=−5x2/M + 20x+ 1, (15)
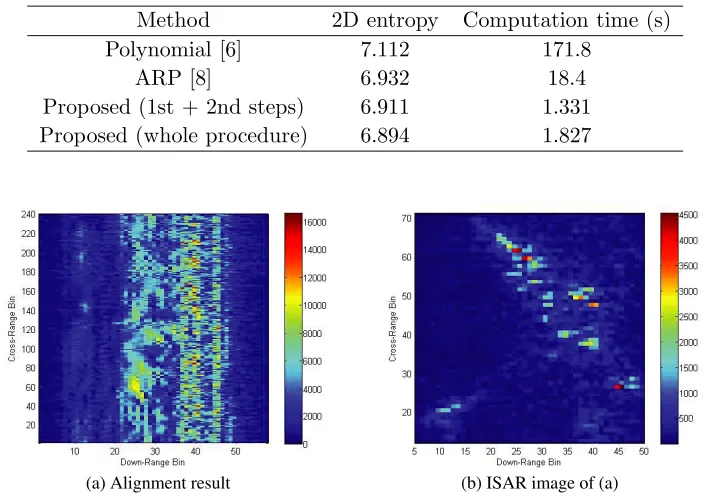
wherex=−120, −119, . . . , 210. M is the total number of RPs = 331. As in the first experiment, the proposed method provided a well-focused ISAR image (Fig. 9), and the comparison of the performance measures was similar to those of the first experiment (Table 3). RPs obtained using the polynomial were severely curved, so the ISAR image was blurred. The alignment result and the ISAR image of the minimum entropy of ARP method were much better than that of the polynomial method. However, the ARP method consumed 19.439 s because the program was stopped after 15 iterations due to poor convergence. The algorithm stopped at a local minimum, so the entropy was higher than that obtained using the proposed method. The results (Table 3) prove that the proposed method achieved the fastest computation and clearest ISAR image. The maximum, minimum and average of the accumulated error in the integer step alignment were 0.6292, 0.0250, and 0.2120, which were not enough to change the alignment result significantly when the nearest integer was selected. Optimization algorithms slightly improved the result due to the good result in the fine alignment with the degree of the improvement very close for each algorithm (Table 3). Therefore, this very simple PSO can be used alone to fine-tune the aligned RPs.
Table 3. Comparison of each method (Boeing 747, (ds= 20)).
Method 2D entropy Computation time (s)
Polynomial [6] 7.112 171.8
ARP [8] 6.932 18.4
Proposed (1st + 2nd steps) 6.911 1.331 Proposed (whole procedure) 6.894 1.827
(a) Alignment result (b) ISAR image of (a)
4. CONCLUSION
We proposed a three-step range alignment method that effectively aligns RPs when the flight trajectory is long to obtain the aspect angle for a given cross-range resolution. The proposed method reduces the computation time significantly and preserves the focus of the ISAR image. The first step uses interpolated COMs of the down-sampled RPs and windowing to reduce unnecessary search space significantly by coarsely aligning RPs. The second step uses the entropy cost function of a sum of two RPs to accurately align RPs with an integer step. Much time is saved in this step because of the reduced number of range bins in windowed RPs. The third step further fine-tunes the RPs aligned in the second step. In simulations using a target composed of point scatterers, the measured data of a ballistic missile model and the real data of a Boeing 747, the proposed method consumed less computation time while providing more focused ISAR images than existing methods.
ACKNOWLEDGMENT
This work was supported by the STRL (Sensor Target Recognition Laboratory) Program of Defense Acquisition Program Administration and Agency for Defense Development.
REFERENCES
1. Chen, C. C. and H. C. Andrews, “Target-motion-induced radar imaging,” IEEE Trans. Aerosp. Electron. Syst., 1980, Vol. 16, 2–14.
2. Ausherman, D. A., A. Kozma, J. L. Walker, H. M. Jones, and E. C. Poggio, “Development in radar imaging,”IEEE Trans. Aerosp. Electron. Syst., 1984, Vol. 20, 363–400.
3. Prickett, M. J. and C. C. Chen, “Principles of inverse synthetic aperture radar (ISAR) imaging,”
Proc. IEEE EASCON Rec., 340–345, January 1980.
4. Li, X., G. Liu, J. Ni, “Autofocusing of ISAR images based on entropy minimization,” IEEE Trans. Aerosp. Electron. Syst., Vol. 35, 1240–1251, 1999.
5. Wang, J. and D. Kasilingam, “Global range alignment for ISAR,” EEE Trans. Aerosp. Electron. Syst., Vol. 39, 351–357, 2003.
6. Wang, J. and X. Liu, “Improved global range alignment for ISAR,”IEEE Trans. Aerosp. Electron. Syst., Vol. 43, 1070–1075, 2007.
7. Park, S. H., H. T. Kim, and K. T. Kim, “Enhanced range alignment using a combination of a polynomial and Gaussian basis functions,” Progress in Electromagnetics Research, Vol. 95, 381– 396, 2009.
8. Zhu, D., L. Wang, Y. Yu, Q. Tao, and Z. Zhu, “Robust ISAR range alignment via minimizing the entropy of the average range profile,”IEEE Geosci. Remote Sens. Lett., Vol. 6, 204–208, 2009. 9. Park, S.-H., K.-T. Kim, J.-I. Park, and H.-T. Kim, “An efficient range alignment method for
long-range ISAR imaging,”International Radar Conf., 1–4, October 2009. 10. Kennedy, J. and R. C. Eberhart,Swarm Intelligence, Academic Press, 2001.
11. Mahafza, B. R., Radar Systems Analysis and Design Using MATLAB, Champman & Hall/CRC, 2000.
12. Wang, J., X. Liu, Z. Zhou, “Minimum-entropy phase adjustment for ISAR,” IEE Proc. Radar Sonar Nav., Vol. 151, 203–209, 2004.
13. Berizzi, F. and G. Corsini, “Autofocusing of inverse synthetic radar images using contrast optimization,” IEEE Trans. Aerosp. Electron. Syst., Vol. 32, 1191–1197, 1996.
![Figure 2. Alignment results using the polynomial method in [6].](https://thumb-us.123doks.com/thumbv2/123dok_us/1920630.1252069/5.612.123.494.555.704/figure-alignment-results-using-polynomial-method.webp)
![Figure 4. Alignment results using the minimum entropy of ARP in [8].](https://thumb-us.123doks.com/thumbv2/123dok_us/1920630.1252069/6.612.112.495.73.417/figure-alignment-results-using-minimum-entropy-arp.webp)
![Figure 8. Experimental results of the polynomial method [6] (missile model).](https://thumb-us.123doks.com/thumbv2/123dok_us/1920630.1252069/9.612.130.477.78.398/figure-experimental-results-polynomial-method-missile-model.webp)