Available Online atwww.ijcsmc.com
International Journal of Computer Science and Mobile Computing
A Monthly Journal of Computer Science and Information Technology
ISSN 2320–088X
IJCSMC, Vol. 4, Issue. 7, July 2015, pg.315 – 324
RESEARCH ARTICLE
Comparative Analysis of Data
Reduction Model for Diabetes
Bhavya
1, Pooja Mittal
2¹DCSA, Maharshi Dayanand University, India ²DCSA, Maharshi Dayanand, University, India
1 [email protected]; 2[email protected]
Abstract- Mining of the Data now a day plays a major role and concern in the present world in the industry and also in the research areas. -Data mining is the process of extracting hidden information from a large set of database and it can help researchers gain both novel and deep insights of unprecedented understanding of large biomedical datasets. Data mining can uncover new biomedical and healthcare knowledge for clinical decision making. Many tools and application software’s are evolved to mine the data and to present the best data visualization. One of the Data Mining tool available is WEKA, in which contain many machine level and other types of algorithms. The WEKA software was employed as mining tool for diagnosing diabetes. The Pima Indian diabetes database (PIDD) was obtained from UCI server and used for analysis. The dataset consist a total instance of 768 and 9 attributes (8 for input and 1 for output) which will be used to test and justify the differences between different filtering, attribute selection and classification methods. On the basis of relative absolute error, Stratified Remove Folds, Resample performed equally and these two outperformed Randomize, Remove Folds and Sparse to Non-Sparse. And on the basis of mean absolute error, Randomize and Sparse to Non-Sparse outperformed other three, and they both perform equally well.
Keywords- Data Mining, KDD, healthcare sector, Classification, diabetes.
I. INTRODUCTION
preprocessing is the first step in data mining which is a significant step in the knowledge discovery process, since quality decisions must be based on quality data. The goal of data reduction is to find a minimum set of attributes such that the resulting probability distribution of the data classes is as close as possible to the original distribution obtained using all attributes. Mining on the reduced set of attributes has additional benefits. It reduces the number of attributes appearing in the discovered patterns, helping to make the patterns easier to understand. Further it enhances the classification accuracy and learning runtime [9]. The available raw medical data are widely distributed, heterogeneous in nature, and voluminous. These data need to be collected in an organized form. This collected data can be then integrated to form a hospital information system [11]. More specialized medical data mining, such as predictive medicine and analysis of DNA micro-arrays. Other data mining applications include associating the various side-effects of treatment, collecting common symptoms to aid diagnosis [8].
A. KDD Process:
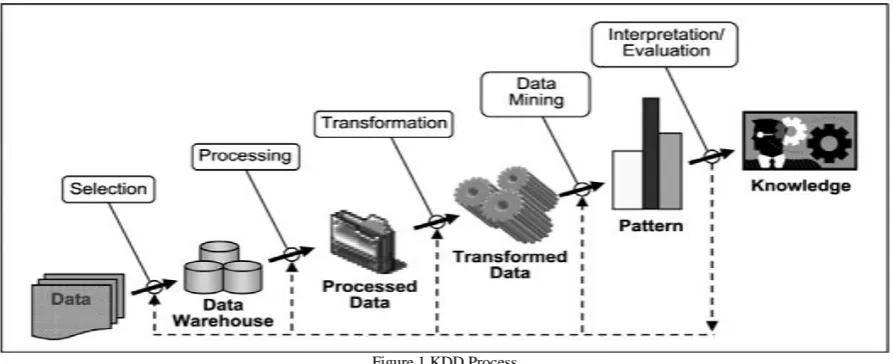
Data mining is one of the most important steps of KDD process. The KDD process consists of the process of selecting the relevant data, processing it and transforming the data into relevant information and extracting the hidden information from the data pre-processed. The KDD process is specified below:
Figure 1 KDD Process Fig 1shows the KDD process which consists of the following steps:
1. Selection:It is the process of selecting data relevant for the task of analysis from the database. 2. Pre-processing: It Removes noise and inconsistent data and combines multiple data sources. 3. Transformation:It transforms data into appropriate forms to perform data mining.
4. Data mining:It chooses a data mining algorithm which is appropriate in extracting patterns.
5. Interpretation/Evaluation: It interprets the patterns into knowledge by removing redundant or irrelevant data and translating the useful patterns into terms that is understandable by human [14].
1.2 Diabetes:
India is facing an epidemic of diabetes. At present, confirmed diabetes patients in India are 67 million, with another 30 million in pre-diabetes group. By 2030, India will have the largest number of patients in the world. Diabetes is not only a blood sugar problem, but brings along other complications as well," Diabetes is a particularly opportune disease for data mining technology for a number of reasons. First, the mountain of data is there. Second, diabetes is a common disease that costs a great deal of money, and so has attracted managers and players in the never ending quest for saving money and cost efficiency. Third, diabetes is a disease that can produce terrible complications of blindness, kidney failure, amputation, and premature cardiovascular death, so physicians and regulators would like to know how to improve outcomes as much as possible. Data mining might prove an ideal match in these circumstances, and there has been extensive work on diabetic registries for a variety of purposes. Databases have been used to query for diabetes, and to provide continuous quality improvement in diabetes care [9].
1.3 Application of data mining:
In this section, we have focused some of the applications of data mining in respective domains: 1. Data Mining Applications in Healthcare:
2. Data mining is used for market basket analysis:
Data mining technique is can be used in MBA (Market Basket Analysis).When the customer wants to buy some products, then this technique can help us to find out the associations between different items which the customer put in their shopping cart or baskets. Here the discovery of such associations can be identified which promotes the business techniques. The retailers use the data mining techniques to identify the customers buying pattern. This technique is used for profits of the business and also helps to identify the behavior of customers
3. Data mining is used as an emerging trend in the education system:
Data Mining helps to identify hidden patterns, associations, and anomalies from educational data and can improve decision making processes in higher educational systems. This improvement can bring advantages such as maximizing educational system efficiency, decreasing student's drop-out rate, and increasing student's promotion rate
4. Usage of Data mining in different areas of manufacturing Engineering:
When data is retrieved from manufacturing system it is used for different purposes like to find the errors in the data or product, to enhance the design methodology, to make the good quality product. The new methodology was proposed as CRISP-DM which will provides the high level detail steps of instructions for using the data mining in the engineering
5. The Intrusion Detection in the Network:
The intrusion detection in the Network is very difficult and needs a very close watch on the data traffic. The intrusion detection plays an essential role in computer security. The classification method of data mining is used to classify the network traffic either normal traffic or abnormal traffic. If any TCP header does not belong to any of the existing TCP header clusters, then it can be considered as anomaly
6. The Intelligence Agencies:
The Intelligence Agencies collect and analyses information to investigate terrorist activities. One of the challenges to law enforcement and intelligent agencies is the difficulty of analyzing large volume of data involved in criminal and terrorist activities. Now a day the intelligence agencies are using the sophisticated data mining algorithms which makes it easy, to handle the very large databases for organizations.
7. The Data Mining system implemented at the Internal Revenue Service:
The data mining system implemented at the Internal Revenue Service to identify high-income individuals engaged in abusive tax shelters show significantly good results. Data mining can be used to identify and rank possibly abusive tax avoidance transactions. To enhance the quality of product data mining techniques can be effectively used. The data mining technology SAS/EM is used to discover the rules those are unknown before and it can improve the quality of products and decrease the cost. A regression model and the neural network model can also be used for this purpose.
8. The Digital Library Retrieves:
The data mining application can be used in the field of the Digital Library where the user finds or collects, stores and preserves the data which are in the form of digital mode. The data and information are available in different formats. These formats include Text, Images, Video, Audio, Picture, Maps, etc.
9. Data Mining techniques in CRM:
Data mining technique is used in CRM .Now a days it is one of the hot topic to research in the industry because
CRM have attracted both the practitioners and academics. It aims to give a research summary on the application of data mining in the CRM domain and techniques which are most often used. Research on the application of data mining in CRM will increase significantly in the future based on past publication rates and the increasing interest in the area:
10. In language research and language engineering:
Sometimes linguistic information is needed about a text. A linguistic profile that contains large number of linguistic features can be generated from text file automatically using data mining. This technique found quite effective for authorship verification and recognition. The linguistic profiling of text effectively used to control the quality of language and for the automatic language verification. This method verifies automatically the text is of native quality.
11. InCredit Scoring:
Credit scoring has become very important issue due to the recent growth of the credit industry, so the credit department of the bank faces the huge numbers of consumers' credit data to process, but it is impossible to analyze huge amount of data both in economic and manpower terms. The support vector machine has been widely applied in recent years and which is one of the best technique. Since to improve the performance of this model, it is necessary a method for reduction the feature subset, many hybrid SVM based model are proposed. Many of these proposed models can only classify customers into two classes “good” or “bad” ones. The most used applied methods for doing credit scoring task are derived from classification technique. Generally classification is used when we predict something which is possible by using the previous available information. It is one type of methods which can be defined as classification where the members of a given set of instances into some groups where the different types of characteristics are to be made. Classification task is very suited to data mining methods and techniques.
12. Sports data mining:
what results come out, and then run it through a different algorithm to see if anything different stands out. In the sports world the vast amounts of statistics are collected for each player, team, game, and season. Data mining can be used for prediction of performance, selection of players, coaching and training and for the strategy planning. The data mining techniques are used to determine the best or the most optimal squad to represent a team in a team sport.
II.LITERATURESURVEY
A good number of researches have been reported in literature on diagnosis of diabetes. Padmaja et al., in their research aimed at finding out the characteristics that determine the presence of diabetes and to track the maximum number of women suffering from diabetes. They used Data mining functionalities like clustering and attribute oriented induction techniques to track the characteristics of the women suffering from diabetes. Information related to the study was obtained from National Institute of Diabetes, Digestive and Kidney Diseases.
Joseph L. Breault in his research work used the publicly available Pima Indian diabetic database (PIDD) at the UC Irvine Machine Learning Lab. They tested data mining algorithms to predict their accuracy in predicting diabetic status from the 8 variables given. Out of 392 complete cases, guessing all are non-diabetic gives an accuracy of 65.1%.
Samir Kumar Sarangi and Vivek Jaglan proposed the simple k-means clustering algorithm and this integration technique were applied on “Diabetes Diagnosis” data set. From our observation and analysis it was concluded that the integration of K-means (clustering) + J48 (classification) have zero MAE and RMSE error and it also takes less time to build the model. So the performance of K-means+J48 is better than other algorithms.
Classification accuracy achieved for Pima Indian diabetes dataset using 22 different classifiers is given in [12] and using 43 different classifiers is given in [7]. The performance of proposed cascaded model using k-means and Decision tree is compared with [11] and [7]. The accuracy of most of these classifiers is in the range of 66. 6% to 77.7%. Hybrid K-means and Decision tree [6] achieved the classification accuracy of 92.38% using 10 fold cross validations for continuous data. Further cascaded learning system based on Generalized Discriminate analysis (GDA) and Least Square Support Vector Machine (LS_SVM), showed accuracy of 82.05% for diagnosis of Pima dataset [12]. Further authors have achieved classification accuracy of 72.88 % using ANN, 78.21% using DT_ANN where decision tree C4.5 is used to identify relevant features and given as input to ANN, 79.50% using Cascaded GA_CFS_ANN, relevant feature identified by Genetic algorithm with Correlation based feature selection is given as input to ANN , 77.71% using GA optimized ANN, 84.10% using GA optimized ANN with relevant features identified by decision tree and 84.71% with GA optimized ANN with relevant features identified by GA_CFS[4]. Authors have achieved an accuracy of 96.68% for diabetic dataset using cascaded k-means and K-nearest neighbor [5].
III.DATASETUSED
A dataset (or data set) is a collection of data. Most commonly a dataset corresponds to the contents of a single database table, or a single statistical data matrix, where each column of the table represents a particular variable, and each row corresponds to a given member of the dataset in question. The dataset lists values for each of the variables, such as height and weight of an object, for each member of the dataset. Each value is known as a datum. The dataset may comprise data for one or more members.
The characteristics of the data set used in this research are summarized in following Table 1. The detailed descriptions of the data set are available at UCI repository [13]. The objective of this data set was diagnosis of diabetes of Pima Indians. Based on personal data, such as age, number of times pregnant, and the results of medical examinations, e.g., blood pressure, body mass index, result of glucose tolerance test, etc., it is tried to decide whether a Pima Indian individual was diabetes positive or not. Pima Indian Diabetes Data (PIDD) set is publicly available from the machine learning database at UCI. All patients represented in this data set are females with at least 21 years old of Pima Indian heritage living near Phoenix, Arizona. The problem posed here is to predict whether a person would test positive given a number of physiological measurements and medical test results. This is a two-class problem with class value 1 being interpreted as “tested positive for diabetes”. There are 500 examples of class 1 and 268 of class 2.
This data set is extracted from a larger database originally owned by the National Institute of Diabetes and Digestive and Kidney Diseases. The purpose of the study is to investigate the relationship between the diabetes diagnostic result and a list of variables that represent physiological measurements and medical attributes. The data set in the UCI repository contains 768 observations and 9 variables with no missing values reported. How- ever, as some researchers point out, there are a number of impossible values, such as 0 body mass index and 0 plasma glucose. Furthermore, one attribute (2-hour se- rum insulin) contains almost 50% impossible values. To keep the sample size reasonably large, this attribute is removed from analysis. There are 236 observations that have at least one impossible value of glucose, blood pressure, triceps skin thickness, and body mass index. There are nine variables, including the binary response variable, in this data set; all other attributes are numeric- valued. The attributes are given below:
1) Number of times pregnant
2) Plasma glucose concentration a 2 hours in an oral glucose tolerance test 3) Diastolic blood pressure (mm Hg)
6) Body mass index (weight in kg/(height in m)^2) 7) Diabetes pedigree function
8) Age (years)
9) Class variable (0 or 1)
Table 1 Characteristics of data sets
Data set No. of instances Input attributes Output classes Total attributes
Missing attributes
Pima Indians 768 8 1 9 No
IV.TOOLUSED
The Waikato Environment for Knowledge Analysis (WEKA) came about through the perceived need for a unified work bench that would allow researchers easy access to state-of the-art techniques in machine learning WEKA
Figure 2 WEKA Tool
(Waikato Environment for Knowledge Analysis) is one of the most powerful data mining software tool. It is graphical user interface tool written in Java, which aims to provide a comprehensive collection of machine learning algorithms and data pre-processing tools to researchers and practitioners for solving real world problems. The algorithms can either be applied directly to a dataset or called from your own Java code. WEKA would not only provide a toolbox of learning algorithms, but also a framework inside which researchers could implement new algorithms without having to be concerned with supporting infrastructure for data manipulation and scheme evaluation. WEKA contains tools for data preprocessing, classification, regression, clustering, association rules, and visualization. It is also well suited for developing new machine learning schemes. WEKA is developed by University of Waikato. This tool is freely available under General Public License. The data that is used for WEKA should be made into the ARFF (Attribute Relation file format) format and the file should have the extension ARFF (.arff).WEKA runs on almost any platform means. WEKA is platform independent.
V. EMPIRICALSTUDY
A. Filter:
The data in real world is highly susceptible to noise, missing and inconsistent data due to huge size and origin from heterogeneous sources. If there is much redundant or noisy data present then knowledge discovery will be more difficult. So, pre-processing of data is very important. Data processing in data mining includes cleaning, normalization, transformation, selection and feature extraction. The preprocess section allows filters to be defined that transform the data in various ways. The Filter box is used to set up the filters that are required. At the left of the Filter box is a Choose button. By clicking this button it is possible to select one of the filters in WEKA.
We apply filter on data set‟s attributes and filter the data set from dirty and redundant data present in data set. Filter can transform the data and make it possible to delete instances and attributes according to the specific criteria. Filters are basically of two types, they are, supervised filter and unsupervised filter. Both of these filters are further divided into two kinds of filters i.e. attribute and instance filter. Attribute filter are those in which we can add remove and transform all attributes and instance filters are those in which we can add, remove and transform all instances. In supervised filter, we have used „Stratified Remove Folds‟ and in unsupervised filter, we have used „Randomize‟, „Resample‟, „Sparse to Non-sparse‟, „Remove Folds‟. Pre-processing is needed to make the data more suitable for data mining.
B. Attribute Selection:
After applying filters on the data set, the attribute selection is done. Select attribute is a process by which you automatically search for the best subset of attribute in your dataset. Feature subset selection is of great importance in the field of data mining. The high dimension data makes testing and training of general classification methods difficult. The data set contains many attributes that may be irrelevant according to a particular attribute selection method. Methods used for data reduction can be classified into two types: Wrapper and filter method. Wrapper model approach uses the method of classification itself to measure the importance of features set, hence the feature selected depends on the classifier model used. Wrapper methods generally result in better performance than filter methods because the feature selection process is optimized for the classification algorithm to be used. However, wrapper methods are too expensive for large dimensional database in terms of computational complexity and time since each feature set considered must be evaluated with the classifier algorithm used. The filter approach actually precedes the actual classification process. The filter approach is independent of the learning algorithm, computationally simple fast and scalable. Using filter method, feature selection is done once and then can be provided as input to different classifiers. Various feature ranking and feature selection techniques have been proposed such as Correlation-based Feature Selection (CFS), Principal Component Analysis (PCA), Gain Ratio (GR) attribute evaluation, Chi-square Feature Evaluation etc. Attribute selection is done because:
It makes model simpler to make them easier to interpret. It makes faster model induction.
It reduces the training time.
It gives the knowledge i.e. knowledge about which attributes are important which may be inherently important to the application.
For PIDD (Pima Indians Diabetes Dataset) we have used three types of attribute evaluator are as follows:
1) Cfs Subset Evaluation: It evaluates the worth of subset of attributes by considering the individual predictive ability of each feature along with degree of redundancy between them. In this subsets of features that are highly correlated with the class while having low inter-correlations are preferred.
2) Principal Components: It performs principal component analysis and transformation of the data use in conjunction with rather search. Dimensionality reduction is accomplished by choosing enough eigenvectors to account for some percentage of variance in original data, by default value is 0.95.
3) Relief Attribute Evaluation: It evaluates worth of an attribute by repeatedly sampling an instance and considering the value of given attribute for nearest instance of the same and different classes. It can operate on both discrete and continuous class data.
When we have applied these attribute evaluators on filtered data sets, we get attributes in priority basis. From them, we will select top five attribute for each attribute evaluator method.
C. Classification:
example to one of a set of predefined classes is called clustering. It classifies data (constructs a model) based on the training set and the values (class labels) in a classifying attribute and uses it in classifying new data. Classification consists of assigning a class label to a set of unclassified cases. In SupervisedClassification, the set of possible classes is known in advance. In unsupervised Classification, set of possible classes is not known. Unsupervised classification is called clustering. Classification is a predictive task that involves building a model to predict a target, or dependent, variable from a set of explanatory, or independent, variables. For classification task the target variable usually has a small number of discrete values (e.g., “high” and “low”). In Classification, training examples are used to learn a model that can classify the data samples into known classes. The Classification process involves following steps:
a. Create training data set.
b. Identify class attribute and classes.
c. Identify useful attributes for classification (Relevance analysis). d. Learn a model using training examples in Training set.
e. Use the model to classify the unknown data.
The objective of classification is to analyze the input data and to develop an accurate description for each class using the features present in the data. We have used four types of classification techniques, „Decision tree‟, „Zero R‟, „Decision stump‟ and „K Star‟. On each of arff file, we apply these classify methods and find the result for each classification.
D. Evaluation Metrics:
After performing all the required procedure, we need to evaluate the results obtained. The result obtained is in terms of error rate, which all explained below:
1) Mean Absolute Error: Mean absolute error is the average of the difference between predicted and the actual value in all test cases; it is the average prediction error. The mean absolute error Ei of an individual program i is evaluated by the Equation (1): E i =1/n ∑ j=1n│Pij-Tj│
Where, Pij is the value predicted by the individual program i for sample case j (out of n sample cases); and Tj is the target
value for sample case j. For a perfect fit, Pij = Ti and Ei= 0. So, the Ei index ranges from 0 to infinity, with 0 corresponding to the idea
2) Relative Absolute Error: Relative Absolute Error is the total absolute error made relative to what the error would have been if the prediction simply had been the average of the actual values. Mathematically, the relative absolute error Ei of an individual program i is evaluated by the Equation (2): E i =∑ j=1
n│P
ij-Tj│/ ∑ j=1 n│T
j-T”j│
Where, Pij is the value predicted by the individual pro- gram i for sample case j (out of n sample cases); Tj is the
target value for sample case j; and Tis given by the formula (Equation (3): T”=1/n ∑ j=1n Tj
3) Mean Squared Error: Mean-squared error is one of the most commonly used measures of success for numeric prediction. This value is computed by taking the average of the squared differences between each computed value and its corresponding correct value. The squared error is simply the square root of the mean-squared-error. The mean-squared error gives the error value the same dimensionality as the actual and predicted values.
4) Root relative squared error: Relative squared error is the total squared error made relative to what the error would have been if the prediction had been the average of the absolute value. As with the root mean squared error, the square root of the relative squared error is taken to give it the same dimensions as the predicted values.
VI. RESULT
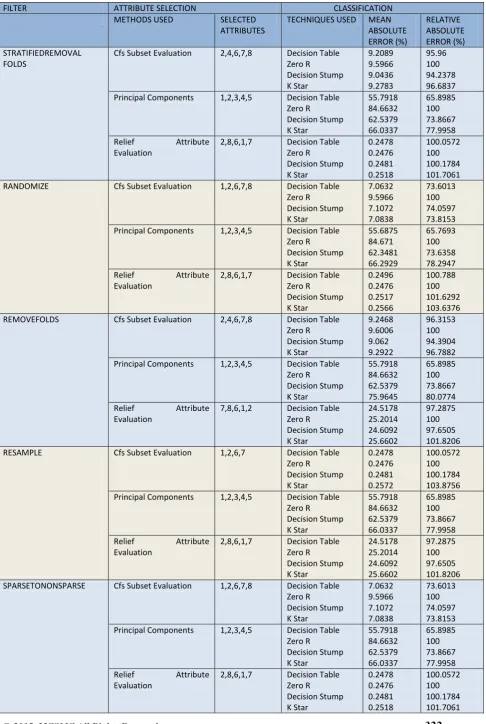
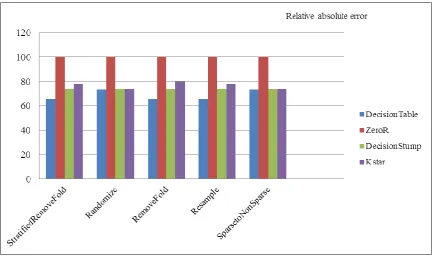
On applying all the five filter techniques and attribute selection methods on the dataset and then performing different classification techniques we get different error percentages for all the applied methods and techniques. The mean absolute error and relative absolute error are taken to check the performance overall. The result shows that according to relative absolute error, Stratified Remove Fold filter and Resample filter performed better than others in which cfs Subset Evaluation and Principal Component are used respectively. This means that, these two combination overall performed best. And according to the mean absolute error, Randomize and Sparse To Non-Sparse filter gives better results along with the attribute selection technique cfs Subset Evaluation.
TABLE 1: RESULT IN ERROR PERCENTAGE
FILTER ATTRIBUTE SELECTION CLASSIFICATION
METHODS USED SELECTED
ATTRIBUTES
TECHNIQUES USED MEAN
ABSOLUTE ERROR (%) RELATIVE ABSOLUTE ERROR (%) STRATIFIEDREMOVAL FOLDS
Cfs Subset Evaluation 2,4,6,7,8 Decision Table
Zero R Decision Stump K Star 9.2089 9.5966 9.0436 9.2783 95.96 100 94.2378 96.6837
Principal Components 1,2,3,4,5 Decision Table
Zero R Decision Stump K Star 55.7918 84.6632 62.5379 66.0337 65.8985 100 73.8667 77.9958
Relief Attribute
Evaluation
2,8,6,1,7 Decision Table
Zero R Decision Stump K Star 0.2478 0.2476 0.2481 0.2518 100.0572 100 100.1784 101.7061
RANDOMIZE Cfs Subset Evaluation 1,2,6,7,8 Decision Table
Zero R Decision Stump K Star 7.0632 9.5966 7.1072 7.0838 73.6013 100 74.0597 73.8153
Principal Components 1,2,3,4,5 Decision Table
Zero R Decision Stump K Star 55.6875 84.671 62.3481 66.2929 65.7693 100 73.6358 78.2947
Relief Attribute
Evaluation
2,8,6,1,7 Decision Table
Zero R Decision Stump K Star 0.2496 0.2476 0.2517 0.2566 100.788 100 101.6292 103.6376
REMOVEFOLDS Cfs Subset Evaluation 2,4,6,7,8 Decision Table
Zero R Decision Stump K Star 9.2468 9.6006 9.062 9.2922 96.3153 100 94.3904 96.7882
Principal Components 1,2,3,4,5 Decision Table
Zero R Decision Stump K Star 55.7918 84.6632 62.5379 75.9645 65.8985 100 73.8667 80.0774
Relief Attribute
Evaluation
7,8,6,1,2 Decision Table
Zero R Decision Stump K Star 24.5178 25.2014 24.6092 25.6602 97.2875 100 97.6505 101.8206
RESAMPLE Cfs Subset Evaluation 1,2,6,7 Decision Table
Zero R Decision Stump K Star 0.2478 0.2476 0.2481 0.2572 100.0572 100 100.1784 103.8756
Principal Components 1,2,3,4,5 Decision Table
Zero R Decision Stump K Star 55.7918 84.6632 62.5379 66.0337 65.8985 100 73.8667 77.9958
Relief Attribute
Evaluation
2,8,6,1,7 Decision Table
Zero R Decision Stump K Star 24.5178 25.2014 24.6092 25.6602 97.2875 100 97.6505 101.8206
SPARSETONONSPARSE Cfs Subset Evaluation 1,2,6,7,8 Decision Table
Zero R Decision Stump K Star 7.0632 9.5966 7.1072 7.0838 73.6013 100 74.0597 73.8153
Principal Components 1,2,3,4,5 Decision Table
Zero R Decision Stump K Star 55.7918 84.6632 62.5379 66.0337 65.8985 100 73.8667 77.9958
Relief Attribute
Evaluation
2,8,6,1,7 Decision Table
Figure 3 Relative Absolute Errors
0 10 20 30 40 50 60 70 80 90
M ean absolute error
DecisionTable
ZeroR
DecisionStump
Kstar
Figure 4 Mean Absolute Errors
VII. CONCLUSION
tree, 100% by Zero R 94.23% by Decision stump and 96.68% by using K Star classification. And on the basis of mean absolute error, Randomize and Sparse To Non-Sparse outperformed other three, and they both perform equally well. The value of mean absolute error under these two are 7.06% by using decision table, 9.59% by using Zero R, 7.10% by decision Stump and 7.0838% by using K Star classification.
Acknowledgement
Our thanks to IJCSMC for allowing us to modify templates they had developed. Also I take this opportunity to express my special gratitude to my supervisor Mrs. Pooja Mittal generously making herself available for her most valuable guidance, encouragement. It would get not be possible for me to make this paper without her guidance.
REFERENCES
[1] Abdullah A. Aljumah, Mohammed Gulam Ahamad, Mohammad Khubeb Siddiqui ," Application of data mining: Diabetes health care in young and old patients" , 2012
[2] Asha Gowda Karegowda, MA.Jayaram, Integrating Decision Tree and ANN for Categorization of Diabetics Data, International Conference on Computer Aided Engineering, December 13-15, IIT Madras, Chennai, India (2007).
[3] Asha Gowda Karegowda and M.A. Jayaram, Cascading GA & CFS for Feature Subset Selection in Medical Data Mining , International Conference on IEEE International Advance Computing Conference (IACC‟09), Thapar University, Patiala, Punjab India (Mar 2009).
[4] Asha Gowda Karegowda, A.S. Manjunath, M.A. Jayaram Application Of Genetic Algorithm Optimized Neural Network Connection Weights For Medical Diagnosis Of Pima Indians Diabetes, International Journal on Soft Computing (IJSC), Vol.2, No.2.( May 2011).
[5] Asha Gowda Karegowda , M.A. Jayaram, A.S. Manjunath ,Cascading K-means Clustering and K-Nearest Neighbor Classifier for Categorization of Diabetic Patients , International Journal of Engineering and Advanced Technology (IJEAT) ISSN: 2249 – 8958, Volume-1, Iss
[6] B.M Patil, R.C Joshi, Durga Tosniwal, Hybrid Prediction model for Type-2 Diabetic Patients, Expert System with Applications, 37, 8102-8108 (2010).
[7] Humar, K., & Novruz, A. Design of a hybrid system for the diabetes and heart diseases. Expert Systems with Applications, 35, 82–89 ,(2008).
[8] Hian Chye Koh ,Gerald Tan," Data Mining Applications in Healthcare.
[9] J. Han And M. Kamber, Data Mining: Concepts and Techniques. San Francisco, Morgan Kauffm ANN Publishers(2001).
[10] Joseph L. Breault, MD, MPH, MS, "Data Mining Diabetic Databases: Are Rough Sets a Useful Addition? ", http://citeseerx.ist.psu.edu/viewdoc/download?doi=10.1.1.91.815&rep=rep1&type=pdf
[11] Jyoti Soni, Ujma Ansari, Dipesh Sharma, Sunita Soni ," Predictive Data Mining for Medical Diagnosis: An Overview of Heart Disease Prediction", 2011, http://citeseerx.ist.psu.edu/viewdoc/ download?rep=rep1 &type=pdf&doi=10.1.1.206.3899
[12] Michie, D., Spiegelhalter, D. J., & Taylor, C. C., Machine learning, neural and statistical classification. Ellis Horwood .
[13] Polat, K., Gunes, S., & Aslan, A., A cascade learning system for classification of diabetes disease: Generalized discriminant analysis and least square support vector machine. Expert Systems with Applications, 34(1), 214– 221(2008).
[14] UCI Machine Learning Repository. http://www.ics.uci.edu/mlearn/MLRepository.html