_____________________________________________________________________________________________________ *Corresponding author: E-mail: [email protected];
www.sciencedomain.org
The Interaction of Stroke Risk Factors,
Clinical Outcomes and Matrix Metalloproteinase 9
Levels with the Reduction of Vascular Endothelial
Growth Factor A Levels at the Incidence of Brain
Edema in Acute Ischemic Stroke Patients
Ismail Setyopranoto
1*, Samekto Wibowo
1, Ahmad Hamim Sadewa
2and Rusdi Lamsudin
11
Department of Neurology, Faculty of Medicine, Gadjah Mada University and Dr. Sardjito General Hospital, Yogyakarta, Indonesia. 2
Department of Biochemistry, Faculty of Medicine, Gadjah Mada University, Yogyakarta, Indonesia.
Authors’ contributions
This work was carried out in collaboration between all authors. Author IS designed the study, wrote the protocol, conducted the study and wrote the first draft of the manuscript. Authors SW, AHS and RL helped in designing the study and in manuscript preparation. All authors read and approved the final manuscript.
Article Information
DOI: 10.9734/BJMMR/2016/21669 Editor(s): (1) Chan Shen, Department of Biostatistics, MD Anderson Cancer Center,
University of Texas, USA. Reviewers: (1) Antonio Díaz Negrillo, Infanta Elena Hospital, Madrid, Spain. (2)Xing Li, Mayo Clinic College of Medicine, USA. Complete Peer review History:http://sciencedomain.org/review-history/12012
Received 28th August 2015 Accepted 15th October 2015 Published 29th October 2015
ABSTRACT
Aims: To study the interaction between the reduction of vascular endothelial growth factor
A/VEGF-A level with other variables at the incidence of brain edema in acute ischemic stroke patients.
Study Design: A prospective observational analytic case-control study.
Place and Duration of Study: Stroke Unit at the Dr. Sardjito General Hospital, Yogyakarta,
Indonesia, between December 2010 and August 2011.
subjects in the brain edema group and 34 subjects in the non-brain edema group. Clinical characteristics of each subject were recorded and blood levels of VEGF-A and matrix metalloproteinase 9/MMP-9 were measured. Logistic regression analyses were performed to discover any potential independent variable that can influence the VEGF-A role at the incidence of brain edema.
Results: Multivariate analyses revealed that several variables were significantly interacted with the
reduction of VEGF-A levels at the incidence of brain edema. These variables were the lipid profiles (model “D”; OR=4.26; 95%CI: 1.28-14.15), stroke risk factors (model “G”; OR=4.78; 95%CI: 1.38-16.56), MMP-9 (model “I”; OR=5.59; 95%CI: 1.58-19.78), and Gadjah Mada Stroke Scale/GMSS score (model “K”; OR=5.29; 95%CI: 1.47-19.08). Subsequent multivariate analysis by combining the model “D”, “G”, “I” and “K” resulted in a very elevated odds ratio (OR=16.72; 95%CI: 2.75-101.5).
Conclusion: The influence of VEGF-A reduction at the incidence of brain edema would be strongly
enhanced by considering the combination of several independent variables, including the lipid profile, history of previous stroke risk factors, MMP-9 levels and GMSS score.
Keywords: Acute ischemic stroke; VEGF-A; risk factors; MMP-9; brain edema.
1. INTRODUCTION
Mechanism of stroke is very intricate, in which it is a combined destruction of neurovascular units including endothelial cells, vascular smooth muscle cells, astroglia, microglia, neuron and tissue matrix protein [1]. During the inflammation phase of ischemic stroke, angiogenesis is activated through the secretion of polypeptide growth factor and cytokines released by infiltrating macrophages at early stage; in the subsequent phase, leukocytes and platelets are damaged [2].
Angiogenesis is a mechanism to create new blood vessels in order to maintain functionality of tissues. Vascular endothelial growth factor (VEGF) and its receptors are components of the intricate mechanism during angiogenesis because they serve as angiogenic stimulator, inhibitor and modulator. The family of VEGF isoforms comprises of A, B, VEGF-C, VEGF-D, VEGF-E, VEGF-F and placental growth factor (PIGF) [3]. During ischemic stroke, VEGF-A serves a bigger role than other VEGF isoforms because VEGF-A can influence the cell migration, organize the blood vessels, differentiate the endothelial cells and remodel the primary capillary vasculature [4].
As a factor that can also influence the vascular permeability, VEGF-A may exert a negative impact because it can disrupt blood-brain barrier, resulting in brain edema [5]. Brain edema within ischemic stroke cases can be classified into 2 types, i.e., cytotoxic and vasogenic edema. Cytotoxic edema occurs to the loss of energy supply and anoxic membrane depolarization, resulting in the intracellular accumulation of Na+
that further attracts water and causes cell swelling. The main cause of vasogenic edema is the disruption in blood-brain barrier that increases the permeability, causing displacement of protein and intravascular ions into the extracellular compartment [6].
The contribution of VEGF-A to the incidence of brain edema in acute ischemic stroke patients may be influenced by several stroke risk factors. For example, the early stage of glomerulopathy in diabetic patients is characterized by proteinuria, followed by the up-regulation of VEGF-A expression by podocytes and mesangial cells. In type 2 diabetic patient, the up-regulation of VEGF-A expression in glomerulus is correlated with a higher level of urinary VEGF-A and is linked with the increasing numbers of glomeruli endothelial cells and the creation of new blood vessels [7].
VEGF-A-induced angiogenesis and thereafter may prevent the occurrence of hypertension in young pre-hypertensive subject and may normalize the blood pressure in adult subject with established hypertension [9].
Via an interaction with the VEGF receptor, VEGF may induce vasodilatation and vascular hypotension. In contrast, the disruption of VEGF signaling may cause hypertension. Indeed, the increasing incidence of hypertension was observed during the administration of cediranib or inhibitors of VEGF signaling, e.g., sorafenib, sunitinib, vatalanib, axitinib and bevacizumab [10]. During atherosclerosis, endothelial dysfunction causes chronic inflammation, resulting in the formation of plaque; these succession of events are encountered as well in the pathogenesis of ischemic stroke [11]. Pro-inflammatory cytokines also serve important roles in the atherogenesis and plaque rupture [12]. In addition, IL-10 and IL-13 cytokines could suppressed the VEGF production [13].
Matrix metalloproteinase (MMP) can increase the permeability of the blood-brain barrier in response to hypoxic-ischemic injury, multiple sclerosis, or infection [14]. MMP increases the permeability of the blood brain barrier by invading the extracellular matrix, basal lamina and tight junctions of endothelial cells, resulting in cytotoxic and vasogenic edema [15]. Expression of two MMP types, namely MMP-9 and MMP-2 increased after cerebral ischemia, leading to the opening of the blood brain barrier [16]. Level of MMP-9 in plasma is associated with size of infarction area [17].
MMP-9 also mediates the occurrence of edema caused by hypoxia through a mechanism involving VEGF [18]. Extracellular matrix contains cryptic information that led to proteolysis, and also acts as a reservoir of latent growth factors and cytokines. The release and activation of growth factor dependent on proteolysis. VEGF and TGF-β are growth factors stored in the extracellular matrix and can be released during proteolysis by MMP. MMP-9 and other MMPs are important in mobilizing VEGF from the extracellular matrix [19].
Hypoalbuminemia is linked to the endothelial defects in causes of death among patients with chronic kidney or cardiovascular disease.Since low levels of sera albumin are commonly encountered in geriatric subjects and since most of stroke patients are geriatric subjects, it was
reported that hypoalbuminemia occurred in approximately 45% of acute ischemic stroke patients [20]. Hypoalbuminemia is commonly associated with the severity of stroke. Stroke patients due to cardioembolic etiology appeared to have lower albumin levels and higher mortality risks as compared to the non-cardioembolic stroke patients. Furthermore, the reduction in albumin concentration may indicate a chronic systemic inflammation, which contributes to the bad prognosis in ischemic stroke patients [20,21]. It is worthy to mention a study reporting that albumin significantly reduced VEGF expression during hypoxia through the suppression on the hypoxia-inducible factor/hypoxia-responsive element pathway [22].
Here, we reported a prospective observational analytic case-control study on hospitalized acute ischemic stroke patients in Yogyakarta, Indonesia. The aim of this study is to elucidate the interaction between stroke risk factors, clinical outcomes of stroke and MMP-9 levels with the reduction of VEGF-A levels in acute ischemic stroke patients with brain edema.
2. MATERIALS AND METHODS
This study was a prospective observational analytic study using the case-control design. This study was approved by the ethical committee of the Faculty of Medicine, Gadjah Mada University, Yogyakarta, Indonesia. The inclusion criteria for the case were: 1) both male and female acute ischemic stroke patients between the age of 50 and 70 years old who started to exhibit symptoms maximum for 6 days before the admission into the Dr. Sardjito General Hospital; 2) patients suffered from neurologic deficits, either reduced consciousness, hemiparesis, paralysis of cranial nerve VII and/or XII, dysarthria and aphasia, or hemianopia; and 3) patients exhibited brain edema and ischemic stroke verified by the cranial CT scan. The control group itself comprised of acute ischemic stroke patients without brain edema verified by the cranial CT scan. The exclusion criteria for both the case (‘brain edema’) and control (‘non-brain edema’) groups were: 1) patients suffered from hemorrhagic stroke, including transformation hemorrhagic or space-occupying lesion due to other causes; and 2) patients who did not complete the research procedure, such as discharged against medical advice.
predict the risk of brain edema in patients with acute ischemic stroke, odds ratio of 2.5 was determined. By using confidence level of 90%, the Schlesselman sample size calculation [24] for each group (with and without brain edema) was 32, thus the minimum total samples were 64 subjects. The assessed independent variables were age, gender, VEGF-A and MMP-9 levels in blood, history of hypertension, history of diabetes mellitus, history of hypercholesterolemia, history of heart disease, blood pressure at the admission time, fasting blood glucose level, albumin level and smoking. The dependent variable was brain edema in acute ischemic stroke patient that was verified by the cranial CT scan.
The evaluation of clinical outcomes was based on the Gadjah Mada Stroke Scale (GMSS). GMSS is a modified version of the National Institute of Health Stroke Scale (NIHSS). GMSS is designed to serve as a clinical measurement tool in order to evaluate and to monitor the neurologic status of stroke patients. There are 14 variables in GMSS: (a) level of consciousness; (b) orientation; (c) speech; (d) eye movement; (e) facial movement; (f) visual field; (g) passive arm strength; (h) active arm strength; (i) wrist extension; (j) finger strength; (k) passive leg strength; (l) active leg strength; (m) foot dorsiflexion; and (n) fast walking. The range value of GMSS is between 0 (the lowest score) and 38 (the highest score). The GMSS has been tested for its validity and reliability, in which it yields a Kappa coefficient between 0.85-1. The GMSS threshold is set at 23: score more than 23 indicates mild to moderate neurologic deficits, while the one less than 23 refers to severe neurologic deficits [25].
Subjects were recruited via the consecutive sampling method until the targeted sample size was obtained. Identities and clinical characteristics of consented subjects were recorded in a designated case form and subsequently were monitored based on their hospital medical records. This study was conducted in the Stroke Unit of the Dr. Sardjito General Hospital for duration of 12 months.
Following 24-hour hospitalization of the subjects, venous blood samples of 20 mL were collected after a minimum 12-hour fasting period. The blood was collected in the EDTA-containing tube and subsequently aliquoted into 2 tubes with each volume of 10 mL. While the first tube was sent to the Prodia Biomolecular Laboratory at Jakarta, Indonesia for measuring VEGF-A and
MMP-9, the second tube was sent to the clinical pathology laboratory at the Dr. Sardjito General Hospital for assessing fasting blood glucose, creatinine, ureum, lipid profile and albumin. The VEGF-A and MMP-9 levels were measured with the quantitative technique of the sandwich enzyme immunoassay (Bio-Rad Laboratories, Inc., USA).
Comparative analysis was conducted on acute ischemic stroke subjects, with and without brain edema, with respect to the VEGF-A levels. Chi-square and t-tests were performed due to the presence of categorical and continual data in this study. Basic demographic data for both groups, primarily for categorical variable such as gender, were analyzed using the chi-square test. Logistic regression analysis was done to discover potentially significant independent factors on the VEGF-A contribution to the incidence of brain edema. The significant level of 0.05 or the confidence level of 90% (P=0.05) was chosen. Statistical analyses were done by using the STATA software version 9 (StataCorp LP, USA).
3. RESULTS AND DISCUSSION
This study was conducted from December 2010 until August 2011 with initial total subjects were 74, comprising 37 and 37 patients in the brain edema and non-brain edema group, respectively. However, there were 3 subjects in the latter group who did not have complete data, hence were excluded. Thus, the subsequent comparison was performed on total 71 subjects.
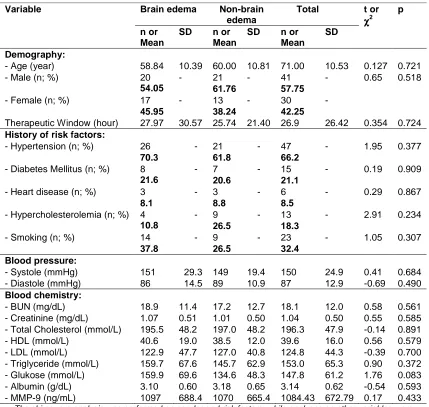
edema group was longer than the one within the non-brain edema group (27.97 and 25.74 hours, respectively). However, the difference was not statistically significant (p=0.724).
Within the category of history of risk factors, hypertension was the highest risk factor for both groups (70.3% in the brain edema group and 61.8% in the non-brain edema group). The second highest risk factor for the brain edema group was smoking (37.8%), while the second highest one for the non-brain edema group was smoking and hypercholesterolemia (26.5% each). The third highest risk factor for the brain and non-brain edema groups was diabetes mellitus (21.6% and 20.6%, respectively). Hypercholesterolemia was found in 10.8% of subjects within the brain edema group. Heart disease was suffered by 8.1% and 8.8% of subjects in the brain and non-brain edema groups, respectively. It is important to mention that there was no significant difference among those variables between both groups. For the blood pressure variable, the brain edema group exhibited a higher systolic pressure in average, although it is not statistically different (p=0.684), as compared to the non-brain edema group (151 and 149 mmHg, respectively). In contrast, the non-brain edema group expressed a higher diastolic pressure in average (89 mmHg) than the one in the non-brain edema group (86 mmHg). Similarly, the difference was not statistically significant (p=0.490).
Within the category of blood chemistry, the brain edema group had higher mean values for BUN and creatinine (18.9 and 1.07 mg/dL, respectively) as compared to the non-brain edema group (17.2 and 1.01 mg/dL, respectively). However, these differences were not statistically significant (p=0.561 dan p=0.585, respectively). Next, the non-brain edema group displayed a higher mean value for total cholesterol (197 mmol/L) than the one in the brain edema group (195.5 mmol/L), but it was not statistically different (p=0.891). The brain edema group had a lower mean value for HDL, but not significantly different (p=0.579), as compared to
the non-brain edema group (40.6 and 38.5 mmol/L). In line with this finding, mean
value of LDL was lower in the brain edema group than in the non-brain edema group (122.9 and 128 mmol/L, respectively). Similarly, this was not statistically different (p=0.700). For the triglyceride variable, despite it was not statistically different (p=0.372), the brain edema group had a higher mean value than the one in
the non-brain edema group (159.7 and 145.7 mmol/L). The brain edema group also
exhibited a higher mean value than the one in
the non-brain edema group (159.9 and 134.6 mmol/L), but it was not significantly
different (p=0.083). For the albumin variable, the difference was small and not significantly different (p=0.593) between the brain edema and the non-brain edema groups (3.10 and 3.18 g/dL). Lastly, the average value of MMP-9 was higher in the brain edema group (1097 ng/mL) than the one in the non-brain edema group (1070 ng/mL), but not statistically different.
In summary for Table 1, we did not obtain any statistical difference (p>0.05) across all tested variables between both groups. This was an important finding since the subsequent statistical analysis could only be performed if the general characteristics of subjects between the brain edema and non-brain edema groups were not significantly different (‘homogenous’). We therefore assumed subjects between both groups were homogenous and performed the subsequent comparative analyses.
Next, Table 2 describes that a lower GMSS average score was observed in the brain edema group (24.70) than in the non-brain edema group (28.82). Importantly, this difference was statistically significant (p=0.045). As previously described by Lamsudin, stroke patients with smaller GMSS scores suffered from more severe neurologic deficits [18]. Therefore, our finding was in accordance with previous studies reporting that neurologic deterioration in stroke patients was correlated with the severity of brain edema [26,27].
In the Table 3, characteristics of VEGF-A influences on variable of blood pressure, BUN, creatinine, total cholesterol, triglyceride, LDL, HDL, glucose, albumin and MMP-9 as well of the history of risk factors (hypertension, diabetes mellitus, heart disease, hypercholesterolemia and smoking) between both groups were shown.
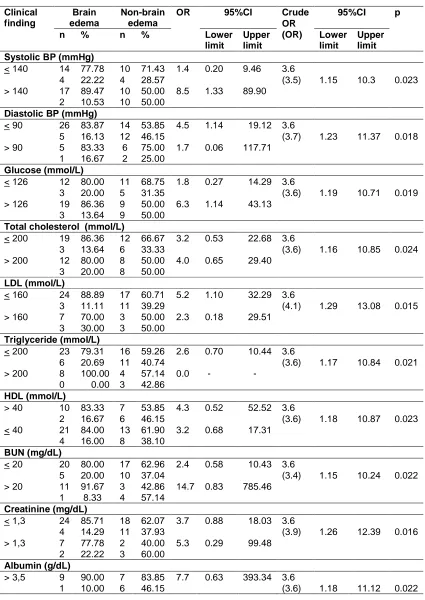
crude OR was greater than the OR (3.6 versus 3.5). Indeed, this confounding effect was statistically different (95%CI: 1.15-10.3; p=0.023). Next, pertaining to the influence of VEGF-A to the incidence of brain edema with reference to the role of diastolic blood pressure, the influence was greater, but not statistically different, at the level of diastole <90 mmHg
(OR=4.46) than at the level >90 mmHg (OR=1.67). Interestingly, the subsequent chi-square analysis suggested that the diastolic blood pressure was an interacting factor to the correlation between VEGF-A and brain edema since the OR was statistically greater than the crude OR (3.7 versus 3.6; 95%CI: 1.23-11.37; p=0.018).
Table 1. Basic characteristics of subjects within the brain and non-brain edema groups
Variable Brain edema Non-brain edema
Total t or χχχχ2
p
n or Mean
SD n or Mean
SD n or Mean
SD
Demography:
- Age (year) 58.84 10.39 60.00 10.81 71.00 10.53 0.127 0.721
- Male (n; %) 20
54.05
- 21
61.76
- 41
57.75
- 0.65 0.518
- Female (n; %) 17
45.95
- 13
38.24
- 30
42.25
-
Therapeutic Window (hour) 27.97 30.57 25.74 21.40 26.9 26.42 0.354 0.724
History of risk factors:
- Hypertension (n; %) 26
70.3
- 21
61.8
- 47
66.2
- 1.95 0.377
- Diabetes Mellitus (n; %) 8
21.6
- 7
20.6
- 15
21.1
- 0.19 0.909
- Heart disease (n; %) 3
8.1
- 3
8.8
- 6
8.5
- 0.29 0.867
- Hypercholesterolemia (n; %) 4
10.8
- 9
26.5
- 13
18.3
- 2.91 0.234
- Smoking (n; %) 14
37.8
- 9
26.5
- 23
32.4
- 1.05 0.307
Blood pressure:
- Systole (mmHg) 151 29.3 149 19.4 150 24.9 0.41 0.684
- Diastole (mmHg) 86 14.5 89 10.9 87 12.9 -0.69 0.490
Blood chemistry:
- BUN (mg/dL) 18.9 11.4 17.2 12.7 18.1 12.0 0.58 0.561
- Creatinine (mg/dL) 1.07 0.51 1.01 0.50 1.04 0.50 0.55 0.585
- Total Cholesterol (mmol/L) 195.5 48.2 197.0 48.2 196.3 47.9 -0.14 0.891
- HDL (mmol/L) 40.6 19.0 38.5 12.0 39.6 16.0 0.56 0.579
- LDL (mmol/L) 122.9 47.7 127.0 40.8 124.8 44.3 -0.39 0.700
- Triglyceride (mmol/L) 159.7 67.6 145.7 62.9 153.0 65.3 0.90 0.372
- Glukose (mmol/L) 159.9 69.6 134.6 48.3 147.8 61.2 1.76 0.083
- Albumin (g/dL) 3.10 0.60 3.18 0.65 3.14 0.62 -0.54 0.593
- MMP-9 (ng/mL) 1097 688.4 1070 665.4 1084.43 672.79 0.17 0.433 The chi-square analysis was performed on gender and risk factors, while analyses on other variables were
performed using the t-test
Table 2. The difference in GMSS scores between the brain and non-brain edema groups
Variable Brain edema Non-brain edema Total T p Mean SD Mean SD Mean SD
Table 3. Bivariate stratification analysis of clinical and laboratory parameters on VEGF-A influence within the brain non-brain edema groups
Clinical finding
Brain edema
Non-brain edema
OR 95%CI Crude OR (OR)
95%CI p
n % n % Lower
limit
Upper limit
Lower limit
Upper limit Systolic BP (mmHg)
< 140 14 77.78 10 71.43 1.4 0.20 9.46 3.6
4 22.22 4 28.57 (3.5) 1.15 10.3 0.023
> 140 17 89.47 10 50.00 8.5 1.33 89.90 2 10.53 10 50.00
Diastolic BP (mmHg)
< 90 26 83.87 14 53.85 4.5 1.14 19.12 3.6
5 16.13 12 46.15 (3.7) 1.23 11.37 0.018
> 90 5 83.33 6 75.00 1.7 0.06 117.71 1 16.67 2 25.00
Glucose (mmol/L)
< 126 12 80.00 11 68.75 1.8 0.27 14.29 3.6
3 20.00 5 31.35 (3.6) 1.19 10.71 0.019
> 126 19 86.36 9 50.00 6.3 1.14 43.13 3 13.64 9 50.00
Total cholesterol (mmol/L)
< 200 19 86.36 12 66.67 3.2 0.53 22.68 3.6
3 13.64 6 33.33 (3.6) 1.16 10.85 0.024
> 200 12 80.00 8 50.00 4.0 0.65 29.40 3 20.00 8 50.00
LDL (mmol/L)
< 160 24 88.89 17 60.71 5.2 1.10 32.29 3.6
3 11.11 11 39.29 (4.1) 1.29 13.08 0.015
> 160 7 70.00 3 50.00 2.3 0.18 29.51 3 30.00 3 50.00
Triglyceride (mmol/L)
< 200 23 79.31 16 59.26 2.6 0.70 10.44 3.6
6 20.69 11 40.74 (3.6) 1.17 10.84 0.021
> 200 8 100.00 4 57.14 0.0 - - 0 0.00 3 42.86
HDL (mmol/L)
> 40 10 83.33 7 53.85 4.3 0.52 52.52 3.6
2 16.67 6 46.15 (3.6) 1.18 10.87 0.023
< 40 21 84.00 13 61.90 3.2 0.68 17.31 4 16.00 8 38.10
BUN (mg/dL)
< 20 20 80.00 17 62.96 2.4 0.58 10.43 3.6
5 20.00 10 37.04 (3.4) 1.15 10.24 0.022
> 20 11 91.67 3 42.86 14.7 0.83 785.46 1 8.33 4 57.14
Creatinine (mg/dL)
< 1,3 24 85.71 18 62.07 3.7 0.88 18.03 3.6
4 14.29 11 37.93 (3.9) 1.26 12.39 0.016
> 1,3 7 77.78 2 40.00 5.3 0.29 99.48 2 22.22 3 60.00
Albumin (g/dL)
> 3,5 9 90.00 7 83.85 7.7 0.63 393.34 3.6
Clinical finding
Brain edema
Non-brain edema
OR 95%CI Crude OR (OR)
95%CI p
n % n % Lower
limit
Upper limit
Lower limit
Upper limit
< 3,5 22 81.48 13 61.90 2.7 0.61 12.70 5 18.52 8 38.10
MMP-9 (ng/mL)
< 1054 16 84.21 18 78.26 1.5 0.24 10.98 3.6
3 15.79 5 21.74 (4.4) 1.40 13.76 0.006
> 1054 15 83.33 2 18.18 22.5 2.43 274.88 3 16.67 9 81.82
Therapeutic window (hour)
< 12 13 81.25 10 76.92 1.3 0.14 11.82 3.6
3 18.75 3 23.08 (3.5) 1.16 10.39 0.023
> 12 18 85.71 10 47.62 6.6 1.26 43.48 3 14.29 11 52.38
GMSS score
< 23 13 81.25 1 20.00 17.3 0.99 916.46 3.6
3 18.75 4 80.00 (4.7) 1.38 16.24 0.008
> 23 18 85.71 19 65.52 3.2 0.65 20.29 3 14.29 10 34.48
OR refers to odds ratio of exposure after considering influences of other variables. BP, blood pressure
For the role of blood glucose within the interaction of VEGF-A to the incidence of brain edema, Table 3 shows that the influence was greater, but not statistically different, at the level of glucose >126 mmol/L (OR=6.33) than at the level <126 mmol/L (OR=1.82). The subsequent chi-square analysis suggested that the blood glucose level was a significant confounding factor to the correlation between VEGF-A and brain edema since the OR was equal to the crude OR (3.6 versus 3.6; 95%CI: 1.19-10.71; p=0.019). Pertaining to the role of LDL within the interaction of VEGF-A to the incidence of brain edema, Table 3 shows that the influence was greater, but not statistically different, at the level of LDL <160 mmol/L (OR=5.18) than at the level >160 mmol/L (OR=2.3). The subsequent chi-square analysis revealed that the LDL level was a significant interacting factor to the correlation between VEGF-A and brain edema since the OR was greater than the crude OR (4.1 versus 3.6; 95%CI: 1.29-13.08; p=0.015). This finding was in contrast to the roles of total cholesterol, HDL and triglyceride, in which the analysis indicated the latter three variables most likely served as the confounding factors.
Pertaining to the influence of VEGF-A to the incidence of brain edema with reference to the role of BUN, the influence was greater, but not statistically different, at the level of BUN >20 mg/dL (OR=14.7) than at the level <20 mg/dL (OR=2.35). The subsequent chi-square analysis
revealed that the BUN level was a significant confounding factor to the correlation between VEGF-A and brain edema (95%CI: 1.15-10.24 dan p=0.022). For the role of creatinine within the interaction of VEGF-A to the incidence of brain edema, Table 3 shows that the influence was greater, but not statistically different, at the level of creatinine >1.3 mg/L (OR=5.25) than at the level <1.3 mg/L (OR=3.67). The subsequent chi-square analysis suggested that the creatinine level was a significant interacting factor to the correlation between VEGF-A and brain edema since the OR was greater than the crude OR (3.9 versus 3.6; 95%CI: 1.26-12.39; p=0.016). Pertaining to the influence of VEGF-A to the incidence of brain edema with reference to the role of albumin, the influence was greater, but not statistically different, at the level of albumin >3.5 g/dL (OR=7.71) than at the level <3.5 g/dL (OR=2.70). The subsequent chi-square analysis revealed that the albumin level was a significant confounding factor to the correlation between VEGF-A and brain edema (3.6 versus 3.6; 95%CI: 1.18-11.12 dan p=0.022).
VEGF-A and brain edema since the OR was greater than the crude OR (4.4 versus 3.6; 95%CI: 1.40-13.76; p=0.006). Pertaining to the influence of VEGF-A to the incidence of brain edema with reference to the role of therapeutic window, the influence was greater, but not statistically different, at the level of therapeutic window >12 hours (OR=6.6) than at the level <12 hours (OR=1.3). The subsequent chi-square analysis suggested that the therapeutic window was a significant confounding factor to the correlation between VEGF-A and brain edema since the OR was smaller than the crude OR (3.5 versus 3.6; 95%CI: 1.16-10.39; p=0.023). Lastly, for the role of GMSS score within the interaction of VEGF-A to the incidence of brain edema, Table 3 shows that the influence was greater, but not statistically different, at the level of GMSS score<23 (OR=17.3) than at the level >23 (OR=3.16). The subsequent chi-square analysis suggested that the GMSS score was a significant interacting factor to the correlation between VEGF-A and brain edema since the OR was greater than the crude OR (4.4 versus 3.6; 95%CI: 1.38-16.24; p=0.008).
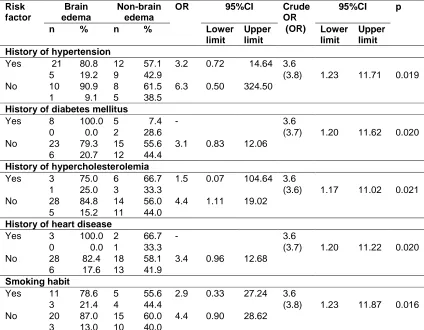
Table 4 describes the bivariate stratification analysis of risk factors on the VEGF-A influence within the brain and non-brain edema groups. For the role of hypertension within the interaction of VEGF-A to the incidence of brain edema, the influence was greater, but not statistically different, at the level of no history (OR=6.3) than of history exists (OR=3.2). The subsequent chi-square analysis suggested that the history of hypertension was a significant interacting factor to the correlation between VEGF-A and brain edema since the OR was greater than the crude OR (3.8 versus 3.6; 95%CI: 1.23-11.71; p=0.019). Pertaining to the influence of VEGF-A to the incidence of brain edema with reference to the role of diabetes mellitus, the influence was greater, but not statistically different, at the level of no history than of history exists. The subsequent chi-square analysis suggested that the history of diabetes mellitus was a significant interacting factor to the correlation between VEGF-A and brain edema since the OR was greater than the crude OR (3.7 versus 3.6; 95%CI: 1.20-11.62; p=0.020). For the role of hypercholesterolemia within the interaction of VEGF-A to the incidence of brain edema, the influence was greater, but not statistically different, at the level of no history (OR=4.4) than of history exists (OR=1.5). The subsequent chi-square analysis suggested that the history of hypercholesterolemia was a significant
confounding factor to the correlation between VEGF-A and brain edema since the OR was equal to the crude OR (3.6 versus 3.6; 95%CI: 1.17-11.02; p=0.021).
Pertaining to the influence of VEGF-A to the incidence of brain edema with reference to the role of heart disease, the influence was greater, but not statistically different, at the level of no history than of history exists. The subsequent chi-square analysis suggested that the history of heart disease was a significant interacting factor to the correlation between VEGF-A and brain edema since the OR was greater than the crude OR (3.7 versus 3.6; 95%CI: 1.20-11.22; p=0.020). Lastly, for the role of smoking habit within the interaction of VEGF-A to the incidence of brain edema, the influence was greater, but not statistically different, at the level of no history (OR=4.4) than of history exists (OR=2.9). The subsequent chi-square analysis suggested that the history of hypercholesterolemia was a significant interacting factor to the correlation between VEGF-A and brain edema since the OR was greater than the crude OR (3.8 versus 3.6; 95%CI: 1.23-11.87; p=0.016).
Model “F” in Table 6 described a significant influence of VEGF-A reduction at the incidence of brain edema with respect to systolic and diastolic blood pressure (OR=3.78; 95%CI: 1.23-11.65). Model “G” depicted an influence of VEGF-A reduction at the incidence of brain edema by heeding risk factors (history of hypertension, diabetes mellitus, heart disease, hypercholesterolemia and smoking). It was shown that the influence was statistically significant with an increased odds ratio as compared to model “F” (OR=4.78; 95%CI: 1.38-16.56). Model “H” displayed a significant influence of VEGF-A reduction at the incidence of brain edema with respect to the albumin level (OR=3.61; 95%CI: 1.18-11.04). Model “I” depicted a significant influence of VEGF-A reduction at the incidence of brain edema with an increased odds ratio by heeding the MMP-9 level (OR=5.59; 95%CI: 1.58-19.78).
MMP-9 alone had a significant influence on the incidence of brain edema (OR=3.31; 95%CI: 1.06-10.38). This result was in accordance with the previous study demonstrating that MMP-9 levels were increased upon brain ischemia and that the elevated MMP-9 levels disrupted blood-brain barrier and subsequently caused blood-brain edema [16]. In addition, MMP-9 mediated the pathogenesis of hypoxia-induced brain edema through a mechanism that involves VEGF [18].
Model “J” displayed a significant influence of VEGF-A reduction at the incidence of brain edema with respect to the therapeutic window (OR=3.59; 95%CI: 1.17-10.98). Finally, model “K” depicted a significant influence of VEGF-A reduction at the incidence of brain edema with an elevated odds ratio by heeding the GMSS score (OR= 5.29; 95%CI: 1.47-19.08).
Table 4. Bivariate stratification analysis of history of risk factors on VEGF-A influence within the brain and non-brain edema groups
Risk factor
Brain edema
Non-brain edema
OR 95%CI Crude OR (OR)
95%CI p
n % n % Lower
limit
Upper limit
Lower limit
Upper limit History of hypertension
Yes 21 80.8 12 57.1 3.2 0.72 14.64 3.6
5 19.2 9 42.9 (3.8) 1.23 11.71 0.019
No 10 90.9 8 61.5 6.3 0.50 324.50
1 9.1 5 38.5
History of diabetes mellitus
Yes 8 100.0 5 7.4 - 3.6
0 0.0 2 28.6 (3.7) 1.20 11.62 0.020
No 23 79.3 15 55.6 3.1 0.83 12.06
6 20.7 12 44.4
History of hypercholesterolemia
Yes 3 75.0 6 66.7 1.5 0.07 104.64 3.6
1 25.0 3 33.3 (3.6) 1.17 11.02 0.021
No 28 84.8 14 56.0 4.4 1.11 19.02
5 15.2 11 44.0
History of heart disease
Yes 3 100.0 2 66.7 - 3.6
0 0.0 1 33.3 (3.7) 1.20 11.22 0.020
No 28 82.4 18 58.1 3.4 0.96 12.68
6 17.6 13 41.9
Smoking habit
Yes 11 78.6 5 55.6 2.9 0.33 27.24 3.6
3 21.4 4 44.4 (3.8) 1.23 11.87 0.016
No 20 87.0 15 60.0 4.4 0.90 28.62
3 13.0 10 40.0
11
Table 5. Multivariate logistic regression analysis on the influence of VEGF-A to the incidence of brain edema with respect to the laboratory parameters
Variable Model A Model B Model C Model D Model E
OR (95%CI) OR (95%CI) OR (95%CI) OR (95%CI) OR (95%CI)
VEGF-A 3.62* (1.19-10.97) 3.75* (1.22-11.53) 3.91* (1.24-12.34) 4.26* (1.28-14.15) 3.71* (1.22-11.35)
Age 0.99 (0.94-1.04)
Gender 0.67 (0.25-1.81)
BUN 1.38 (0.35-5.38)
Creatinine 0.54 (0.11-2.57)
Total cholesterol 0.55 (0.16-1.94)
LDL 0.25 (0.05-1.23)
Trigliceryde 1.57 (0.38-6.57)
HDL 1.09 (0.37-3.26)
Glucose 1.41 (0.53-3.77)
* Odds Ratio of the influence of VEGF-A decrease to the brain edema after considering related variables
Table 6. Multivariate logistic regression analysis on the influence of VEGF-A to the incidence of brain edema with respect to the risk factors
Variable Model F Model G Model H Model I Model J Model K
OR (95%CI) OR (95%CI) OR (95%CI) OR (95%CI) OR (95%CI) OR (95%CI)
VEGF-A 3.78* (1.23-11.65) 4.78* (1.38-16.56) 3.61* (1.18-11.04) 5.59** (1.58-19.78) 3.59* (1.17-10.98) 5.29* (1.47-19.08)
Systolic BP 0.87 (0.32-2.40)
Diastolic BP 0.57 (0.16-2.01)
Hypertension 2.49 (0.78-7.90)
Diabetes mellitus 0.98 (0.24-3.94)
Heart disease 0.61 (0.09-3.79)
Hypercholesterolemia 0.24 (0.05-1.07)
Smoking 2.95 (0.90-9.64)
Albumin 0.60 (0.21-1.70)
MMP-9 3.31 (1.06-10.38)
Therapeutic window 1.06 (0.39-2.86)
GMSS score 6.26 (1.67-23.10)
GMSS score alone had a significant influence on the incidence of brain edema with a very elevated odds ratio (OR=6.26; 95%CI: 1.67-23.10). As reported by Lamsudin, while patients with GMSS score >23 had mild to moderate neurologic deficits, patients with the score <23 had severe neurologic deficits. This finding was in an agreement with previous studies suggesting that the neurologic deterioration in stroke patients were mainly correlated with the severity of brain edema [26,27].
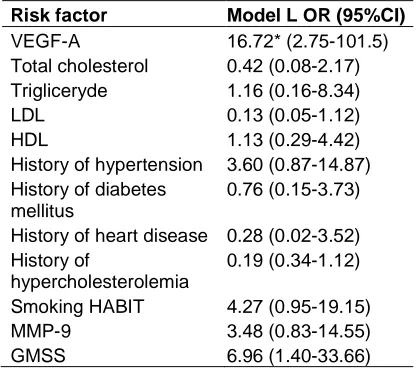
Multivariate analyses on the influence of VEGF-A at the incidence of brain edema with reference to several strong variable groups were shown in Table 7. Those variable groups were model “D” (OR=4.26), model “G” (OR=4.78), model “I” (OR=5.59) and model “K” (OR=5.29). Based on the multivariate analysis by heeding the combination of model “D”, “G”, “I” and “K” (i.e., model “L”), a reduction in VEGF-A level could significantly influenced the incidence of brain edema with a very elevated odds ratio (OR=16.72; 95%CI: 2.75-101.5).
Based on this analysis, the lipid profiles, history of stroke risk factors, MMP-9 levels and GMSS score displayed interacting or modifying effects with the reduction of VEGF-A levels at the incidence of brain edema in acute ischemic stroke patients. These modifying effects suggested that the main component (VEGF-A reduction) could be modified by other component (lipid profiles, history of stroke risk factors, MMP-9 levels and GMSS score) [28].
Our findings supported the hypothesis that stroke is a very complex mechanism and that stroke is a combined destruction of endothelial cells, vascular smooth muscle cells, astroglia, microglia, neuron and tissue matrix protein [1]. The mortality rate of massive cerebral infarction is 50-80% [29], in which the primary cause is brain edema [30]. Progressive brain edema causes neurologic deterioration, mainly due to the brain herniation [27]. Furthermore, stroke patients with large infarct have an increased risk of fatal brain edema if they have other risk factors, such as hypertension or heart failure [31].
We acknowledged several limitations that may influence our study, such as 1) the size of the infarction was not measured; 2) the controlled versus uncontrolled stroke risk factors were not compared; and 3) this study involved many variables and measuring instruments, thus
required frequent calibration, reliability and validation.
Table 7. Multivariate logistic regression analysis on the influence of VEGF-A to the incidence of brain edema by considering the
combination of several variable groups
Risk factor Model L OR (95%CI)
VEGF-A 16.72* (2.75-101.5)
Total cholesterol 0.42 (0.08-2.17) Trigliceryde 1.16 (0.16-8.34)
LDL 0.13 (0.05-1.12)
HDL 1.13 (0.29-4.42)
History of hypertension 3.60 (0.87-14.87) History of diabetes
mellitus
0.76 (0.15-3.73)
History of heart disease 0.28 (0.02-3.52) History of
hypercholesterolemia
0.19 (0.34-1.12)
Smoking HABIT 4.27 (0.95-19.15)
MMP-9 3.48 (0.83-14.55)
GMSS 6.96 (1.40-33.66)
* Odds Ratio of the influence of VEGF-A decrease to the brain edema after considering combination of
several variables
4. CONCLUSION
We concluded that the lipid profiles, history of stroke risk factors, MMP-9 levels and GMSS score appeared to have modifying effects on the reduction of VEGF-A levels at the incidence of brain edema in acute ischemic stroke patients. Indeed, the influence of VEGF-A reduction at the incidence of brain edema would be strongly enhanced by taking those variables into consideration.
ACKNOWLEDGEMENTS
We are grateful to all study participants. We also acknowledge Rusdy Ghazali Malueka M.D., Ph.D and Juandy Jo M.D., Ph.D for their help in preparing the manuscript.
COMPETING INTERESTS
Authors have declared that no competing interests exist.
REFERENCES
in stroke. Nat Rev Neurosci. 2003; 4(5):399–415.
2. Slevin M, Krupinski J, Kumar P, Gaffney J, Kumar S. Gene activation and protein expression following ischaemic stroke: Strategies towards neuroprotection. J Cell Mol Med. 2005;9(1):85–102.
3. Ogawa S, Oku A, Sawano A, Yamaguchi S, Yazaki Y, Shibuya M. A novel type of vascular endothelial growth factor, VEGF-E (NZ-7 VVEGF-EGF), preferentially utilizes KDR/Flk-1 receptor and carries a potent mitotic activity without heparin-binding domain. J Biol Chem. 1998;273(47): 31273–82.
4. Felmeden DC, Blann AD, Lip GYH. Angiogenesis: Basic pathophysiology and implications for disease. Eur Heart J. 2003;24(7):586–603.
5. Weis SM, Cheresh DA. Pathophysiological consequences of VEGF-induced vascular permeability. Nature. 2005;437(7058):497– 504.
6. Simard JM, Kent TA, Chen M, Tarasov KV, Gerzanich V. Brain oedema in focal ischaemia: molecular pathophysiology and theoretical implications. Lancet Neurol. 2007;6(3):258–68.
7. Karalliedde J, Gnudi L. Endothelial factors and diabetic nephropathy. Diabetes Care. 2011;34(Suppl 2):S291–6.
8. Li W, Prakash R, Kelly-Cobbs AI, Ogbi S, Kozak A, El-Remessy AB, et al. Adaptive cerebral neovascularization in a model of type 2 diabetes: Relevance to focal cerebral ischemia. Diabetes. 2010;59(1): 228–35.
9. Vilar J, Waeckel L, Bonnin P, Cochain C, Loinard C, Duriez M, et al. Chronic hypoxia-induced angiogenesis normalizes blood pressure in spontaneously hypertensive rats. Circ Res. 2008;103(7):761–9.
10. Langenberg MHG, van Herpen CML, De Bono J, Schellens JHM, Unger C, Hoekman K, et al. Effective strategies for management of hypertension after vascular endothelial growth factor signaling inhibition therapy: Results from a phase II randomized, factorial, double-blind study of Cediranib in patients with advanced solid tumors. J Clin Oncol Off J Am Soc Clin Oncol. 2009;27(36):6152–9. 11. Libby P. Inflammation in atherosclerosis.
Nature. 2002;420(6917):868–74.
12. Forrester JS, Libby P. The inflammation hypothesis and its potential relevance to statin therapy. Am J Cardiol. 2007; 99(5):732–8.
13. Matsumoto K, Ohi H, Kanmatsuse K. Interleukin 10 and interleukin 13 synergize to inhibit vascular permeability factor release by peripheral blood mononuclear cells from patients with lipoid nephrosis. Nephron. 1997;77(2):212–8.
14. Rosenberg GA. Matrix metalloproteinases and their multiple roles in neurodegenerative diseases. Lancet Neurol. 2009;8(2):205–16.
15. Lakhan SE, Kirchgessner A, Hofer M. Inflammatory mechanisms in ischemic stroke: Therapeutic approaches. J Transl Med. 2009;7:97.
16. Barr TL, Latour LL, Lee K-Y, Schaewe TJ, Luby M, Chang GS, et al. Blood-brain barrier disruption in humans is independently associated with increased matrix metalloproteinase-9. Stroke J Cereb Circ. 2010;41(3):e123–8.
17. Park K-P, Rosell A, Foerch C, Xing C, Kim WJ, Lee S, et al. Plasma and brain matrix metalloproteinase-9 after acute focal cerebral ischemia in rats. Stroke J Cereb Circ. 2009;40(8):2836–42.
18. Bauer AT, Bürgers HF, Rabie T, Marti HH. Matrix metalloproteinase-9 mediates hypoxia-induced vascular leakage in the brain via tight junction rearrangement. J Cereb Blood Flow Metab Off J Int Soc Cereb Blood Flow Metab. 2010;30(4):837– 48.
19. Mott JD, Werb Z. Regulation of matrix biology by matrix metalloproteinases. Curr Opin Cell Biol. 2004;16(5):558–64.
20. Dziedzic T, Pera J, Slowik A, Gryz-Kurek EA, Szczudlik A. Hypoalbuminemia in acute ischemic stroke patients: Frequency and correlates. Eur J Clin Nutr. 2007; 61(11):1318–22.
21. Alvarez-Perez FJ, Castelo-Branco M, Alvarez-Sabin J. Albumin level and stroke. Potential association between lower albumin level and cardioembolic aetiology. xnt J Neurosci. 2011;121(1):25–32. 22. Katavetin P, Inagi R, Miyata T, Tanaka T,
pathway. Biochem Biophys Res Commun. 2008;367(2):305–10.
23. Zhang ZG, Zhang L, Jiang Q, Zhang R, Davies K, Powers C, et al. VEGF enhances angiogenesis and promotes blood-brain barrier leakage in the ischemic brain. J Clin Invest. 2000;106(7):829–38. 24. Schlesselman JJ. Case-control studies:
Design, conduct, analysis. 1st ed. Oxford: Oxford University Press; 1982.
25. Lamsudin R. Reliabilitas Skala Stroke Gadjah Mada (SSGM) pada Pasien Stroke, in Buku Abstrak Musyawarah Kerja dan Pertemuan Ilmiah Tahunan Perdossi. Malang; 1998.
26. Aiyagari V, Diringer MN. Management of large hemispheric strokes in the neurological intensive care unit. The Neurologist. 2002;8(3):152–62.
27. Qureshi AI, Suarez JI, Yahia AM, Mohammad Y, Uzun G, Suri MFK, et al. Timing of neurologic deterioration in massive middle cerebral artery infarction:
A multicenter review. Crit Care Med. 2003;31(1):272–7.
28. Kleinbaum DG, Klein M. Logistic Regression: A Self-Learning Text. 3rd ed. Statistics for Biology and Health. New York: Springer-Verlag New York; 2010. 29. Hacke W, Schwab S, Horn M, Spranger M,
De Georgia M, von Kummer R. “Malignant” middle cerebral artery territory infarction: clinical course and prognostic signs. Arch Neurol. 1996;53(4):309–15.
30. Rieke K, Schwab S, Krieger D, von Kummer R, Aschoff A, Schuchardt V, et al. Decompressive surgery in space-occupying hemispheric infarction: results of an open, prospective trial. Crit Care Med. 1995;23(9):1576–87.
31. Kasner SE, Demchuk AM, Berrouschot J, Schmutzhard E, Harms L, Verro P, et al. Predictors of fatal brain edema in massive hemispheric ischemic stroke. Stroke J Cereb Circ. 2001;32(9):2117–23.
_________________________________________________________________________________ © 2016 Setyopranoto et al.; This is an Open Access article distributed under the terms of the Creative Commons Attribution License (http://creativecommons.org/licenses/by/4.0), which permits unrestricted use, distribution, and reproduction in any medium, provided the original work is properly cited.
Peer-review history: