High-dynamic-range imaging optical detectors
Ricardo C. Coutinho
a,b, David R. Selviah
b, Hugh D. Griffiths
ba
Brazilian Navy Weapon Systems Directorate, Rua Primeiro de Março, 118, 20
oandar, Rio
de Janeiro, Brazil
b
Department of Electronic and Electrical Engineering, University College London, London
WC1E 7JE, United Kingdom
ABSTRACT
Imaging spectrometers allowing spatially resolved targets to be spectrally discriminated are valuable for remote sensing and defense applications. The drawback of such instruments is the need to quickly process very large amounts of data. In this paper we demonstrate two imaging systems which detect a dim target in a bright background, using the coherence contrast between them, generating much less data but only operating over a limited optical bandwidth. Both systems use a passband filter, a Michelson interferometer, coupling optics and a CCD camera. The first uses the interferometer in a spatial mode, by tilting one of the mirrors to create a set of line fringes on the CCD array. The visibility of these fringes is proportional to the degree of coherence. The interferogram is displayed spatially on the CCD array, as a function of the path differences. The second system uses the interferometer in a temporal mode. A coherent point target and an extended background are imaged through the interferometer onto the CCD array, and one of the interferometer's mirrors is scanned longitudinally to vary the path difference in time. In both cases the coherent target is detected over a large dynamic range down to negative signal-to-background power ratios (in dB). The paper describes an averaging technique to improve the signal-to-noise ratio and correction techniques required to extract interferograms from the images. The spatial technique developed has the advantage of using no moving parts.
Keywords: Coherent imaging, imaging spectrometers, unconventional imaging methods, Fourier transform spectrometry, Michelson interferometers.
1. INTRODUCTION
2. EXPERIMENTS USING COMPETING METHODS
In order to have additional data for performance comparison purposes, we have performed experiments using example competing techniques, under the same laboratory conditions and equipment. Although many other techniques could have been chosen for experimentation, it was decided to experiment techniques that use the same components as in the main experiment, allowing better standardization. The experiments consisted in the measurement of the smallest signal-to-clutter ratio (SCR), for which the target could be discerned on a screen. The SCR is defined here as the ratio of target power to clutter power, measured at the plane of an iris located at the input of the studied detection system. In all studied cases, the target was a 633 nm, 5 mW unpolarized He-Ne laser and the clutter was a light source comprising a 20 W tungsten halogen bulb with a blackbody temperature of 3220 K, and collimating optics. The light from the two sources were combined in a cube beamsplitter, and sent to the detection system. Two types of target were experimented: A point target, represented by the laser beam without expansion, and an extended target, built by expanding the laser beam, and passing it through a transmission test chart. Variable SCRs were obtained by inserting a variable attenuator in the laser path to reduce its transmitted power. The details of each experiment follow.
2.1. Detection by Thresholding
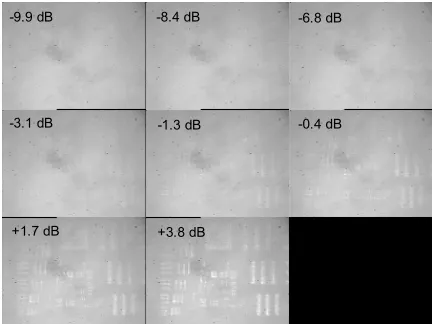
The simplest technique to detect a target in an image is possibly just to record the image with a camera and look for an object in it. Fig. 1 displays a set of images acquired using the target/clutter combination scheme described previously, a frame grabber (Matrox Pulsar) and a monochrome CCD camera (Sony XC77RR-CE) coupled to a 6x zoom lens (Computar 501 4377) pointed to the exit surface of the cube beamsplitter. The numbers in dB are the SCRs measured as follows: A photodetector was placed behind the iris described in item 1, replacing the CCD camera. The powers from target and clutter were measured, and a correction factor of +4.78 dB was applied, to account for the fact that the target image does not fill every pixel in the image, as it passes through the test target mask. This factor corresponds to the total number of pixels in the image (576x768), divided by the number of target pixels, to find the “per pixel” SCR, and was used in all experiments in this paper. In fig. 1 it is possible to see spatial structure from the image corresponding to SCR=1.7 dB, which we from now on define as the sensitivity of the detection system.
-9.9 dB -8.4 dB -6.8 dB
-3.1 dB -1.3 dB -0.4 dB
+1.7 dB +3.8 dB
Figure 1 – Raw (unprocessed) images acquired from an expanded laser transmitted through a test target, in a light bulb background
worse than in the unprocessed data. Inserting the narrowband filter, the results are the same as in the unprocessed case. Hence, the use of a threshold did not increase the sensitivity of the detection system
-9.9 dB -8.4 dB -6.8 dB
-3.1 dB -1.3 dB -0.4 dB
1.7 dB 3.8 dB
Figure 2 - Threshold images of the He-Ne laser as a target; white pixels represent threshold crossings 2.2. Frame Subtraction
From this experiment onwards, an interferometric system, depicted in fig. 3, was employed. The target and clutter generation process is the same as previously described. The radiation entering the detection system through the iris reaches a Michelson interferometer, where it splits in two beams, which recombine to exit the instrument. One of the mirrors is moved longitudinally to create a path difference between the two beams. The movement (of the stage) is controlled by a motor controller (Klinger MC4), according to the commands generated in a computer running an instrument control software. The radiation exiting the interferometer is collected by the zoom lens and coupled to a 576x768 pixel CCD array (described previously), whose video signal is digitized in the frame grabber and stored for off-line processing in a personal computer (Pentium 500 MHz, 128 MB of RAM memory). The frame grabbing process is synchronized to the mirror motion by triggering the frame grabber from the motion controller.
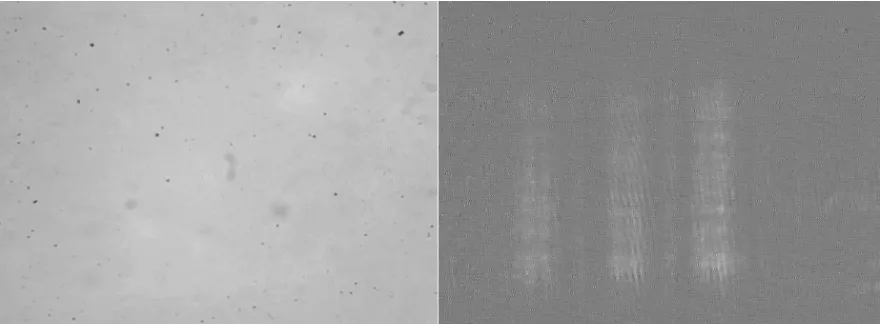
The arrangement shown in fig. 3 is very similar to FTS systems. In this case, rather than scanning the interferometer mirror to create a long interferogram, a short scan is performed. As the path difference is changed through mirror displacement, interference fringes are formed in the interferometer exit plane, provided that the coherence length of the light source is longer than the path imbalance9. One possible technique consists in biasing the path imbalance to a value much longer than the clutter coherence length, varying the path difference and recording successive images of the target-clutter combined scene. Due to its longer coherence length, the radiation from the He-Ne laser will produce fringes, which will be measured in the CCD sensor as a temporal modulation. An observer at the interferometer exit plane will see the target blinking, and no change in the background clutter, apart from noise. One simple way of detecting the coherent target is, then, to calculate the pixel-by-pixel difference between successive frames, and look for time-varying intensities. We have attempted to do this initially with two frames at an SCR of –11.6 dB, but the target was not detected due to the increase in high frequency noise, caused by the differentiation operation. A more robust method is to take a longer frame sequence, and create a data cube with two spatial and one temporal dimension. A computer program (written in Matlab language) then differentiates the time signal for each pixel, finds the maximum value of the result and converts the resulting matrix in a grayscale. Fig. 4 presents one of the frames of the 20 frame long original sequence, where the target cannot be distinguished, and the processed image, where the target, a set of three vertical bars found in the bottom-right corner of the test target shown in fig. 1, appear brighter than the background. The SCR in this case, the minimum detectable using this technique, was –11.6 dB as well. A better result (-17.0 dB) was obtained by calculating the standard deviation, instead of the maximum, of the differences between successive points in the time signal. This last method was also applied to the detection of an unexpanded He-Ne laser beam in the same background, with a minimum detectable SCR of -4.88 dB.
Figure 4 - Frame differentiation method: unprocessed image (left), and processed image (right)
2.3. Modulation recognition
obtained, as in the case of frame differentiation. Fig. 6 shows the corresponding image, whose size had to be reduced due to computer memory limitations. It is believed that the horizontal strips are due to the detection of a modulation coming from electronic noise in the CCD camera, but this remains to be confirmed.
0 2 4 6 8 10 12 14 16 18 20
-10 -5 0 5 10
frame number rela
ti v e gr a y s c ale a m plit u d e
Figure 5 - Time evolution of a target pixel (full line) and a background pixel (dashed)
Figure 6 - Detection of a laser spot by modulation recognition
3. PROPOSED ALGORITHM DESCRIPTION
Having described the experiments done with competing techniques for the sake of comparison, we describe in this section the novel algorithm proposed, an extension of previous work with time sequences7,8, now applied to image formation. It is an optical, interferometric system, implemented in the visible band, although any band where components are available can be used. The radiation from the scene is passed through a narrowband interference filter with a steep roll-off characteristic, resembling a top hat frequency response. In the system depicted in fig. 3, this filter is placed just after the iris, at the entrance of the system. The filtered radiation is fed to a Michelson interferometer, producing interference fringes modulated by a sinc (sin(x)/x) function, corresponding to the Fourier transform of the rectangular power spectrum. In its temporal mode, one of the interferometer’s mirrors is scanned longitudinally as happens in FTS, but limiting the length of the scan to the region of the first minimum of the sinc-shaped interferogram. The insertion of a target whose degree of coherence is higher than that resulting from the filtering process results in an increase in the target-filtered background net degree of coherence, causing a displacement in the path difference at which the first minimum of the interferogram occurs. By converting the optical interferogram signal continuously into an electrical signal, for each pixel in an image, using a CCD array, and calculating this displacement, a grayscale image proportional to this displacement can be obtained. The sensitivity of the approach is increased as the accuracy in the position of this minimum is improved, and this is done using an algorithm run in a computer, which
operates an event marker that pinpoints the position of the interferogram amplitude minimum by locating a steep phase transition that happens in the interferogram in the region of its minimum amplitude7,8.
The spatial mode of the approach is not image-forming, actually representing a no-moving parts variation of the system described in previous publications7,8. Interferometer-based, mirror-scanning spectrometers are considered expensive and complex instruments, a fact which gave rise to the development of static Fourier transform spectrometers (StFT)1. In both StFT and the approach proposed in this paper, instead of scanning one of the mirrors of the interferometer longitudinally, this mirror is tilted to form Fizeau fringes9 in the instrument's exit plane. In the case of our technique, the fringes are vertical, and the acquired interferograms are horizontal, being that, in the case of the camera used in our experiments, up to 578 interferograms of 768 samples each can be recorded per image.
4. EXPERIMENTS USING THE PROPOSED METHOD
4.1- Temporal Mode
In this mode, the temporal interferometric system previously described utilizes the components shown in fig. 3, with the addition of an interference filter after the iris, with a mean wavelength of 632.8 nm (coincident with the He-Ne laser line), and a FWHM of 11 nm. The target (either an expanded beam through a mask or an unexpanded beam) was dimmed by a combination of neutral density filters and a variable attenuator. By changing this combination, three different SCRs for the point target, and four SCRs for the extended target were obtained, and a sequence of 500 frames were acquired for each SCR, for both extended and point targets. The automated image acquisition system was programmed to grab one frame, store it in the computer's memory, move the translation stage 0.1 µm, wait for the stage's position to stabilize, and grab another frame, at a rate of 7.5 frames-per-second. The path-difference sampling rate was 0.2 µm per step (twice the stage displacement). This sampling rate, the smallest possible with the available stages, was enough to obey the Nyquist sampling criterion, with a wavelength of 0.63 µm, although some degradation in the detection of the phase transition did happen due to this limitation. The tilting mirror of the interferometer was adjusted to give fringes as close to circular as possible, but only elliptic fringes were obtained due to imperfections in the mirror's mounting. The off-line processing had the following stages: to load 500 frames; reduce the original data volume from 288x384x500 to 140x114x180, in order to allow processing by the computer available; form a data cube containing 140x114 interferograms with 180 samples each; subtract a reference image, pixel-by-pixel, to remove the background and fixed pattern noise; run the demodulation algorithm described in section three, subtract a reference value in path difference corresponding to the position of the phase transition in a region of the image where the target is known not to be, and create a binary image from the displacements in the phase transition.
The algorithm just described was run with the sequences recorded with a point target, and no detection occurred, due to a signal-to-noise ratio too low (the region of the interferogram to be investigated is the one with the lowest visibility). The solution to this problem was to apply a 3x3 sliding window, which calculated the mean of the interferograms from nine neighboring pixels and replaced the central pixel with the result.
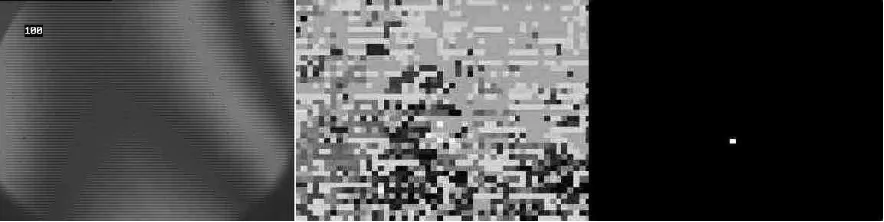
This averaging operation allowed the detection of the point laser target at an SCR of -22.26 dB at the detection system input. Fig. 7 shows one of the frames of the original sequence, where it is possible to see the shape of the fringes, the image calculated by the algorithm, and the binary image obtained with a threshold of 0.99. With the extended target, no detection was obtained up to an SCR of -37 dB. Higher SCRs were not experimented.
4.2 - Spatial Mode
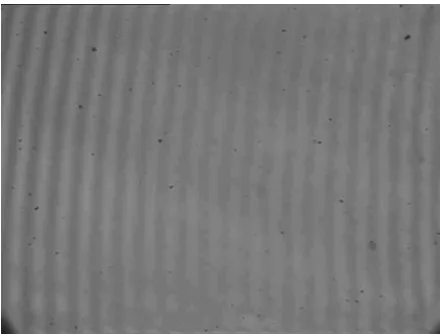
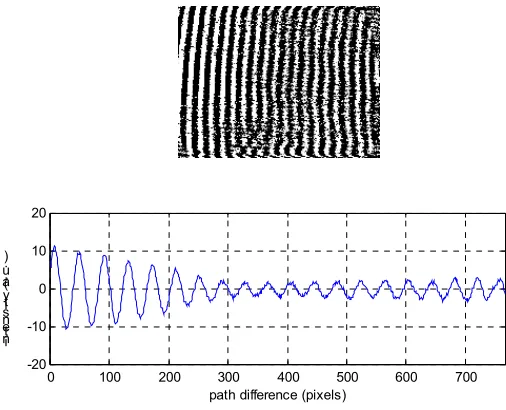
As explained in section three, in its spatial mode the proposed system does not form an image, but rather uses the displacement of the line fringes created by tilting one of the interferometer's mirrors to decide whether a target is present in the FOV or not. In these experiments two different light sources were used as targets: the He-Ne laser employed previously, and a grating monochromator simulating a partially coherent target. The light from the laser was expanded, and from the monochromator was collimated to fill the interferometer's mirrors. Fig. 8 presents an example of a raw image acquired with the interferometric system. It is noticeable that, as the path difference increases from left to right, the contrast of the fringes (or their visibility) starts decreasing, passes through a minimum, then increases again. This increase is the first sidelobe is the sinc-like self-coherence profile expected from an interference filter with a sharp roll-off characteristic, and the vertical line where the visibility is at its minimum also contains the sought-after phase transition. It can be seen that the fringes are not perfectly straight, due to imperfections in the optics. Fixed pattern noise caused by dirt, dead pixels, array and illumination non-uniformities are also observed. These are removed by the computer algorithm.
Figure 8 - Line fringes obtained from the tungsten halogen bulb through the 632.8 nm interference filter, in the region of minimum visibility
Signal processing was implemented off-line via a Matlab program, which loads a pair of images, one with the target present in the FOV, another without, removes fixed pattern noise and the image average level by subtracting reference images acquired in a long path difference, where fringes are not observed. The program then calculates horizontal intensity profiles for three rows in the center of the image, and averages them. We have used only three lines of the image because this number was enough to give a reasonable signal-to-noise ratio, and because too much averaging smoothes the interferogram, removing the phase transition of interest. The resulting interferogram is depicted in fig. 9, together with the image after fixed pattern noise and background level removal. After this operation the horizontal intensity profile is no longer a number in between 1 and 256 (8 bits), but rather a signal with zero DC level. Having obtained this interferogram, the second module of the program implements the phase transition detection algorithm already described. The image seen in fig. 9 received further processing (FFT filtering) to remove noise, but this is not required by the detection algorithm, since noise removal is achieved through averaging and bandpass filtering of the interferogram signal.
background, an interference filter with the same center wavelength and a bandwidth of 17.8 nm, a target-to-filter bandwidth ratio that gives an optimal sensitivity according to our previous studies11. Six different SCRs were obtained by setting different power levels in the monochromator light source. In each SCR five image pairs were acquired, each with one image with and another without the target, plus a reference image for fixed pattern noise and background removal. The five phase transition displacements were averaged and the standard deviation was calculated. In this sub-section we use a simple detection criterion, consisting of declaring a detection whenever the average displacement is larger than its standard deviation. Using this criterion the minimum detectable SCR was -33.38 dB at the input of the detection system, a result a lot better than the temporal approach, at the expense of the image formation.
0 100 200 300 400 500 600 700
-20 -10 0 10 20
path difference (pixels) in
te n sit y (a .u . )
Figure 9 - processed image (above) and resulting interferogram (below)
Another target we have tested was the same He-Ne laser used previously, and same interference filter and tungsten halogen lamp than before. In this experiment the minimum detectable SCR was-36.62 dB, at the system input. It would be reasonable to believe that the sensitivity to a laser would be far better than to partially coherent light, in a coherence-based approach, but laser speckle and difficulties in obtaining reference images prevented this from happening.
5. COMPARISON OF RESULTS
Experiment Minimum detectable SCR (dB)
Number of frames required
target
Visual detection using raw images
1.7 1 Laser, extended
Narrowband filtering -16.6 1 Laser, extended
Frame differentiation -17 20 Laser, extended
Frame differentiation - 4.9 20 Laser, point
Modulation recognition -4.9 20 Laser, point
Interferogram phase transition displacement - temporal mode
-22.3 180 Laser, point
Interferogram phase transition displacement - spatial mode
-33.4 1 Monochromator,
non-imaging
Interferogram phase transition displacement - spatial mode
-36.6 1 Laser, non-imaging
6. CONCLUSION
This paper presented a comparison of a coherence-imaging technique, developed by the authors, with techniques based in amplitude and in coherence, explored by other workers. The comparison was made by reproducing experiments using the competing techniques, rather than quoting results from previous publications. Although this fact restricts the number of techniques investigated, it presents the advantage of standardizing the experiments, which use the same hardware, thus obtaining better uniformity of experimental conditions. The coherence imaging technique proposed by the authors possesses high dynamic range (circa 22 dB) and supersedes the approaches based in intensity and even other coherence-based approaches experimented in this paper. It is believed that with the use of high frame rate cameras and fast computer processing, update rates compatible with real-time operation can be achieved, making the proposed approach an interesting alternative for biomedical applications, and for imaging through turbid media. All the targets used in this paper were static, and the adaptation of the existing algorithm to the detection of moving targets is currently under investigation.
7. ACKNOWLEDGEMENTS
The authors would like to thank Prof. Herbert A. French for useful discussions and guidance, Duleep Wickramasinghe and DERA Portsdown West for lending part of the equipment used in the experiments, and the Brazilian Navy for sponsoring the first author.
8. REFERENCES
1. E.V. Ivanov. Static Fourier transform spectroscopy with enhanced resolving power. J. Opt. A: Pure Appl. Opt. Vol. 2: 519-528,2000.
2. P. Shnitser, I. Agurok, S. Sandomirsky, A. Avakian, R. Lockwood. Real-time polarization sensitive multispectral automatic imaging system for object contrast enhancement and clutter mitigation.
Proceedings of the SPIE vol. 4025: 229-237, 2000.
3. B. Devaraj, M. Usa, K.P. Chan, T. Akatsuka, H. Inaba. Recent advances in coherent detection imaging (CDI) in biomedicine: laser tomography of human tissues in vivo and in vitro. IEEE Journal of Selected Topics in Quantum Electronics, vol. 2: 1008-1016, 1996.
4. S. C. Hyde, R. Jones, N. P. Barry, J.C. Dainty, P.M. French, K.M. Kwolek, D.D. Nolte, M.R. Melloch.
Depth-resolved holography through turbid media using photorefraction. IEEE Journal of Selected Topics in Quantum Electronics, vol. 2: 965-975, 1996.
6. E.N. Leith. Coherence methods for unconventional imaging processes. Unconventional optical elements for information storage, processing and communications, NATO Advanced Science Institute series, subseries3, High Technology: 1-7, 2000.
7. R.C. Coutinho, H.A. French, D.R. Selviah, D. Wickramasinghe and H.D. Griffiths. Detection of Coherent Light in an Incoherent Background. Proceedings of the 12th Annual Meeting of the IEEE Lasers and Electro-Optical Society, San Francisco, USA, vol.1: 247-248, 1999.
8. R. C. Coutinho, D.R. Selviah and H.A. French. Detection of Partially Coherent Optical Emission Sources. Optical Pattern Recognition XI, David P. Casasent, Tien-Hsin Chao, Editors, Proceedings of the SPIE Vol. 4043: 238-248, 2000.
9. E. Hecht. Optics - 3rd edition. Addison-Wesley, New York, 1998.
10. P. Sutton. A novel optical pre-detector signal processing technique. PhD thesis, University of London, 1982.