Optimization of the cleaning process on a pilot filtration setup
for waste water treatment accompanied by flow visualization
Petr Bílek1*, Jakub Hrůza1
Technical University of Liberec, Studentská 1402/2, 461 17, Liberec 1, Czech Republic1
Abstract. This paper deals with an optimization of the cleaning process on a liquid flat-sheet filter accompanied by visualization of the inlet side of a filter. The cleaning process has a crucial impact on the hydrodynamic properties of flat-sheet filters. Cleaning methods avoid depositing of particles on the filter surface and forming a filtration cake. Visualization significantly helps to optimize the cleaning methods, because it brings new overall view on the filtration process in time. The optical method, described in the article, enables to see flow behaviour in a thin laser sheet on the inlet side of a tested filter during the cleaning process. Visualization is a strong tool for investigation of the processes on filters in details and it is also possible to determine concentration of particles after an image analysis. The impact of air flow rate, inverse pressure drop and duration on the cleaning mechanism is investigated in the article. Images of the cleaning process are compared to the hydrodynamic data. The tests are carried out on a pilot filtration setup for waste water treatment.
1 Introduction
Water became a strategic commodity as an outcome of world population growth. One of the most promising way, how to safe drinking water sources, is waste water treatment and recycling. The goal is to get rid of solid particles and bacteria as well as soluble materials as hormones, minerals, acids, etc. Filtration is a key mechanism for separation most of the solids and making solid particle free water. Unfortunately filtration membranes suffer flux declension because of formation of a filtration cake and pore blocking. Cleaning process is a very important part of the filtration process which limits the growth of the filtration cake, improves hydrodynamic properties and extends lifetime of the filter.
Optimization of the cleaning process is discussed in [1-4]. Effect of ultrasound on membrane filtration and cleaning process is investigated in [1]. Chemical cleaning optimization on milk filtration is carried out in [2]. It was found out that the chemical cleaning is a very effective way to regenerate membrane flux. Selected chemicals have to be safe, cheap and water washable. Optimization was carried out using multi-regresion in software Modde 8. Operation conditions were optimized such as cleaning time, temperature, cross-flow velocity and concentration of chemicals. The effect of wastewater particle size, concentration, operation conditions and backwashing on filtration of waste water is shown in [3]. The membrane is cleaned by continuous tangential flow and in some time intervals by backwashing. Permeate is mixed with sodium hypochlorite during the backwashing and the retentate with lifted solids leads to the drain.
After the backwashing period, the fast flush period is applied, when cross-flow velocity is 10-20 times higher than in the usual filtration cycle. The retentate is mixed with feed water again during the usual filtration cycle at the end. It was found out that small particles cause more resistance to flow because of pore blocking. In the article were also summarized operational costs while using the filtration system. Physical and chemical cleaning is optimized during waste water treatment by a statistical factorial design in [4].
In the article the optimization of the cleaning process is performed supplemented by visualization of flow. The tests are carried out on a pilot filtration setup for waste water treatment. The optical method enables to see flow behaviour in a thin laser sheet. The impact of air flow rate, inverse pressure drop and duration on the cleaning mechanism is investigated. Images of the cleaning process are compared to the hydrodynamic data.
2 Experimental setup
The scheme of the filtration setup is seen on Figure 1. Three filter modules are mounted in the filtration chamber. The filter module is composed from a plastic frame, where a membrane is deposited from each side. Contaminated water passes through the membrane into the frame, gets rid of the particles and then it flows from the membrane module out into the measuring cylinder.
Fig. 1. Scheme of the water filtration setup with the laser and the camera (1: Compressed air supply, 2: pressure reducer, 3: Digital air flowmeter, 4: Constant water level, 5: Pressure sensor, 6: Outlet valve for cleaned water, 7: Outlet valve for samples of filtered water, 8: Measuring cylinder, 9: Submerged pump for backflow, 10: digital scale, 11: Digital camera, 12: Outlet valve, 13: Nanofibrous filter modules, 14: Two perforated tubes for air bubbles, 15: Filtration chamber, 16: Laser module.
Pressure drop is caused by a height of water level, which is controlled by the unit HRH-1 and it is constant (500 mm) during the tests. The pressure drop ∆p [kPa] is also constant (5 kPa). Flow Qv [m3/s] through the tested
filters is measured by the digital scale PCB 10000-1. Permeability
������ �∙ ����
m
s ∙ Pa� (1)
is calculated from flow-rate, filter area Af [m2] and pressure drop. Concentration of particles in inlet C1 [ug/l] and outlet C2 is measured by a laboratory nephelometer and the filtration efficiency is calculated according to
�� � �� ���
��� ∙ �������. (2)
Continual cleaning of the filters is performed by air bubbles and also by reverse flow, which is generated by a small submerged pump supplied by 6 V. Inverse pressure on the filter is measured by GMSD 350 MRE, Greisinger. Compressed air leads to two perforated tubes mounted under filter frames. Air bubbling avoids growing of a thick filtration cake on the inlet side of tested filters. Air flow measured by Testo 6441 is stopped only during the visualisation process because of better visibility.
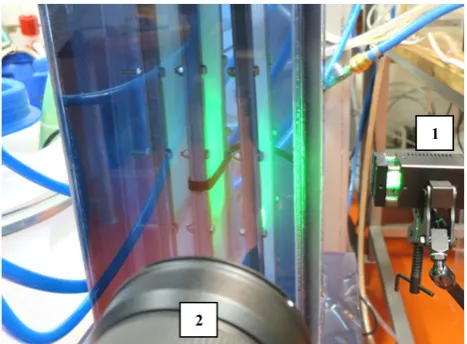
The cleaning process is investigated in the filter chamber made from transparent plexiglass seen on Figure 2. The inlet side of a tested filter is illuminated by the laser sheet generated by Powell lens (30°) and LED laser module (532 nm, 121 mW). Power of the laser unit was measured by the device LabMaster Ultima v. 2.35 with an attenuator 1:1000. The illuminated flow was taken by the digital camera (Pike F-210B/C, 50 fps, 1920 × 1080 px) equipped by lens (Samyang 35 mm, F1.4).
Fig. 2. Picture of the filtration chamber with a laser unit (1) and a digital camera (2).
3 Experimental and results
3.1 Materials and methods
The tested nanofibrous filter is made of polyamide and the support layer is made of polyester. The nanofibrous layer is made by the electrospinning technique and it was pressed on the support layer via a polymer mesh. The
2
mean pore size is 0.5 µm and the maximum pore size is 0.9 µm. An active area of the one filter module is 0.2 m2 then the used three modules have the total active area 0.6 m2. Air permeability is 7 – 10 m/s·Pa.
Distilled water was used with added artificial particles (Bang Laboratories Inc.), which are easier to detect and to visualize compared to the bacteria in real waste water. Size of the particles was chosen considering scattering sufficient amount of light in a laser sheet as well as being small enough to simulate most of bacteria in water. According to the Mie theory [10] the 0.29, 0.54, 0.75 and 1 µm monodisperse polystyrene microspheres are the most suitable, because they occur in the local maximums of the scattering diagram Figure 3. The scattering curve was made in software MiePlot for the scattering angle 90° [11]. Refractive index for water is 1.334 and for polystyrene (testing particles) is 1.595. Size of the most bacteria in wastewater is over one micrometer, the 0.96 µm polystyrene microspheres were chosen as model testing particles [12].
Fig. 3. Scattering diagram for polystyrene spherical particles in water generated by MiePlot software [11].
Flow-rate and filtration efficiency was measured during the tests. Permeability was calculated according to (1) from the flow-rate, which was measured by digital scales. Filtration efficiency was calculated according to (2) from mass concentration measured by a nephelometer. Filtration efficiency was measured for the confidence, that the filtration samples are not damaged and the flow-rate is not wrong. Mass concentration of the particles in the feed water was 200 µg/liter. Measured data are compared to the pictures of the cleaning process.
3.2 Air flow-rate
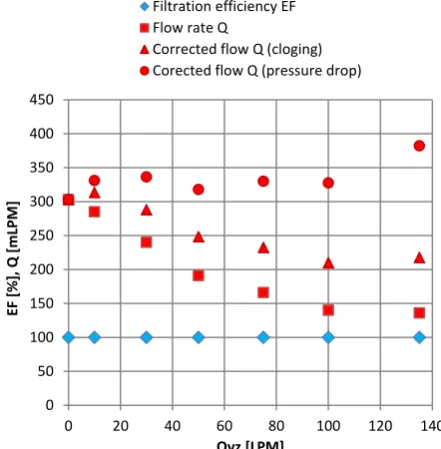
The filter is cleaned by two methods: continuously by air bubbles and every 50 minutes by reverse flow. To find the optimum air flow rate to the bubble maker (perforated tube under the membrane module), the air flow rate was changed from 0 to 135 litres per minute (LPM). The reverse flow was not activated. The graph of forward water flowrate (green dots) versus air flowrate is seen on Figure 4. Data in the graph were measured every hour. The measured flowrate was corrected because of clogging
of the membrane in time (10 % per hour) and influence of air bubbling to water level, to pressure drop and to forward water flow rate (0.56 % per 1 LPM of air flow rate) in our pilot setup. From the graph is seen that the membrane permeability is not sensitive on the air flowrate (bubbling) in a short term of filtration process. The minimum air flowrate was chosen on 30 LPM, it is 50 LPM of air per 1 m2 of active filter area. According to the direct observing (Figure 5), the all filter modules were in touch with air bubbles to avoid of growing of a dense filtration cake. The filtration efficiency was 100 %.
Fig. 4. Graph of the water flowrate versus flowrate of air.
Fig. 5. Image of a filtration module during air flow rate 30 LPM.
3.3 Inverse flow
We can see from the graph on Figure 6, that it is not possible to use higher inverse pressure drop than 15 kPa. Otherwise the membrane is damaged (lower filtration efficiency indicates it). From the graph it is also seen that
0 50 100 150 200 250 300 350 400 450
0 20 40 60 80 100 120 140
EF
[%],
Q
[mLPM]
Qvz [LPM]
Filtration efficiency EF Flow rate Q
the flowrate after the cleaning process is not changed that much depending on applied inverse pressure drop.
Fig. 6. Graph of the filtration efficiency and the flowrate versus inverse pressure drop on filter (particles: 0.5 µm, duration: 24 hours, active filtration area: 0.2 m2).
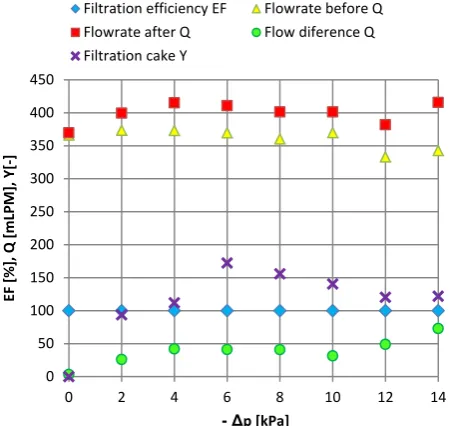
In the second graph on Figure 7 we focused on the inverse pressure drop in range from 0 to 15 kPa and we measured data again in more detail. The measurement was accompanied by visualization helping to find the optimum conditions. We can see from the graph a flow difference (flow after cleaning minus flow before cleaning) versus applied inverse pressure drop. In case of zero inverse pressure drop the membrane was not cleaned and the flow difference was 0.
Fig. 7. Graph of the filtration efficiency, flowrate and digital grey value versus inverse pressure drop on the filter (particles: 0.96 µm, duration: 50 minutes, active filtration area: 0.6 m2). The first image from the Figure 8 confirms the fact of insufficient cleaning. There is no evidence of removing of the filtration cake from the inlet side of the tested filter. The higher applied inverse pressure drop is the higher flow difference is and the more removed particles are observed. The local maximum is seen
between 4 and 8 kPa of the inverse pressure drop. The optimum inverse pressure drop has to be high enough to remove filtration cake properly. On the other hand for ensuring safety of the membrane (concerning of the mechanical robustness), the optimum inverse pressure drop was chosen as a minimum value from the range: 4 kPa.
Fig. 8. Eight images of inlet side of a filter during cleaning process by reverse flow (influence of a value of inverse pressure drop).
3.3 Duration of the inverse flow
Influence of the duration of the applied inverse pressure drop is seen in graph on Figure 9. The flow difference grows with higher duration with the local maximum around 1 hour.
Fig. 9. Graph of the filtration efficiency and the flowrate versus duration of applied inverse pressure drop (inverse pressure drop: 4 kPa).
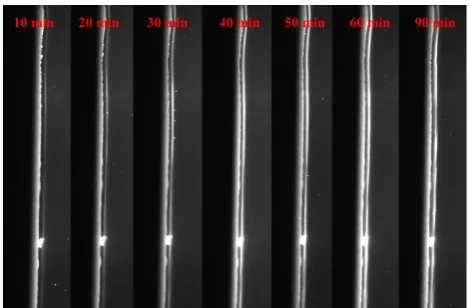
It is seen from the images on Figure 10 that the longer time the filter is not cleaned, the more particles are removed (deposited). The limitation of the process is in irreversible clogging. If the filter is not cleaned sufficiently often, the filtration cake becomes compacted and it is more complicated to remove it completely. The irreversible clogging indicates the declination of 0
10 20 30 40 50 60 70 80 90 100
5 10 15 20 25 30
EF
[%],
Q
[mLPM]
-∆p [kPa]
Filtration efficiency Flowrate after Flowrate before Flow difference
0 50 100 150 200 250 300 350 400 450
0 2 4 6 8 10 12 14
EF
[%],
Q
[mLPM],
Y[
‐
]
-∆p [kPa]
Filtration efficiency EF Flowrate before Q Flowrate after Q Flow diference Q Filtration cake Y
0 50 100 150 200 250 300 350 400 450 500 550 600
10 20 30 40 50 60 70 80 90
EF
[%],
Q
[mLPM],
Y[
‐
]
t [min]
Filtration efficiency EF Flowrate before Q Flowrate after Q Flow diference Q Filtration cake Y
0 kPa 2 kPa 4 kPa 6 kPa 8 kPa 10 kPa 12 kPa 14 kPa
the flowrate (red dots). The optimum duration shifts because of irreversible clogging to the lower values and it is in rage from 30 to 50 minutes.
Fig. 10. Seven images of the inlet side of a filter during cleaning process by reverse flow (influence of a duration of applied inverse pressure drop).
4 Conclusion
The cleaning process is a very important part of the filtration process which limits the growth of the filtration cake, improves hydrodynamic properties and extends lifetime of the filter. In the article the optimization of the cleaning process was carried out supplemented by visualization of flow. The tests were carried out on a pilot filtration setup for waste water treatment. Model water was used instead of real waste water because of visibility and easier analysis of filtration efficiency. The model water was composed from distilled water with polystyrene particles, size was 0.96 µm, concentration was 500 µg per litre. The impact of air flow rate, inverse pressure drop and duration on the pressure drop was investigated. Images of the cleaning process were obtained and compared to the hydrodynamic data.
Air bubbles clean the filter surface all the time during filtration. From the hydrodynamic data is seen (Figure 4) no significant influence of the bubbling intensity to the forward flow in short term perspective. The optimum air flow rate was chosen with reference to covering whole the surface by air bubbles. The optimum air flow rate related to the active filtration area is 50 LPM per m2.
The second cleaning method applied during filtration is reverse flow caused by inverse pressure drop. It was found out that the higher applied inverse pressure drop was the higher flow difference was indicated and the more removed particles were observed (Figure 7 and 8). The local maximum was found between 4 and 8 kPa for the inverse pressure drop. With reference to the mechanical robustness of the nanolayer the minimum value from the range: 4 kPa was chosen. Another parameter: duration of the inverse pressure drop was optimized. The flow difference grew with higher duration about the local maximum around 1 hour (Figure 9). Considering the irreversible clogging the optimum duration was chosen on 30 minutes.
The optical method enables to see flow behaviour in a thin laser sheet. Amount of removing particles is possible to determine on the basis of image analysis.
Visualization of the cleaning process completes information about the flow rate and the filtration efficiency and proofs rightness of the measured hydrodynamic data.
Acknowledgments
The results of this project LO1201 were obtained through the financial support of the Ministry of Education, Youth and Sports in the framework of the targeted support of the “National Programme for Sustainability I”.
References
1. Ng, K.-K., Wu, C.-J., Yang, H.-L., Panchangam, S.C., Lin, Y.-C., Hong, P.-K.A., Wu, H., Lin, C.-F. Effect of Ultrasound on Membrane Filtration and Cleaning Operations (2012) Separation Science and Technology (Philadelphia), 48 (2), pp. 215-222 2. Madaeni, S.S., Tavakolian, H.R., Rahimpour, F.
Cleaning optimization of microfiltration membrane employed for milk sterilization (2011) Separation Science and Technology, 46 (4), pp. 571-580 3. Bourgeous, K.N., Darby, J.L., Tchobanoglous, G.
Ultrafiltration of wastewater: Effects of particles, mode of operation, and backwash effectiveness (2001) Water Research, 35 (1), pp. 77-90
4. Chen, J.P., Kim, S.L., Ting, Y.P. Optimization of membrane physical and chemical cleaning by a statistically designed approach (2003) Journal of Membrane Science, 219 (1-2), pp. 27-45
5. Chen, V., Li, H., Fane, A.G. Non-invasive observation of synthetic membrane processes - A review of methods (2004) Journal of Membrane Science, 241 (1), pp. 23-44
6. Knutsen, J.S., Davis, R.H. Deposition of foulant particles during tangential flow filtration (2006) Journal of Membrane Science, 271 (1-2), pp. 101-113
7. Mendret, J., Guigui, C., Schmitz, P., Cabassud, C., Duru, P. An optical method for in situ characterization of fouling during filtration (2007) AIChE Journal, 53 (9), pp. 2265-2274
8. Vanysacker, L., Declerck, P., Vankelecom, I. Development of a high throughput cross-flow filtration system for detailed investigation of fouling processes (2013) Journal of Membrane Science, 442, pp. 168-176
9. Zhong, Z., Li, F., Xing, W. Fouling formation and removal in the microfiltration of Mg(OH)2 suspension with ceramic membrane (2013) Desalination, 325, pp. 132-137
10. Hulst H G van de 1957 Light Scattering by Small Particles Willey New York p 470 ISBN: 0-486-64228-3
11. Laven P MiePlot software [online: 30.1.2017] URL: http://www.philiplaven.com/mieplot.htm
12. Spellman F R, Handbook of water and wastewater treatment plant operations, CRC Press 2009, p 826, ISBN: 13-978-1-4200-7530-4