Design and Optimization of Dynamic Test Samples for Ductile
Damage Assessment
Marco Sasso1,*, Edoardo Mancini2, Luca Cortese3,and Filippo Nalli4
1 Department of Industrial Engineering and Methematical Sciences, Università Politecnica delle Marche, Ancona - Italy 2Università degli Studi eCampus, Novedrate - Italy
3Department of Mechanical and Aerospace Engineering, Sapienza University of Rome - Italy 4Faculty of Science and Technology, Free University of Bozen-Bolzano - Italy
Abstract. The present research aims at assessing and comparing the damage evolution in a structural steel, mainly used in pipeline applications, both under quasi-static and dynamic conditions. Accordingly to the core of the literature related to plastic damage modelling, two key parameters must be controlled in the tests: the stress triaxiality and the Lode angle, both depending on the stress state. Either strongly affect the material strain to failure. Hence, different specimen geometries are needed to test the material in the desired ranges of these parameters. In this work, three kinds of geometries typically used in static tests, i.e. round and notched cylindrical, and thin rectangular, have been considered and adapted to an available Hopkinson bar facility. The shape of the specimens (diameter, fillet/notch radius, thickness, gauge length) and the incident pulse intensity have been studied within a multi-objective optimization scheme, in order to achieve similar strain rates for the three kinds of tests, with nearly constant time histories of strain rate, triaxiality and Lode angle during deformation. More specifically, the adopted solutions permitted to achieve an average strain rate of 3500 s-1, with varying triaxialities from 0.5 to 1.2, Lode angles from 0.5 to 1 and strains to failure from 0.8 to 1.5.
1 Introduction
The paper deals with the design of specimen geometries for Split Hopkinson Bar (SHB) testing, to study of the evolution of ductile damage and its main parameters under dynamic loading conditions. The aim is to assess the influence of strain rate on the constitutive behaviour and failure of a structural steel Grade X65. The starting point of the present analysis is a damage model deriving from a formulation from Wierzbicki [1], which was introduced in [2] and applied to the investigated material subjected to quasi-static multi-axial loading conditions [3]. For the class of damage models the proposed one belongs to, the strain to failure is considered a function of stress triaxiality and Lode angle [1, 4, 5], two scalar parameters related to the stress invariants. To investigate their effect and calibrate the model, different stress paths are needed. This is accomplished adopting different sample geometries and facilities, to apply multiaxial loading conditions characterized by differing values of triaxiality and Lode angle. Tests are usually tensile ones on round and notched cylindrical specimens, torsion ones, or even biaxial. In any case they are normally executed in quasi static conditions. Very few works can be found in the literature where impact conditions are considered [6]. Under dynamic loads, a further parameter, the effective strain rate, has an influence and must be accounted for. Additional limitations may arise,
due to the experimental method used in the dynamic tests. In planning and running dynamic tests then, for a fair comparison of the results among the different stress paths, the same strain rate should be used, and the parameters under investigation should be as much constant as possible. Moreover, since the damage and the consequent failure are local phenomena, what need to be controlled are the damage parameters and the effective strain rate at the expected failure initiation point. As a consequence, the analysis cannot be performed only experimentally, but a mixed numerical-experimental procedure is required to retrieve the not measurable local quantities of interest. In this work, an optimization procedure has been devised and implemented in order to identify the dimensions and proportions of suitable samples that will lead to the most desirable stress and strain evolution paths within the samples during the dynamic test. The procedure, the optimized results and potentiality of the methodology will be reported in details. The experimental-numerical match based on preliminary tests will be finally presented and discussed.
2 Dynamic test method
Fig. 1. Split Hopkinson Tension Compression Bar.
The bars have a diameter of 18 mm, with a M12 threaded hole at the input and output bar extremities to grip the tensile specimen.
Under the assumption of uniaxial wave propagation within the bars and stress equilibrium within the sample, the simplified Hopkinson formulas for computing the load P and deformation ε of the tested samples are given by:
(1a)
(1b)
(1c)
where Ab, Eb and Cb represent the cross section area, the Young modulus and the sound speed of the bars, respectively; L0 is the initial length of the sample, and εR and εT represent the reflected and transmitted waves measured by the strain gauges. It is expressly noted that the sample strain ε, provided by the equation (1c) is a mere engineering value and, especially for the present work, it is more significant referring to the specimen deformation ∆:
(2)
3 Test sample geometries
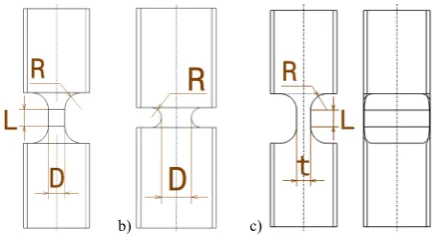
In this work, three specimen geometries have been used, aiming at achieving a sufficient variety of stress triaxialities (T) and Lode angles (X). The geometries were basically modifications of the ones used for quasi-static tests, intended at obtaining similar stress states and also to adapt to the equipment available for dynamic testing, i.e. the direct SHB previously described. The geometries are: 1) cylindrical, 2) round notched, 3) flat grooved; the first is to achieve a stress state close to uniaxial, the second to induce a high triaxiality, the third is to obtain a plane strain condition, characterized by a low X value close to zero (for the
these kind of samples, that were used in a previous work [3], is given in Figure 2.
Fig. 2. Dimensions of test samples used for quasi static tests, a) cylindrical, b) round notched, c) flat grooved.
These geometries constituted the basis for the design of the new ones to be tested on the Hopkinson bar. The dynamic test samples must meet the geometrical requirement for being mounted on the experimental facility i.e. they must have M12 threaded fixture parts; moreover they must have proper length and section size in order to be successfully tested with the maximum stroke and force available at the SHB. An example of the prospective proportions and end parts of the geometries is reported in Figure 3.
a) b) c)
4 Evaluation of temporal evolution of
parameters from static FEA
The optimization requires several finite element simulations, to be performed with the FE commercial code Ansys. In order to reduce the computational time, static structural simulations have been carried out, whose mesh and boundary conditions are illustrated in Figure 4. The cylindrical and round notched sample models are 2D axisymmetric, while the flat sample model is 2D, plain strain. The plastic flow curve of the material is taken from [3], increased by a factor 1.08 to take into account a possible strain rate sensitivity. Whereas the lower edge represents the symmetry plane, a positive axial displacement is applied to the upper edge. Examples of the resulting numerical load-displacement curves are given in Figure 5.
Fig. 4. Finite element models of the dynamic test samples, a) cylindrical, b) round notched, c) flat.
Fig. 5. Examples of numerical load-displacement curves for the three specimen geometries from FE analysis.
These load-elongation data have been used in a backward approximate procedure, which has been conceived to estimate the temporal evolution of the effective strain rate, triaxiality and Lode angle, that will be experienced by a sample in an ideal Hopkinson bar experiment. This procedure is basically needed to convert the fictitious time of the quasi-static structural FE analysis into a realistic time vector of the dynamic test.
The load curve can be regarded as a function of the displacement, i.e. P(). From equation (1a), the trend
of the transmitted wave can be estimated; of course, an important difference is that εT will be expressed as a function of the displacement, i.e. εT =εT (), instead of time. Introducing the further hypothesis that the incident wave εI is perfectly constant, the reflected wave can be estimated as well as εR()=εT()–εI . Therefore, using equation (1b), the engineering strain rate experienced by the specimen can be computed as a function of its own displacement, i.e. .
Finally, this information can be used to extract the time increment δt that will be needed in the real experiment to increase the engineering strain by an increment δε=/L0:
(3)
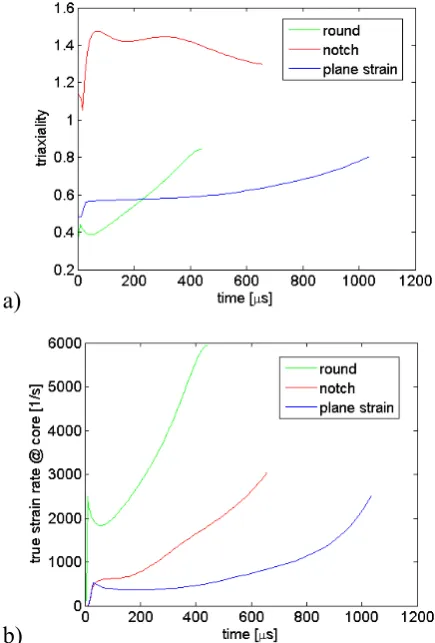
Since the values of δε are known, being imposed in the FEM simulations, the time vector can be reconstructed as the cumulative sum of δt. The time vector is cut at 1.0 ms, which roughly corresponds to the time length of the incident pulse in the adopted SHB. Example of the estimated temporal evolution of triaxiality and strain-rate at the specimen core, with a generic combination of geometric parameters, are given in Figure 6.
a)
b)
Analogously, the Lode angle can be computed as well. Obviously, these trends cannot match perfectly with the real ones; consider, for instance, that the incident wave raising ramp has not been modelled in the procedure. However, this and other approximations are likely to affect in a similar manner all the three tests, so that the comparison can be considered significant.
5 Geometry optimization
The optimization of the most important geometrical parameters of Figure 3 took into account the SHB testing parameters and features, and was aimed at achieving as much as possible:
- A close strain rate among the three different geometries.
- A constant equivalent plastic strain rate at the specimen core during plastic deformation.
- A constant triaxiality at the specimen core during plastic deformation.
- A much higher triaxiality in the round notched specimen than in the cylindrical and flat ones, and a low Lode parameter for the flat grooved.
The last point makes the test effective for a proper calibration of the damage model, as explained in [2,3]. Moreover, the maximum expected effective strain ϵ at the critical point of the samples was designed to be greater than the corresponding experimental value obtained in quasi static tests; this latter requirement, which had be fulfilled with a certain safety margin, is needed to guarantee the actual failure of the sample in the dynamic tests. More in detail, the input parameters that have been varied are:
- Section diameter for cylindrical and round notched specimens, thickness for the flat one.
- Gauge length. - Fillet radii.
- Incident wave amplitude.
For each of the three different types of geometry a full factorial Design of Experiment plane has been simulated, varying the input parameters on several levels; about 150 simulations have been carried out for each geometry type.
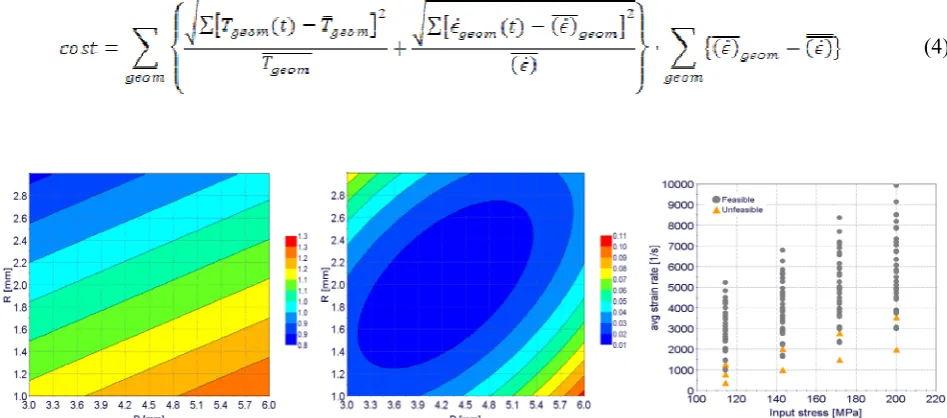
The output parameters of each simulation are the time average of the effective strain rate and of the triaxiality, as well as their variance over time. As examples, Figure 7a and Figure 7b illustrates the trend of the average triaxiality and its variance in round notched samples, as reconstructed by a polynomial response surface in function of diameter and notch radius; Figure 7c illustrates the time average of the effective strain rate obtained from all the FE simulations of the round notched geometry; the yellow triangles denote the simulations that failed the feasibility constraint.
These configurations must be discarded since they are predicted to reach a maximum equivalent strain to failure lower than its corresponding value in quasi-static condition (0.86).
The goal of the optimization was to select the combination of input parameters that minimizes a cost function given by the summation of all the variances (among geometries and along time), and simultaneously fulfil the feasibility constraint. The cost function is given by equation (4), where the upper bar denotes the time average and the double upper bar denotes the average among the different geometries, i.e. cylindrical, round notched, flat.
(4)
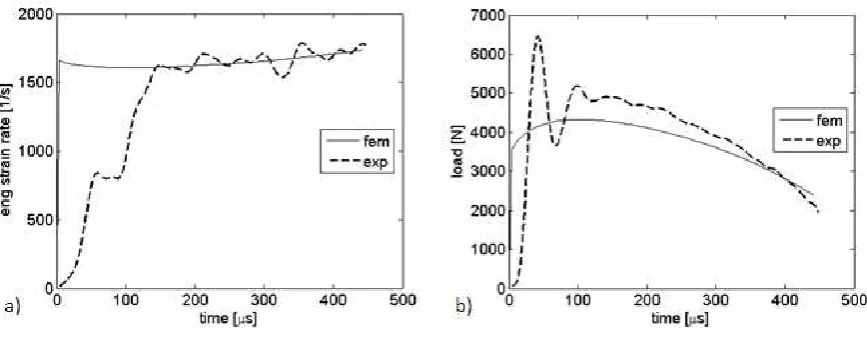
Fig. 8. Temporal evolution of strain rate (a) and load (b) for the cylindrical geometry; solid lines represent numerical results, dashed lines represent experimental results.
6 Results
The geometric parameters that minimized the cost function given by eq. (4) are summarized in table 1:
Table 1. Parameters resulting from the optimization.
Geometry
type Diam/thick [mm] Length [mm] [mm]Fillet Wave Amp [MPa]
Cylindrical 3 3 3 115
Notched 4.5 - 1.5 145 Flat 2.5 3 3 200
SHB preliminary experiments have been carried out on cylindrical geometries, obtaining the load-time curves shown in Figure 8a, where also the corresponding numerical curves are reported. On the other hand, the temporal evolutions of the experimental, as measured by eq. (1a), and numerically estimated strain rate are given in Figure 8b. It is observed that the trend of the load histories estimated by the numerical model are quite similar to those acquired experimentally, exception made for an initial time lag; this is due to the simplification made in the analytical model, where the incident wave has been approximated as an ideal step function, whereas the raise time of real incident waves is not negligible. If properly shifted in time, the numerical curves matches very well with the experimental ones, suggesting that the results from FE analyses can be used to gather realistic information on the strain rate and damage evolution at the core of the samples. Further experiments on the other geometries are still work in progress and will be presented in a future work.
7 Conclusions
A procedure to design proper specimen geometries for ductile damage assessment through Split Hopkinson bar dynamic testing is presented. The main goal was to determine the influence of strain rate on damage accumulation and final fracture. To this purpose, the proposed optimization scheme aimed at the proper dimensioning and proportioning of the samples to control the strain rate as well as damage influencing parameters. The designed specimens have then been realized and tested, and the collected experimental results have been compared with the corresponding FE ones showing a fair accuracy.
References
1. T. Wierzbicki, Y. Bao, Y.W. Lee, Int. J. Mech. Sci. 47: 719–743 (2005)
2. T. Coppola, L. Cortese, P. Folgarait, Eng. Fract. Mech., 76: 1288-1302 (2009)
3. L. Cortese, T. Coppola, F. Campanelli, F. Campana, M. Sasso, Int. J. Damage Mech. 23, 1: 104-123 (2014)
4. P.W. Bridgman, Studies in large plastic flow and fracture, McGraw-Hill, NY (1952)
5. X. Gao, G. Zhang, C. Ore, Int. J. Damage Mech.
19: 75-94 (2010)
6. M. Kumara, U. Deep, P.M. Dixt, Procedia Eng.
173: 190-197 (2017)