142
Kidney Disease Classification based on
using Machine Learning using Digital
Image Processing
L.Vishnuvarthini Dr. S.Malarkhodi Student, Dep of ECE, Professor, Dep of ECE, K.S.Rangasamy College of Technology, K.S.Rangasamy College of Technology,
Anna University,Chennai. Anna University,Chennai. E-mail Id:[email protected] E-mail Id: [email protected]
Abstract --The kidney diseases are of two main stages namely Chronic Kidney Diseases (CKD) and Acute Kidney Injury (AKI). The prevalence of chronic kidney diseases will gradually increase if they are not properly treated. The best way to reduce death caused by kidney disease is early prophylaxis and treatment, and which could be achieved through accurate and reliable diagnoses at the early stage. Kidney disease may initiate serious health hazards namely diabetes, blood pressure, pulmonary hypertension and other cardio vascular diseases. Ultrasound imaging technique play a crucial role in emergency diagnostic method. It is widely used due to its non invasive inexpensive availability and non radiation exposure. The main intention of this work is the automatic detection and classification of various diseases such as stone, cyst and cancer masses present in the pelvic region of the kidney. For this research work three main methods are proposed. The first method employs the segmentation using adaptive K means. The second method is feature extraction using statistical and texture. The final method is the modeling of various kidney diseases using Artificial neural network (ANN). The Small part of the Proposed algorithm is implemented on a Altium Nanoboard 3000 Series.
Keyword- Chronic Kidney Disease, Acute Kidney Injury, Ultrasound Imaging, Adaptive K, Statistical and Texture, Artificial Neural Network.
I INTRODUCTION
Kidney disease is a common disease with serious problems. Slow kidney damage occurs usually in case of diabetes, high blood pressure, etc. This is termed as chronic kidney disease. When a person is sick it can so happen that the kidney gets injured with sudden changes in the cause, or by consuming certain medications, and this is called as acute kidney injury [1]. This usually takes place with a person having normal kidneys or to a person who has kidney problems. The main factors identified as cause for the disease are: High blood pressure, Diabetes, Cardiovascular (heart and blood vessel) disease, hereditary records on kidney failure. Chronic kidney disease (CKD) is a medical condition where the kidneys are damaged and blood cannot be filtered. In the end-stage of the disease the renal disease (CKD), renal function is severely damaged. Around 10% of the population in the world suffers chronic kidney disease (CKD), leading to millions of deaths every year.. Some of the risk factors that can be defined are cirrhosis, bladder cancer, kidney cancer, kidney stones and kidney infection.
II PROPOSED SYSTEM
143
III BLOCK DIAGRAM
Figure 1 Block Diagram of Proposed Method
A) IMAGE ACQUISITION
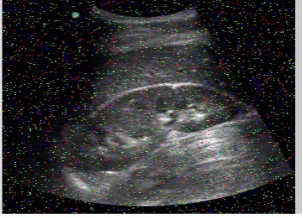
Image Acquisition Toolbox simplifies the acquisition process by providing a consistent interface across hardware devices from matlab and simulink. A ultrasonic kidney image database of different size is collected. It can be a colour image or black and white image. The collected image is given as input and it is used for further processing.
IMAGE PREPROCESSING
SEGMENTATION
FEATURE EXTRACTION
CLASSIFICATION
SEVERITY ANALYSIS
Image Resize
Colour Conversion
Noise Removal using
Median Filter
INPUT IMAGE ACQUISITIONAdaptive K
Statistical and Texture
144
(a)
(b)
Figure 2 a) Normal and b) Abnormal kidney images
B) IMAGE PREPROCESSING
In preprocessing section, the input image may be in different size, contains noise and it may be in different colour combination. These parameters need to be modified according to the requirement of the process. Image noise is most apparent in image regions with low signal level such as shadow regions or under exposed images. There are so many types of noise like salt and pepper noise, film grains etc., All these noise are removed by using filtering algorithms. Among the several filters, weiner filter is used. In preprocessing module image acquired will be processed for correct output. Pre-processing was done by using some algorithm. For all images the pre-processing should be done so that the result can be obtained in the better way.
Figure 3 the salt and pepper noisy images
Four categories of image pre-processing methods according to the size of pixel neighborhood that is used for the calculation of new pixel brightness:
1). Pixel brightness transformations 2). Geometric transformations
3). Pre-processing methods that use a local neighbourhood of the processed pixel. 4). Image restoration that requires knowledge about the entire image
C) SEGMENTATION PROCESS
Image segmentation0T0Tis the process0T0Tof partitioning a digital0T0Timage0T0Tinto multiple segments (sets of
pixels, also known as super-pixels). The goal of0T0Tsegmentation0T0Tis to simplify and/or change the representation of
an0T0Timage0T0Tinto something that is more meaningful and easier to analyze. Image segmentation is typically used to
145
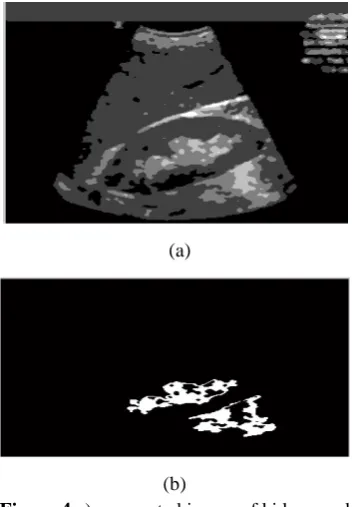
a)Adaptive k-means clustering segmentation
The adaptive K-means clustering algorithm starts with the selection of K elements from the input data set. The K elements form the seeds of clusters and are randomly selected. The properties of each element also form the properties of the cluster that is constituted by the element.
(a)
(b)
Figure 4 a) segmented image of kidney and b) affected region of kidney
D) FEATURE EXTRACTION a) Statistical features
Statistics is the study of the collection, organization, analysis, and interpretation of data. It deals with all aspects of this, including the planning of data collection in terms of the design of surveys and experiments. This is the meaning of statistics. Statistical feature of image contains
• Mean
• Variance
• Skewness
• Standard deviation
b) GRAY-LEVEL CO-OCCURRENCE MATRIX (GLCM)
Texture Analysis Using the Gray-Level Co-Occurrence Matrix (GLCM). A statistical method of examining texture that considers the spatial relationship of pixels is the gray-level co-occurrence matrix (GLCM), also known as the gray-level spatial dependence matrix [5].
Typical compromise: 16 gray levels and window size of 30 or 50 pixels on each side. Now we can analyze • maximum probability entry
• element difference moment of order k: P i P j (i − j) k cij This descriptor has relatively low values when the high values of C are near the main diagonal. For this position operator, high values near the main diagonal would indicate that bands of constant intensity running “1 pixel to the right and 1 down” are likely. When k = 2, it is called the contrast:
• Contrast = P i P j (i − j) 2 cij (1)
• Entropy = − P i P j cij log cij (2)
This is a measure of randomness, having its highest value when the elements of C are all equal.
146
• Homogeneity = P i P j cij 1+|i−j| (4) (large if big values are on the main diagonal)
E) CLASSIFICATION
In order to classify a set of data into different classes or categories, the relationship between the data and the classes into which they are classified must be well understood. To achieve this by computer, the computer must be trained [4]
♦ Training is key to the success of classification
♦ Classification techniques were originally developed
Features are attributes of the data elements based on which the elements are assigned to various classes. 1).The image classifier performs the role of a discriminant - discriminates one class against others. 2).Discriminant value highest for one class, lower for other classes (multiclass)
3).Discriminant value positive for one class, negative for another class (two class).
a) Neural Network
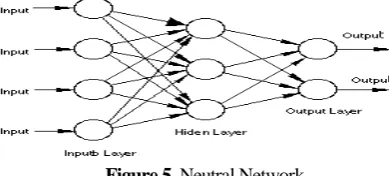
We use the Machine learning method Artificial Neural Network for classifying the age using extracted features.A neural network has several inputs, hidden, and output nodes. Each node applies a function some data (could be softmax, linear, logistic), and returns an output. Every node in the proceeding layer takes a weighted average of the outputs of the previous layer, until an output is reached.
Figure 5 Neutral Network
Artificial neural networks are relatively crude electronic networks of neurons based on the neural structure of the brain. They process records one at a time, and learn by comparing their classification of the record (i.e., largely arbitrary) with the known actual classification of the record.
A neuron in an artificial neural network is
1. A set of input values (xi) and associated weights (wi).
2. A function (g) that sums the weights and maps the results to an output (y).
Neurons are organized into layers: input, hidden and output. The input layer is composed not of full neurons, but rather consists simply of the record's values that are inputs to the next layer of neurons. The next layer is the hidden layer. Several hidden layers can exist in one neural network. The final layer is the output layer, which has one node for each class.
b) Training an Artificial Neural Network
In the training phase, the correct class for each record is known (termed supervised training), and the output nodes can be assigned correct values -- 1 for the node corresponding to the correct class, and 0 for the others. It is thus possible to compare the network's calculated values for the output nodes to these correct values, and calculate an error term for each node (the Delta rule). These error terms are then used to adjust the weights in the hidden layers so that, hopefully, during the next iteration the output values will be closer to the correct values.
c) The Iterative Learning Process
147
Figure 6 classification result
F) SEVERITY ANALYSIS
Severity of the disease is analyzed based on the affected area of the kidney.
Figure 7 Severity Analysis
IV ALTIUM NANOBOARD
The implementation uses Altium Nanoboard 3000XN development board with Xilinx variant, incorporating a Xilinx Spartan-3AN device (XC3S1400AN-4FGG676C) as the User FPGA. Reconfigurable hardware can be achieved by using softcore processor implemented on the FPGA. Many FPGAs implementations are tightly coupled to HDL language specific platform. But Altium Nanoboard overcomes this by offering a programmable hardware platform that is reconfigurable, and also vendor independent. Altium Designer provides the ability to encapsulate an entire FPGA circuit into a single component that can be used as a building block in other projects.
V CONCLUSION
The main goal of this project is to discover an effective indicator which can assist physicians to identify different stages of CKD. Though these ultrasonic images degraded by multiplicative noise are blurred in low resolution, observation from the clinical images has clearly shown that the transition locations of white-to-black ratio within a renal organ are proportional to the stages of CKD patients. The patients with earlier stages of CKD possess higher values of white-to-black transition indicator than the patients at his/her ending stages. Small part of the block is implemented in Altium Nanoboard 3000 series.
VI ACKNOWLEDGEMENT
This Project is supported by Department of Science and Technology under FIST Program.
VII REFERENCES
1. Zilong Hu, Jinshan Tang Cluster” Driven Anisotropic Diffusion for Speckle Reduction in Ultrasound Images,” In Proc. IEEE International conference for image processing, Aug 2016, pp. 2325-2329.
2. Jinhua Yu, JingluTan, YuanyuanWangb “Ultrasound speckle reduction by a SUSANcontrolled anisotropic diffusion method,” Elsevier Trans. Pattern recognition, vol. 43, Sep 2010, pp. 3083-3092.
3. Wilfrido g_omez flores, wagner coelho de albuquerque pereira, And antonio fernando catelli infantosi, “Breast ultrasound despeckling using anisotropic diffusion Guided by texture descriptors,” Elsevier Trans. Ultrasound in Medicine and Biology vol. 40, issue. 11, Sep 2014, pp. 1-13,
148
5. F. Dehghan, H. Abrishami-Moghaddam, M. Giti,” Automatic Detection of Clustered Microcalcifications in Digital Mammograms: Study on Applying Adaboost with SVMbased Component Classifiers,” In Proc IEEE 30th Annual International Conference Engineering in Medicine and Biology Society, Aug 2008, pp. 4789-4792. 6. Meichelboeck W, “End Stage Renal Disease (ESRD) Epidemiolog – Where are we going?”, 7th International Congress of the Vascular Access Society, 2011.