Clinical Ophthalmology
Comparison of Placido disc and Scheimpflug
image-derived topography-guided excimer laser surface
normalization combined with higher fluence CXL:
the Athens Protocol, in progressive keratoconus
Anastasios John Kanellopoulos1,2 George Asimellis1
1Laservision.gr Eye Institute, Athens,
Greece; 2New York University
School of Medicine, Department of Opthalmology, NY, NY, USA
Correspondence: A John Kanellopoulos Laservision.gr Institute, 17 Tsocha Str, 11521, Athens, Greece
Tel +30 210 747 2777 Fax +30 210 747 2789 Email [email protected]
Background: The purpose of this study was to compare the safety and efficacy of two alternative corneal topography data sources used in topography-guided excimer laser normalization, combined with corneal collagen cross-linking in the management of keratoconus using the Athens protocol, ie, a Placido disc imaging device and a Scheimpflug imaging device.
Methods: A total of 181 consecutive patients with keratoconus who underwent the Athens protocol between 2008 and 2011 were studied preoperatively and at months 1, 3, 6, and 12 postoperatively for visual acuity, keratometry, and anterior surface corneal irregularity indices. Two groups were formed, depending on the primary source used for topoguided photoablation, ie, group A (Placido disc) and group B (Scheimpflug rotating camera). One-year changes in visual acuity, keratometry, and seven anterior surface corneal irregularity indices were studied in each group.
Results: Changes in visual acuity, expressed as the difference between postoperative and preoperative corrected distance visual acuity were +0.12 ± 0.20 (range +0.60 to −0.45) for group A and +0.19 ± 0.20 (range +0.75 to −0.30) for group B. In group A, K1 (flat keratometry) changed from 45.202 ± 3.782 D to 43.022 ± 3.819 D, indicating a flattening of −2.18 D, and K2 (steep keratometry) changed from 48.670 ± 4.066 D to 45.865 ± 4.794 D, indicating a flattening of
−2.805 D. In group B, K1 (flat keratometry) changed from 46.213 ± 4.082 D to 43.190 ± 4.398 D, indicating a flattening of −3.023 D, and K2 (steep keratometry) changed from 50.774 ± 5.210 D to 46.380 ± 5.006 D, indicating a flattening of −4.394 D. For group A, the index of surface variance decreased to −5.07% and the index of height decentration to −26.81%. In group B, the index of surface variance decreased to −18.35% and the index of height decentration to −39.03%. These reductions indicate that the corneal surface became less irregular (index of surface variance) and the “cone” flatter and more central (index of height decentration) postoperatively.
Conclusion: Of the two sources of primary corneal data, the Scheimpflug rotating camera (Oculyzer™) for topography-guided normalization treatment with the WaveLight excimer laser platform appeared to provide more statistically significant improvement than the Placido disc topographer (Topolyzer™). Overall, the Athens protocol, aiming both to halt progression of keratoconic ectasia and to improve corneal topometry and visual performance, produced safe and satisfactory refractive, keratometric, and topometric results. The observed changes in visual acuity, along with keratometric flattening and topometric improvement, are suggestive of overall postoperative improvement.
Keywords: Athens protocol, anterior Pentacam indices, keratoconus, cross-linking, WaveLight/ Alcon excimer laser, EX500 excimer laser, higher fluence collagen cross-linking
Dove
press
O r I G I N A L r E S E A r C h open access to scientific and medical research
Open Access Full Text Article
Video abstract
Point your SmartPhone at the code above. If you have a QR code reader the video abstract will appear. Or use:
http://dvpr.es/10PGfio
Clinical Ophthalmology downloaded from https://www.dovepress.com/ by 118.70.13.36 on 21-Aug-2020
For personal use only.
Number of times this article has been viewed
This article was published in the following Dove Press journal: Clinical Ophthalmology
Introduction
Keratoconus is a degenerative bilateral, progressive, noninflammatory disorder characterized by ectasia, thinning,
and irregular topography.1,2 It is associated with loss of visual
acuity particularly in relation to corneal irregularity,3,4 and
usually manifests asymmetrically between two eyes in the
same patient.5,6
Corneal collagen cross-linking (CXL) using riboflavin and ultraviolet A irradiation is an acceptable treatment
option for eyes with progressive keratoconus.7 Laboratory
data suggest that CXL using riboflavin and ultraviolet A irradiation increases stromal collagen fibril diameter,
result-ing in increased corneal biomechanical strength.8 Several
clinical reports indicate that CXL halts progression of
ecta-sia,7,9 improves corneal keratometry, refraction and reduces
higher-order aberrations. Postoperative complications are
infrequent.7 Our team has introduced several variations and
applications of CXL.10,11
We have also reported on sequential partial topography-guided photorefractive keratectomy in conjunction with
the CXL treatment,12 which is a promising approach to
improve topometric and refractive outcomes,13 with good
long-term stability.14,15 Furthermore, we have introduced and
extensively reported16–20 the combination of excimer-laser
debridement of the top 50 µm of the epithelium, partial
topography-guided excimer ablation limited to removal of
a maximum of 50 µm stromal tissue, followed in the same
session by immediate high-fluence ultraviolet A radiation
(5, 6, and 10 mW/cm2) and short-duration (18, 15, and
10 seconds) CXL in a procedure known as the Athens
protocol.21,22 This technique has already been described
in detail.23
This study compared the efficacy of two alternative cor-neal topography data sources used in the topography-guided
part of this procedure with the WaveLight®/Alcon excimer
laser platform (Alcon, Fort Worth, TX, USA), specifically, a Placido disc imaging device and a Scheimpflug imaging device, by analysis of long-term refractive, topometric, and visual rehabilitation changes.
Materials and methods
This study was approved by the ethics committee at our institution, adhered with the tenets of the Declaration of Helsinki. Informed consent was obtained from each subject at the time of intervention using the Athens protocol or at the first clinical visit. The study was conducted in patients visit-ing our clinical practice before the procedure and attendvisit-ing scheduled post-operative visits.
Patient inclusion criteria
The study group consisted of 181 consecutive patients with keratoconus who underwent the Athens protocol between 2008 and 2011. In all procedures, performed by the same surgeon (AJK), epithelial excimer-laser debridement and topography-guided excimer-laser ablation was performed
employing the Alcon/WaveLight 400 Hz Eye-Q laser24 or
the 500 Hz EX500 excimer laser.25,26
To be considered for the Athens protocol, the patient had to meet the following criteria: clinical diagnosis of progressive keratoconus, minimum age 18 years, and minimum corneal
thickness of 300 µm. Patients with systemic disease, previous
corneal surgery, history of chemical injury or delayed epithelial healing, pregnancy, or lactation were not considered for the procedure. All patients included in the study underwent an uneventful Athens protocol using the KXL CXL device (Avedro Inc, Waltham, MA, USA), with higher fluence of
6 mW/cm2 for 15 minutes after a five-minute soak in 0.1%
riboflavin solution (Avedro) and were able to attend our institu-tion for at least one-year of follow-up monitoring.
The consecutive cases were assigned randomly to receive one or the other treatment. Depending on the imaging source used for topography-guided partial photoablation, the
follow-ing two groups were formed: group A (n = 54 eyes), in which
the primary topography data were provided by the Placido
disc imaging device, and group B (n = 127 eyes) in which
the primary topography data were provided by a Scheimpflug imaging device.
Imaging and measurement
The diagnostic Placido disc device used was the Alcon/ WaveLight Allegro Topolyzer™ (WaveLight AG, Erlagen, Germany). The Topolyzer is a wide-cone corneal topographic Placido system with 22 concentric rings for detection of up to 22,000 elevation points. The Placido ring image is refer-enced to the corneal apex and locates the pupil center and the limbus. Automatic measuring release ensures that the image
centration has a peripheral standard deviation of ±4 µm.
The embedded pupil recognition software can measure pupil centroid shift, allowing centration of subsequent laser ablation according to the patient’s visual needs. The Athens protocol based on topographic data from the Topolyzer (group A) is thus referred to as Placido disc-guided, or simply as “Placido”, in which eight acquisitions averaged for consistency are used for each eye.
The Scheimpflug diagnostic device used was the Alcon/WaveLight Oculyzer™ II. The Oculyzer is a high-resolution Pentacam camera (Oculus Optikgeräte
Dovepress
Kanellopoulos and Asimellis
Clinical Ophthalmology downloaded from https://www.dovepress.com/ by 118.70.13.36 on 21-Aug-2020
GmbH, Wetzlar, Germany)27 which is incorporated into the
Alcon/WaveLight Refractive Suite.25 The integrated rotating
Scheimpflug camera acquires up to 50 images in real-time measurement. The Athens protocol was based on data from the Oculyzer (group B), so is referred to as Scheimpflug-guided, or simply “Scheimpflug”, in which four acquisitions averaged for consistency are used for each eye.
Postoperative follow-up assessment was performed by subjective refraction, best spectacle-corrected distance visual acuity measurement with this refraction, and slit-lamp biomicroscopy, as well as anterior segment optical coherence
tomography imaging for clinical signs of corneal CXL.15
Anterior surface topographic indices
To measure and monitor topographic changes in kerato-metric refraction and topographic geometry, quantitative postoperative assessment (measured preoperatively and at months 1, 3, 6, and 12 postoperatively) was performed using the Oculyzer II, obtained and processed via the Oculyzer examination software (Version 1.17 release 47). For each eye, four consecutive measurements were obtained and pro-cessed to test for data repeatability (including topographic,
tomographic, and pachymetric mapping).21
To this end, in addition to keratometric measurements, specific anterior surface indices were studied when used in conjunction with Pentacam camera analysis, developed for grading and classification based on the Amsler–Krumeich
stages of keratoconus,29 as well as the postoperative
assessment.30–36
These indices include the following: index of surface variance (ISV), an expression of corneal surface curvature irregularity; the index of vertical asymmetry, a measure of the difference between superior and inferior corneal curvature; the keratoconus index; the central keratoconus index; the index of height asymmetry, a measurement similar to the index of vertical asymmetry but based on corneal elevation; the index of height decentration (IHD), calculated with
Fourier analysis of corneal height to quantify the degree of vertical decentration; and the minimum radius of curvature, a measurement of the smallest radius of curvature of the
cornea (ie, the maximum corneal steepness).37 In the present
work, 12-month postoperative data were compared with the respective preoperative data.
Linear regression analysis was done to seek possible correlations between changes in these indices and visual rehabilitation. Descriptive and comparative statistics, analysis of variance between keratoconus stage subgroups, and linear regression were performed with statistics tools provided by Minitab version 1.6.1 (MiniTab Ltd, Coventry, UK) and Origin Lab version 9 (OriginLab Corp, Northampton, MA,
USA). Paired analysis P values , 0.05 were considered to
be statistically significant.
Results
The mean ± standard deviation subject age in group A at
the time of the Athens protocol was 31.5 ± 7.9 (19–57)
years and for group B was 33.3 ± 7.3 (21–57) years. Group
A included 16 women and 38 men and group B included 42 women and 85 men. There was a preponderance of males,
which is consistent with our clinical experience15 and
kera-toconus incidence studies.38 In group A, 25 eyes were right
(OD) and 29 left (OS), while in group B, 69 eyes were right and 58 were left.
Changes in visual acuity
Mean preoperative corrected distance visual acuity in
group A was 0.65 ± 0.23 (1.00–0.10) and for group B was
0.63 ± 0.24 (1.00–0.10, Table 1). Changes in visual acuity,
expressed as the difference between postoperative and preoperative corrected distance visual acuity, for group A
were +0.12 ± 0.20 (+0.60 to −0.45) and for group B were
+0.19 ± 0.20 (+0.75 to –0.30).
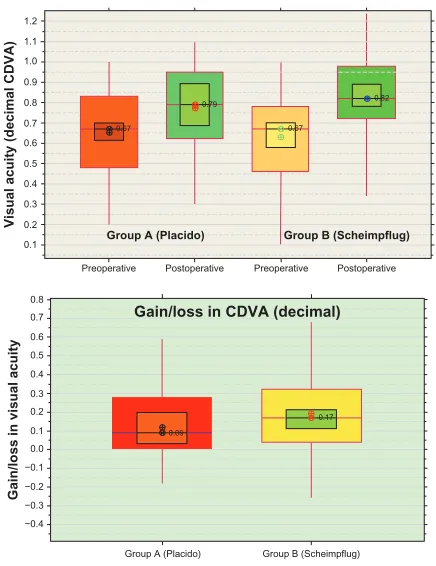
Figure 1 shows the above data in the form of box plots, showing median and mean values with 95% confidence
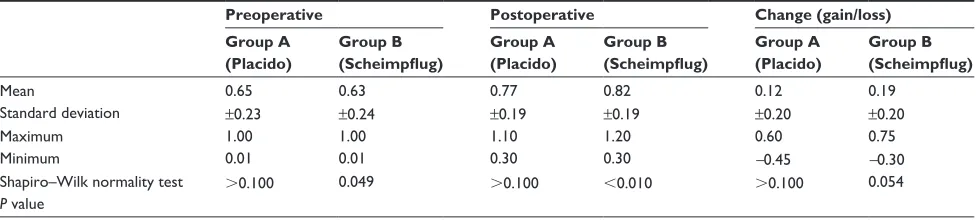
Table 1 Preoperative, 12-month postoperative, and change (gain/loss) in best spectacle-corrected distance visual acuity data, expressed as the difference between postoperative and preoperative corrected distance visual acuity
Preoperative Postoperative Change (gain/loss) Group A
(Placido)
Group B (Scheimpflug)
Group A (Placido)
Group B (Scheimpflug)
Group A (Placido)
Group B (Scheimpflug)
Mean 0.65 0.63 0.77 0.82 0.12 0.19
Standard deviation ±0.23 ±0.24 ±0.19 ±0.19 ±0.20 ±0.20
Maximum 1.00 1.00 1.10 1.20 0.60 0.75
Minimum 0.01 0.01 0.30 0.30 -0.45 -0.30
Shapiro–Wilk normality test P value
.0.100 0.049 .0.100 ,0.010 .0.100 0.054
Dovepress Placido disc versus Scheimpflug imaging in progressive keratoconus
Clinical Ophthalmology downloaded from https://www.dovepress.com/ by 118.70.13.36 on 21-Aug-2020
intervals and interquartile ranges. As shown in Figure 1B, the 95% median confidence interval indicates that 95% of eyes in each group had a positive change (stable or better) in visual acuity.
Distribution of keratometric
and topographic indices
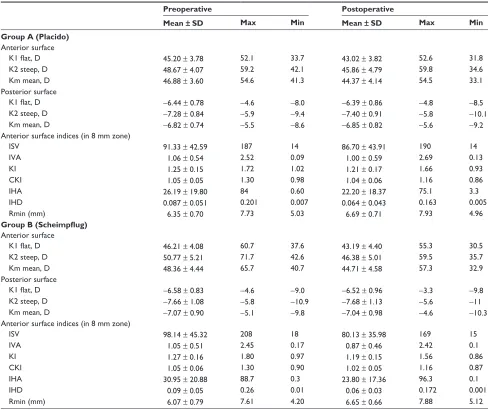
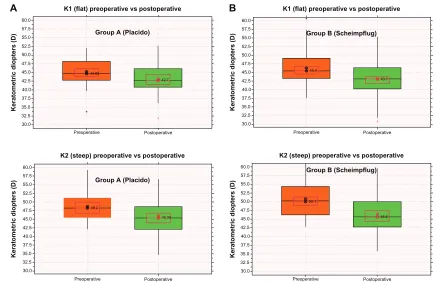
Average, standard deviation, maximum, and minimum anterior and posterior corneal surface keratometric and topo-metric indices, as measured preoperatively and 12 months postoperatively in the 8 mm zone, are presented for both groups in Table 2. Box plots of changes (preoperative versus postoperative values) induced for anterior K1 flat (top) and steep K2 (bottom) keratometry (in diopters, D) for groups A and B are shown in Figure 2A and B, respectively. The changes induced for the seven anterior surface indices are reported for the two groups in Table 3.
Anterior surface keratometry showed the following mean changes (defined as mean postoperative versus respective preoperative values from the data in Table 2). In group A, K1
(flat) changed from 45.202 ± 3.782 D to 43.022 ± 3.819 D,
indicating a change of −2.18 D, and K2 (steep) changed from
48.670 ± 4.066 D to 45.865 ± 4.794 D, indicating a change of
−2.805 D. In group B, K1 (flat) changed from 46.213 ± 4.082
D to 43.190 ± 4.398 D, indicating a change of −3.023 D, and
K2 (steep) changed from 50.774 ± 5.210 to 46.380 ± 5.006 D,
indicating a change of −4.394 D.
Correlation between anterior surface
topographic index and stages
of keratoconus
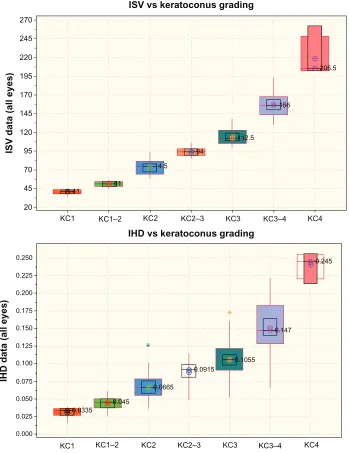
All eyes in each group were classified preoperatively according to the Amsler–Krumeich keratoconus severity index (nil, KC1, KC1–2, KC2, KC2–3, KC3, KC3–4, and KC4) using the Oculus software. We sought correlations between all of the seven anterior surface topographic images with the above grading stages. The correlation between the derived keratoconus severity index and the seven anterior surface topographic indices is shown as box plots in Figure 3. The best correlates with keratoconus stage classification were the index of surface variance (with the exception of the
highest stage, KC4, all other P values , 0.001, as seen in
Table 4) and index of height decentration (with the exception
of the lowest stage, KC1, all other P values , 0.001).
We also conducted an index repeatability measurement study, and expressed the measured repeatability as the rela-tive percentage change between four consecurela-tive measure-ments from the same eye (lower values indicating better repeatability). The results indicate that the indices of surface variance and height decentration were among the best
per-formers, having an average repeatability of 2.77% ± 1.32%
for index of surface variance and 4.67% ± 1.62% for index
of height decentration index.
Postoperative changes in anterior surface
topographic index
Based on the abovementioned results, we followed these two indices, ie, index of surface variance and index of height decentration, as reliable indicators of anterior surface changes induced by the Athens protocol. By their respective definitions, a change towards a lower value (negative change) is indicative of a trend towards more
normal corneal keratometry and topography.31
The changes induced by the Athens protocol, expressed as the difference between the 12-month postoperative values minus the respective preoperative values are shown in Figure 4 (changes in index of surface variance) and in Figure 5 (changes in index of height decentration). Relative changes in indices of surface variance and height
Preoperative 1.2
1.1 1.0 0.9 0.8 0.7 0.6 0.5 0.4 0.3 0.2 0.1
0.8 0.7 0.6 0.5 0.4 0.3 0.2 0.1
−0.4 −0.3 −0.2 −0.1 0.0
Visual acuity (decimal CDVA)
Gain/loss in visual acuity
Preoperative
Postoperative Postoperative
0.67 0.67
0.82 0.79
Group A (Placido) Group B (Scheimpflug)
0.09
0.17
Gain/loss in CDVA (decimal)
Group A (Placido) Group B (Scheimpflug)
Figure 1 Box plots of corrected distance visual acuity, expressed as decimals. Top, preoperative and postoperative values for both groups. Bottom, gain/loss expressed as difference between postoperative minus preoperative corrected distance visual acuity.
Notes: Box plots are showing median level indicated by ⊗, average symbol ⊕, 95% median confidence range box (black borderline boxes), and interquartile intervals range box (red borderline boxes).
Abbreviation: CDVA,corrected distance visual acuity.
Dovepress
Kanellopoulos and Asimellis
Clinical Ophthalmology downloaded from https://www.dovepress.com/ by 118.70.13.36 on 21-Aug-2020
decentration (defined as percentage change in the parameter with regard to respective preoperative value) are shown in Table 3. In group A, the index of surface variance was
reduced to −5.07% and the index of height decentration
to −26.81%; in group B, the index of surface variance was
reduced to −18.35% and the index of height decentration
to −39.03%, respectively. This negative change is indicative
of the corneal surface becoming less irregular (index of sur-face variance) and the “cone” becoming more central (index of height decentration) at the postoperative assessment.
Placido disc versus Scheimpflug camera
imaging for topoguided ablation
The above data, ie, changes in visual acuity, keratometry, and anterior surface topometric indices, indicate that there was
a difference in outcomes when comparing group A (Placido disc) and group B (Scheimpflug camera).
To expand our investigation further, we formed two sub-groups within each group, based on preoperative index of height decentration. The distinction was made by arbitrarily defining
this as “low” if IHD # 0.09, referring to a more centered
keratoconus cone, and “high” if IHD . 0.09, referring to a
more decentered cone. The following subgroups were formed:
group A1 (Placido low, n = 30 eyes), group A2 (Placido high,
n = 24 eyes), group B1 (Scheimpflug low, n = 65 eyes), and
group B2 (Scheimpflug high, n = 64 eyes). We then investigated
the changes induced by the Athens protocol in index of height decentration within each subgroup. For group A1, the relative
percentage change in index of surface variance was −4.61%
and in index of height decentration was −22.10%; for group A2,
Table 2 Anterior and posterior corneal keratometry and topometric indices, as measured in the 8 mm zone for both groups, preoperatively and 12 months postoperatively
Preoperative Postoperative
Mean ±SD Max Min Mean ± SD Max Min Group A (Placido)
Anterior surface
K1 flat, D 45.20 ± 3.78 52.1 33.7 43.02 ± 3.82 52.6 31.8
K2 steep, D 48.67 ± 4.07 59.2 42.1 45.86 ± 4.79 59.8 34.6
Km mean, D 46.88 ± 3.60 54.6 41.3 44.37 ± 4.14 54.5 33.1
Posterior surface
K1 flat, D −6.44 ± 0.78 −4.6 −8.0 −6.39 ± 0.86 −4.8 −8.5
K2 steep, D −7.28 ± 0.84 −5.9 −9.4 −7.40 ± 0.91 −5.8 −10.1
Km mean, D −6.82 ± 0.74 −5.5 −8.6 −6.85 ± 0.82 −5.6 −9.2
Anterior surface indices (in 8 mm zone)
ISV 91.33 ± 42.59 187 14 86.70 ± 43.91 190 14
IVA 1.06 ± 0.54 2.52 0.09 1.00 ± 0.59 2.69 0.13
KI 1.25 ± 0.15 1.72 1.02 1.21 ± 0.17 1.66 0.93
CKI 1.05 ± 0.05 1.30 0.98 1.04 ± 0.06 1.16 0.86
IhA 26.19 ± 19.80 84 0.60 22.20 ± 18.37 75.1 3.3
IhD 0.087 ± 0.051 0.201 0.007 0.064 ± 0.043 0.163 0.005
Rmin (mm) 6.35 ± 0.70 7.73 5.03 6.69 ± 0.71 7.93 4.96
Group B (Scheimpflug) Anterior surface
K1 flat, D 46.21 ± 4.08 60.7 37.6 43.19 ± 4.40 55.3 30.5
K2 steep, D 50.77 ± 5.21 71.7 42.6 46.38 ± 5.01 59.5 35.7
Km mean, D 48.36 ± 4.44 65.7 40.7 44.71 ± 4.58 57.3 32.9
Posterior surface
K1 flat, D −6.58 ± 0.83 −4.6 −9.0 −6.52 ± 0.96 −3.3 −9.8
K2 steep, D −7.66 ± 1.08 −5.8 −10.9 −7.68 ± 1.13 −5.6 −11
Km mean, D −7.07 ± 0.90 −5.1 −9.8 −7.04 ± 0.98 −4.6 −10.3
Anterior surface indices (in 8 mm zone)
ISV 98.14 ± 45.32 208 18 80.13 ± 35.98 169 15
IVA 1.05 ± 0.51 2.45 0.17 0.87 ± 0.46 2.42 0.1
KI 1.27 ± 0.16 1.80 0.97 1.19 ± 0.15 1.56 0.86
CKI 1.05 ± 0.06 1.30 0.90 1.02 ± 0.05 1.16 0.87
IhA 30.95 ± 20.88 88.7 0.3 23.80 ± 17.36 96.3 0.1
IhD 0.09 ± 0.05 0.26 0.01 0.06 ± 0.03 0.172 0.001
Rmin (mm) 6.07 ± 0.79 7.61 4.20 6.65 ± 0.66 7.88 5.12
Abbreviations: ISV, index of surface variance; IVA, index of vertical asymmetry; KI, keratoconus index; CKI, central keratoconus index; IHA, index of height asymmetry; IHD, index of height decentration; Rmin, smallest sagittal curvature; SD, standard deviation; D, diopter K1, flat keratometry; K2, steep keratometry; Km, median keratometry.
Dovepress Placido disc versus Scheimpflug imaging in progressive keratoconus
Clinical Ophthalmology downloaded from https://www.dovepress.com/ by 118.70.13.36 on 21-Aug-2020
the relative percentage change in index of surface variance was
−5.35% and in index of height decentration was −29.05%. For
group B1, the relative percentage change in index of surface
variance was −13.54% and in index of height decentration
was −32.82%; for group B2, the relative percentage change in
index of surface variance was −20.36% and in index of height
decentration was −41.19%. The results are presented in the form
of box plots in Figure 6, and are tabulated in Table 5.
Discussion
The options available to clinical investigators for clinical assessment and evaluation of keratoconus and monitoring of induced postoperative improvement due to CXL proce-dures include a multitude of diagnostic devices. Corneal
pachymetry39,40 and analysis of cornea biomechanical
properties41 can also be very significant in the
keratoco-nus assessment, although the long-standing standard for
Table 3 Changes induced in seven anterior surface indices for the two groups
ISV IVA(mm) KI CKI IHA(μm) IHD(μm) Rmin (mm) Group A (Placido)
relative change −5.07% −5.65% −3.20% −1.42% −15.24% −26.81% 2.18%
Mean change −4.630 −0.060 −0.040 −0.015 −3.991 −0.023 0.139
SD ±16.617 ±0.225 ±0.066 ±0.055 ±21.003 ±0.027 ±0.263
Maximum 29 0.45 0.07 0.06 40.6 0.023 1.31
Minimum −50 −0.74 −0.23 −0.27 −57.5 −0.102 −0.28
Group B (Scheimpflug)
relative change −18.36% −16.64% −6.24% −3.24% −23.10% −39.03% 9.64%
Mean change −18.016 −0.175 −0.079 −0.034 −7.150 −0.035 0.585
SD ±20.687 ±0.253 ±0.073 ±0.042 ±17.087 ±0.036 ±0.409
Maximum 38 0.42 0.08 0.06 37.7 0.017 1.93
Minimum −83 −0.95 −0.43 −0.22 −65.1 −0.213 −0.22
Notes: Average change is defined as the postoperative value minus the preoperative value. Relative change is defined as the percentage mean change in each parameter with regard to the respective preoperative value.
Abbreviations: ISV, index of surface variance; IVA, index of vertical asymmetry; KI, keratoconus index; CKI, central keratoconus index; IHA, index of height asymmetry; IHD, index of height decentration; Rmin, smallest sagittal curvature; SD, standard deviation.
44.65
*
Group A (Placido)
*
42.7
30.0
Preoperative Postoperative
Preoperative Postoperative 32.5
35.0
Keratometric diopters (D)
Keratometric diopters (D)
37.5 40.0 42.5 45.0 47.5 50.0 52.5 55.0 57.5 60.0
K1 (flat) preoperative vs postoperative
K2 (steep) preoperative vs postoperative
Group A (Placido)
30.0 32.5 35.0 37.5 40.0 42.5 45.0 47.5 50.0 52.5 55.0 57.5 60.0
48.2
45.35
Group B (Scheimpflug)
30.0
Preoperative Postoperative 32.5
35.0
Keratometric diopters (D)
37.5 40.0 42.5 45.0 47.5 50.0 52.5 55.0 57.5 60.0
K2 (steep) preoperative vs postoperative
45.6 50.1
Preoperative Postoperative
Keratometric diopters (D)
K1 (flat) preoperative vs postoperative
Group B (Scheimpflug)
30.0 32.5 35.0 37.5 40.0 42.5 45.0 47.5 50.0 52.5 55.0 57.5 60.0
45.4
*
*
43.1
A B
Figure 2 (A) Box plot describing induced changes (preoperative versus postoperative values) for anterior flat (top) and steep (bottom) keratometry (in diopters, D) for group A (Placido). (B) Box plot describing induced changes (preoperative versus postoperative values) for anterior flat (top) and steep (bottom) keratometry (in diopters, D) for group B (Scheimpflug).
Notes: Median level is indicated by ⊗, average by ⊕, the 95% median confidence range box by the red borderline, and the interquartile intervals range box by the black borderline.
Dovepress
Kanellopoulos and Asimellis
Clinical Ophthalmology downloaded from https://www.dovepress.com/ by 118.70.13.36 on 21-Aug-2020
Our clinical observation, which is also confirmed by other
researchers,45 has been that postoperatively, the short-term
(particularly during the first 6 months) refractive,
topomet-ric, and pachymetric results46 can be described as being “in
continuous change”, with progressive improvement towards the one-year assessment, and possibly further on. Because of this, we chose to select and analyze the one-year interval results as a common reference to what we subsequently refer to as “postoperative” data. In this study, we evaluated the one-year postoperative changes in visual acuity, keratometry, and seven anterior surface topographic indices induced by
41 51
4.5
94
112.5
156
205.5
ISV vs keratoconus grading
270
245
220
195
170
145
120
95
70
45
20
KC1 KC1–2 KC2 KC2–3 KC3 KC3–4 KC4
ISV data (all eyes
)
0.0335 0.045
0.0665
0.0915
0.1055
0.147
0.245
*
*
0.225 0.250
0.200
0.175
0.150
0.125
0.100
0.075
0.050
0.025
0.000
KC1
IHD data (all eyes)
IHD vs keratoconus grading
KC1–2 KC2 KC2–3 KC3 KC3–4 KC4
Figure 3 Top, box plot of preoperative ISV, and bottom, preoperative IHD versus keratoconus grading, as produced by the Oculyzer software.
Notes: Median level is indicated by ⊗, average by ⊕, the 95% median confidence range box by the lack borderline, and the interquartile intervals range box by the red borderline.
Abbreviations: IHD, index of height decentration; ISV, index of surface variance.
evaluating keratoconus and the results of treatment has been
anterior surface topometry and topography.42
It is known that CXL alone results in a change in corneal pachymetry, which may not be accurately depicted by Scheimp-flug imaging because of the procedure used, ie, densitometry. In addition, the partial photoablation aspect of the Athens protocol reduces corneal thickness, so any classification scheme which includes corneal pachymetry may be insufficient for postopera-tive assessment. Particularly after treatment (eg, with CXL), changes in the anterior surface may provide a more pertinent
reflection of changes induced by the procedure.43,44
Dovepress Placido disc versus Scheimpflug imaging in progressive keratoconus
Clinical Ophthalmology downloaded from https://www.dovepress.com/ by 118.70.13.36 on 21-Aug-2020
the Athens protocol, and investigated for associations with visual acuity outcomes.
Our results indicate that the minimum radius of cur-vature, defined as the inverse of corneal steepness, was increased postoperatively in agreement with the decrease
in anterior surface keratometry47,48 (Table 2). As such, the
improved one-year improvement observed for corrected distance visual acuity (Table 1 and Figure 1) can be justi-fied, because the anterior corneal surface attains a more optically manageable refractive shape. The values of all other six topographic indices were reduced in comparison with the respective preoperative values, indicating corneal surface improvement. The postoperative reduction noted
in some of these indices has been reported only recently.31
These changes are all indicative of improved corneal topography (ie, reduction of irregularity, cone becoming less
steep and more central) in agreement with other studies.31,41
Therefore, it appears that quantitative assessment of
88
101
77 84
190
170
150
130
110
90
70
50
30
10
190
170
150
130
110
90
70
50
30
10
ISV preoperative vs postoperative (group A, Placido)
ISV preoperative vs postoperative (group B, Scheimpflug)
Preoperative Postoperative
Preoperative Postoperative
Data (ISV values)
Data (ISV values)
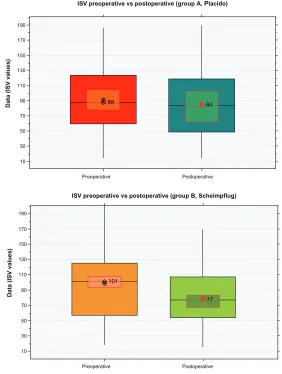
Figure 4 Box plot describing changes (preoperative versus postoperative values) induced for ISV in the two groups: top, group A, Placido; bottom, group B, Scheimpflug.
Notes: ⊗,median level; ⊕, average; red borderline, 95% median confidence range box; black borderline, interquartile intervals range box.
Abbreviation: ISV, index of surface variance.
Table 4 Two-sample t-test results, not assuming equal variance, between the keratoconus grading subgroups (KC1, KC1–2, KC2, KC2–3, KC3, KC3–4, and KC4) for the topometric indices of ISV and IhD as measured preoperatively
Estimate for difference
95% CI for difference
P value
ISV
K1 versus K1–2 10.31 (7.35, 13.27) ,0.001 K1–2 versus K2 21.84 (17.87, 25.82) ,0.001 K2 versus K2–3 21.02 (17.02, 25.03) ,0.001 K2–3 versus K3 20.3 (16.88, 23.72) ,0.001 K3 versus K3–4 43.7 (37.79, 49.62) ,0.001
K3–4 versus K4 61 (14.1, 107.8) 0.026
IHD
K1 versus K1–2 0.01255 (0.00474, 0.02035) 0.003 K1–2 versus K2 0.02411 (0.01522, 0.03300) ,0.001 K2 versus K2–3 0.02012 (0.01038, 0.02985) ,0.001 K2–3 versus K3 0.01856 (0.00836, 0.02876) 0.001 K3 versus K3–4 0.04487 (0.03165, 0.05808) ,0.001 K3–4 versus K4 0.0888 (0.0610, 0.1166) ,0.001
Abbreviations: ISV index of surface variance; IHD, index of height decentration; CI, confidence interval.
Dovepress
Kanellopoulos and Asimellis
Clinical Ophthalmology downloaded from https://www.dovepress.com/ by 118.70.13.36 on 21-Aug-2020
0.095
0.075
0.065
0.045
0.035
0.025
0.015
0.005 0.055 0.085
0.048
0.0325
0.1205
0.0905
Preoperative Postoperative Preoperative Postoperative
0.22
0.20
0.18
0.16
0.14
0.12
0.10
0.08
0.04
0.02 0.06
Data (IHD values)
Data (IHD values
)
IHD preoperative vs postoperative (group A1, placido low)
IHD preoperative vs postoperative (group A2, placido high)
0.0505
0.029
Preoperative Postoperative 0.005
0.055 0.065 0.075 0.085 0.095
0.045
0.035
0.025
0.015
Data (IHD values
)
IHD preoperative vs postoperative (group B1, Scheimpflug low)
Preoperative Postoperative 0.22
0.20
0.18
0.16
0.14
0.12
0.10
0.08
0.04
0.02 0.06
Data (IHD values)
IHD preoperative vs postoperative (group B2, Scheimpflug high)
0.118
0.072
*
A B
Figure 6 (A) Box plot describing preoperative versus postoperative changes in IHD induced for the subgroups. Top, group A1 (Placido low) indicating less affected keratoconic eyes; bottom, group A2 (Placido high) indicating more affected keratoconic eyes. (B) Box plot describing preoperative versus postoperative changes in IHD induced for the subgroups. Top, group B1 (Scheimpflug low) indicating less affected keratoconic eyes; bottom, group B2 (Scheimpflug high) indicating more affected keratoconic eyes.
Notes: ⊗, median level; ⊕, average; red borderline, 95% median confidence range box; black borderline, interquartile intervals range box.
Abbreviation: IhD,index of height decentration.
0.000
Preoperative Postoperative
0.0535 0.0815
0.025 0.050 0.075 0.100
Data (IHD values)
0.125 0.150 0.175 0.200
IHD preoperative vs postoperative (group A, Placido)
10
Preoperative Postoperative
77 101
30 50 70 90
Data (ISV values)
110 130 170
150 190
ISV preoperative vs postoperative (group B, Scheimpflug)
Figure 5 Box plot describing changes (preoperative versus postoperative values) induced for IHD for the two groups: top, group A, Placido; bottom, group B, Scheimpflug.
Notes: ⊗,median level; ⊕, average; red borderline, 95% median confidence range box; black borderline, interquartile intervals range box.
Abbreviations: IhD,the index of height decentration; ISV, index of surface variance.
postoperative changes in CXL using the topometric indices of surface variance and height decentration may prove very helpful in clinical practice.
Our study indicates that the outcomes of the Athens protocol used for keratoconus stabilization and visual reha-bilitation appear to be better when using Scheimpflug-driven
topography data. Based on our analysis, group B, for which primary topographic data were provided by the Oculyzer II, a Scheimpflug rotating camera, when compared with group A, the primary topographic data for which were provided by the Vario Topolyzer, a Placido topographer, showed a greater reduction in keratometry, as well as the two anterior surface
Dovepress Placido disc versus Scheimpflug imaging in progressive keratoconus
Clinical Ophthalmology downloaded from https://www.dovepress.com/ by 118.70.13.36 on 21-Aug-2020
topographic indices having the strongest correlation with keratoconus grading, ie, the indices of surface variance and height decentration.
This study evaluated a very large number of cases over an extended period of time, when compared with the current peer-reviewed literature. The difference in absolute numbers between group A (Placido disc-guided, 54 cases) and group B (Scheimpflug tomography-guided, 127 cases) is due to early results suggesting that the procedure used in group B demon-strated higher efficacy, leading to discontinuation of recruitment for group A. Although different, these numbers and the duration of follow-up are still quite substantial and permit sensitive sta-tistical analysis and a confident conclusion regarding the differ-ential in postoperative efficacy. This change is more pronounced in the more irregular and more decentrated anterior surfaces
preoperatively (subgroups A2 and B2), reaching up to a −41%
reduction in index of height decentration for group B2. The above findings may be explained by the procedures used with the corresponding diagnostic devices. The Placido disc imaging devices, despite providing a single, snapshot measurement, are more suitable for measurements at the
peripheral cornea, and have lower reliability for information at the corneal center, in addition to being susceptible to error due to abrupt changes in corneal height. Placido disc imag-ing cannot clearly differentiate between abrupt flattenimag-ing and abrupt steepening changes, and simply measures changes in curvature. This potential bias of measurement may be one, or the main, reason for the difference in clinical efficacy seen in our study. On the other hand, the rotating measurement p rocess used by the Scheimpflug imaging camera, despite being sequential, captures images with a fine meshed dot matrix in the center, providing high-resolution data for absolute elevation from the large corneal area imaged. The potential bias here is interference of the eyelid and eyelashes with the image quality, as well as potential bias in thickness measure-ment attributed to arcus senilis in the peripheral cornea. All Scheimpflug images used in our treatments are carefully screened in order to exclude these potential biases.
Conclusion
Topography-guided normalization of extreme cornea irregularity, such as keratoconus, coupled with higher flu-ence CXL appears to be achieved with significantly greater efficacy when the Scheimpflug rotating camera (Oculyzer) is used with the WaveLight excimer laser platform. It appears to provide significantly better improvement in refractive, topometric, and visual rehabilitation when compared with Placido disc (Topolyzer) topography-driven normalization and CXL treatments. This Athens protocol, aiming to both halt progression of keratoconic ectasia and improve anterior corneal normality, topometry, and visual performance, demonstrates a good safety record with either platform and very effective refractive, keratometric, and topometric results.
Disclosure
AJK is a consultant for Alcon/Wavelight and Avedro. GA is a consultant for Alcon/Wavelight. The authors report no conflicts of interest in this work.
References
1. Krachmer JH, Feder RS, Belin MW. Keratoconus and related nonin-flammatory corneal thinning disorders. Surv Ophthalmol. 1984;28: 293–322.
2. Belin MW, Asota IM, Ambrosio R Jr, Khachikian SS. What’s in a name: keratoconus, pellucid marginal degeneration, and related thinning disor-ders. Am J Ophthalmol. 2011;152:157–162.
3. Ambrósio R, Caldas DL, da Silva RS, Pimentel LN, de Freitas VB. Impact of the wavefront analysis in refraction of keratoconus patients. Rev Bras Oftalmol. 2010;69:294–300. Portuguese.
4. Kosaki R, Maeda N, Bessho K, et al. Magnitude and orientation of Zernike terms in patients with keratoconus. Invest Ophthalmol Vis Sci. 2007;48:3062–3068.
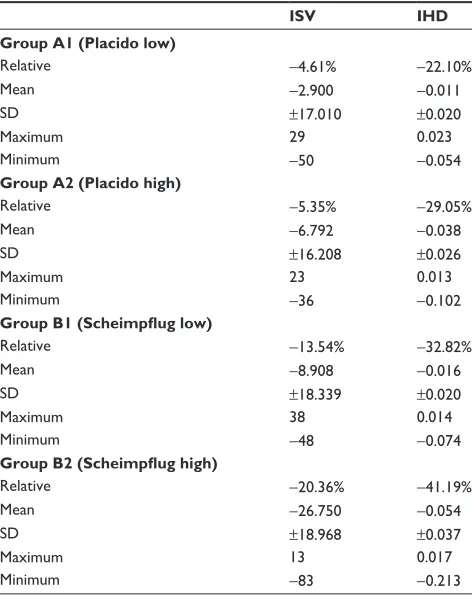
Table 5 Changes in ISV and IhD induced in the four subgroups
ISV IHD
Group A1 (Placido low)
relative −4.61% −22.10%
Mean −2.900 −0.011
SD ±17.010 ±0.020
Maximum 29 0.023
Minimum −50 −0.054
Group A2 (Placido high)
relative −5.35% −29.05%
Mean −6.792 −0.038
SD ±16.208 ±0.026
Maximum 23 0.013
Minimum −36 −0.102
Group B1 (Scheimpflug low)
relative −13.54% −32.82%
Mean −8.908 −0.016
SD ±18.339 ±0.020
Maximum 38 0.014
Minimum −48 −0.074
Group B2 (Scheimpflug high)
relative −20.36% −41.19%
Mean −26.750 −0.054
SD ±18.968 ±0.037
Maximum 13 0.017
Minimum −83 −0.213
Notes: Mean change is derived from the postoperative minus the preoperative value in each case. Relative change is defined as percentage mean change in the parameter with regard to respective preoperative value.
Abbreviations: ISV, index of surface variance; IHD, index of height decentration; SD, standard deviation.
Dovepress
Kanellopoulos and Asimellis
Clinical Ophthalmology downloaded from https://www.dovepress.com/ by 118.70.13.36 on 21-Aug-2020
5. Zadnik K, Steger-May K, Fink BA, et al. Collaborative longitudinal evaluation of keratoconus. Between-eye asymmetry in keratoconus.
Cornea. 2002;21:671–679.
6. Jones-Jordan LA, Walline JJ, Sinnott LT, Kymes SM, Zadnik K. Asymmetry in keratoconus and vision-related quality of life. Cornea. 2013;32:267–272.
7. Chan E, Snibson GR. Current status of corneal collagen cross-linking for keratoconus: a review. Clin Exp Optom. 2013;96:155–164. 8. Lanchares E, del Buey MA, Cristóbal JA, Lavilla L, Calvo B.
Biomechanical property analysis after corneal collagen cross-linking in relation to ultraviolet A irradiation time. Graefes Arch Clin Exp Ophthalmol. 2011;249:1223–1227.
9. Hafezi F, Kanellopoulos J, Wiltfang R, Seiler T. Corneal collagen crosslinking with riboflavin and ultraviolet A to treat induced keratectasia after laser in situ keratomileusis. J Cataract Refract Surg. 2007;33:2035–2040.
10. Kanellopoulos AJ, Pe LH, Perry HD, Donnenfeld ED. Modified intracorneal ring segment implantations (INTACS) for the manage-ment of moderate to advanced keratoconus: efficacy and complications.
Cornea. 2006;25:29–33.
11. Kanellopoulos AJ. Collagen cross-linking in early keratoconus with riboflavin in a femtosecond laser-created pocket: initial clinical results.
J Refract Surg. 2009;25:1034–1037.
12. Kanellopoulos AJ, Binder PS. Collagen cross-linking (CCL) with sequential topography-guided PRK: a temporizing alterna-tive for keratoconus to penetrating keratoplasty. Cornea. 2007;26: 891–895.
13. Kanellopoulos AJ. Comparison of sequential vs same-day simultane-ous collagen cross-linking and topography-guided PRK for treatment of keratoconus. J Refract Surg. 2009;25:S812–S818.
14. Krueger RR, Kanellopoulos AJ. Stability of simultaneous topography-guided photorefractive keratectomy and riboflavin/UVA cross-linking for progressive keratoconus: case reports. J Refract Surg. 2010;26:S827–S832.
15. Kanellopoulos AJ, Asimellis G. Introduction of quantitative and qualitative cornea optical coherence tomography findings, induced by collagen cross-linking for keratoconus; a novel effect measurement benchmark. Clin Ophthalmol. 2013;7:329–335.
16. Kanellopoulos AJ. Managing highly distorted corneas. Abstract pre-sented at the Subspecialty Day-Refractive Surgery, American Academy Of Ophthalmology, New Orleans, LA, November 9, 2007.
17. Kanellopoulos AJ. Limited topography-guided surface ablation followed by stabilization with collagen cross-linking with UV irradiation and riboflavin for keratoconus. Presented at the Subspecialty Day-Refractive Surgery, American Academy of Ophthalmology, New Orleans, LA, November 9, 2007.
18. Kanellopoulos AJ. Topography-guided PRK combined with cross-linking for keratoconus and post-LASIK ectasia. Presented at the Inter-national Refractive Surgery Symposia, Istanbul, Turkey, November 24, 2007.
19. Perry H, Kanellopoulos AJ. Long term comparison of sequential to combined collagen cross linking and limited topography-guided PRK for keratoconus. Presented at the International Congress of Corneal Cross Linking, Dresden, Germany, December 6, 2008.
20. Pantelis S, Kanellopoulos AJ. Novel keratoconus management with combined: topography-guided PR K(tPRK), femtosecond laser-assisted lamellar graft (fLK) and collagen cross linking (CCL). Presented at the International Congress of Corneal Cross Linking, Dresden, Germany, December 6, 2008.
21. Kanellopoulos AJ. Long term results of a prospective randomized bilateral eye comparison trial of higher fluence, shorter duration ultraviolet A radiation, and riboflavin collagen cross linking for progressive keratoconus. Clin Ophthalmol. 2012;6:97–101.
22. Kanellopoulos AJ. Cross-linking plus topography-guided PRK for post-LASIK ectasia management. In: Garg A, Alio JL, Lin JT, et al, editors.
Mastering Advanced Surface Ablation Techniques. New Delhi, India: Jaypee Brothers; 2007.
23. Kanellopoulos AJ, Binder PS. Management of corneal ectasia after LASIK with combined, same-day, topography-guided partial transepi-thelial PRK and collagen cross-linking: the Athens protocol. J Refract Surg. 2011;27:323–331.
24. Kanellopoulos AJ. Topography-guided hyperopic and hyperopic astigmatism femtosecond laser-assisted LASIK: long-term experience with the 400 Hz Eye-Q excimer platform. Clin Ophthalmol. 2012;6: 895–901.
25. Kanellopoulos AJ, Asimellis G. Long term bladeless LASIK outcomes with the FS200 femtosecond and EX500 excimer laser workstation: the Refractive Suite. Clin Ophthalmol. 2013;7:261–269.
26. Kanellopoulos AJ, Asimellis G. High myopia one-year refractive and keratometric stability in LASIK with high-frequency femtosecond and excimer lasers. J Refract Surg. 2013. In press.
27. Kanellopoulos AJ, Asimellis G. Correlation between central corneal thickness, anterior chamber depth, and corneal keratometry as measured by Oculyzer II and WaveLight OB820 in preoperative cataract surgery patients. J Refract Surg. 2012;28:895–900.
28. Swartz T, Marten L, Wang M. Measuring the cornea: the latest devel-opments in corneal topography. Curr Opin Ophthalmol. 2007;18: 325–333.
29. Krumeich JH, Daniel J, Knulle A. Live-epikeratophakia for keratoconus.
J Cataract Refract Surg. 1998;24:456–463.
30. Li X, Yang H, Rabinowitz YS. Keratoconus: classification scheme based on videokeratography and clinical signs. J Cataract Refract Surg. 2009;35:1597–1603.
31. Greenstein SA, Fry KL, Hersh PS. Corneal topography indices after corneal collagen crosslinking for keratoconus and cor-neal ectasia: one-year results. J Cataract Refract Surg. 2011;37: 1282–1290.
32. Sonmez B, Doan MP, Hamilton DR. Identification of scanning slit-beam topographic parameters important in distinguishing normal from keratoconic corneal morphologic features. Am J Ophthalmol. 2007;143:401–418.
33. Ho JD, Tsai CY, Tsai RJ, Kuo LL, Tsai IL, Liou SW. Validity of the keratometric index: evaluation by the Pentacam rotating Scheimpflug camera. J Cataract Refract Surg. 2008;34:137–145.
34. Faria-Correia F, Ramos IC, Lopes BT, et al. Topometric and tomo-graphic indices for the diagnosis of keratoconus. International Journal of Keratoconus and Ectatic Corneal Diseases. 2012;1:100–106. 35. Rüfer F, Schröder A, Arvani MK, Erb C. Central and peripheral corneal
pachymetry-standard evaluation with the Pentacam system. Klin Monbl Augenheilkd. 2005;222:117–122. German.
36. Emre S, Doganay S, Yologlu S. Evaluation of anterior segment param-eters in keratoconic eyes measured with the Pentacam system. J Cataract Refract Surg. 2007;33:1708–1712.
37. Kanellopoulos AJ, Asimellis G. Revisiting keratoconus classification based on the evaluation corneal asymmetry indices, derived from Scheimpflug imaging. Clin Ophthalmol. 2013. In press.
38. Gordon-Shaag A, Millodot M, Shneor E. The epidemiology and etiol-ogy of keratoconus. International Journal of Keratoconus and Ectatic Corneal Diseases. 2012;1:7–15.
39. Markakis GA, Roberts CJ, Harris JW, Lembach RG. Comparison of topographic technologies in anterior surface mapping of keratoconus using two display algorithms and six corneal topography devices.
International Journal of Keratoconus and Ectatic Corneal Diseases. 2012;1:153–157.
40. Koller T, Iseli HP, Hafezi F, Vinciguerra P, Seiler T. Scheimpflug imaging of corneas after collagen cross-linking. Cornea. 2009;28: 510–515.
41. Scarcelli G, Kling S, Quijano E, Pineda R, Marcos S, Yun SH. Brillouin microscopy of collagen crosslinking: noncontact depth-dependent analysis of corneal elastic modulus. Invest Ophthalmol Vis Sci. 2013;54:1418–1425.
42. Maeda N, Klyce SD, Smolek MK, Thompson HW. Automated kerato-conus screening with corneal topography analysis. Invest Ophthalmol Vis Sci. 1994;35:2749–2757.
Dovepress Placido disc versus Scheimpflug imaging in progressive keratoconus
Clinical Ophthalmology downloaded from https://www.dovepress.com/ by 118.70.13.36 on 21-Aug-2020
Clinical Ophthalmology
Publish your work in this journal
Submit your manuscript here: http://www.dovepress.com/clinical-ophthalmology-journal
Clinical Ophthalmology is an international, peer-reviewed journal covering all subspecialties within ophthalmology. Key topics include: Optometry; Visual science; Pharmacology and drug therapy in eye diseases; Basic Sciences; Primary and Secondary eye care; Patient Safety and Quality of Care Improvements. This journal is indexed on
PubMed Central and CAS, and is the official journal of The Society of Clinical Ophthalmology (SCO). The manuscript management system is completely online and includes a very quick and fair peer-review system, which is all easy to use. Visit http://www.dovepress.com/ testimonials.php to read real quotes from published authors. 43. Dubbelman M, Weeber HA, van der Heijde RG, Völker-Dieben HJ.
Radius and asphericity of the posterior corneal surface determined by corrected Scheimpflug photography. Acta Ophthalmol Scand. 2002;80:379–383.
44. Ambrósio R Jr, Caiado AL, Guerra FP, et al. Novel pachymetric parameters based on corneal tomography for diagnosing keratoconus.
J Refract Surg. 2011;27:753–758.
45. Hersh PS, Greenstein SA, Fry KL. Corneal collagen crosslinking for keratoconus and corneal ectasia: one-year results. J Cataract Refract Surg. 2011;37:149–160.
46. Mencucci R, Paladini I, Virgili G, Giacomelli G, Menchini U. Corneal thickness measurements using time-domain anterior segment OCT, ultrasound, and Scheimpflug tomographer pachymetry before and after corneal cross-linking for keratoconus. J Refract Surg. 2012; 28:562–556. 47. Vinciguerra P, Albe E, Trazza S, et al. Refractive, topographic,
tomographic, and aberrometric analysis of keratoconic eyes undergoing corneal cross-linking. Ophthalmology. 2009;116:369–378.
48. Raiskup-Wolf F, Hoyer A, Spoerl E, Pillunat LE. Collagen crosslinking with riboflavin and ultraviolet-A light in keratoconus: longterm results.
J Cataract Refract Surg. 2008;34:796–801.
Dovepress
Dove
press
Kanellopoulos and Asimellis
Clinical Ophthalmology downloaded from https://www.dovepress.com/ by 118.70.13.36 on 21-Aug-2020