Adaptation by normal listeners to upward spectral shifts
of speech: Implications for cochlear implants
Stuart Rosen, Andrew Faulkner, and Lucy Wilkinson
Department of Phonetics and Linguistics, University College London, 4 Stephenson Way, London NW1 2HE, England
共Received 29 April 1999; revised 11 August 1999; accepted 16 August 1999兲
Multi-channel cochlear implants typically present spectral information to the wrong ‘‘place’’ in the auditory nerve array, because electrodes can only be inserted partway into the cochlea. Although such spectral shifts are known to cause large immediate decrements in performance in simulations, the extent to which listeners can adapt to such shifts has yet to be investigated. Here, the effects of a four-channel implant in normal listeners have been simulated, and performance tested with unshifted spectral information and with the equivalent of a 6.5-mm basalward shift on the basilar membrane共1.3–2.9 octaves, depending on frequency兲. As expected, the unshifted simulation led to relatively high levels of mean performance 共e.g., 64% of words in sentences correctly identified兲 whereas the shifted simulation led to very poor results共e.g., 1% of words兲. However, after just nine 20-min sessions of connected discourse tracking with the shifted simulation, performance improved significantly for the identification of intervocalic consonants, medial vowels in monosyllables, and words in sentences共30% of words兲. Also, listeners were able to track connected discourse of shifted signals without lipreading at rates up to 40 words per minute. Although we do not know if complete adaptation to the shifted signals is possible, it is clear that short-term experiments seriously exaggerate the long-term consequences of such spectral shifts. © 1999 Acoustical Society of America. 关S0001-4966共99兲02012-3兴
PACS numbers: 43.71.Es, 43.71.Ky 关JMH兴
INTRODUCTION
Although multi-channel cochlear implants have proven to be a great boon for profoundly and totally deaf people, there is still much to be done in improving patient perfor-mance. One barrier to better results may be the fact that spectral information is typically presented in the wrong ‘‘place’’ of the auditory nerve array, due to the fact that electrodes can only be inserted partway into the cochlea. In a recent study which used x-ray computed tomography to mea-sure electrode position in 20 patients with the Nucleus im-plant fully inserted, the most apical electrode was estimated to be at a cochlear place tuned to a mean frequency of about 1 kHz共Ketten et al., 1998兲. Four of the patients共20%兲had their most apical electrode at a location tuned to a frequency greater than 1400 Hz.
All multi-channel implants make use of a tonotopic pre-sentation of acoustic information, using a bottom channel that is typically at a frequency lower than is reached by the most apical electrode. As clinical implant speech processors use channels tuned to as low as 200 Hz, it is clear that the place/frequency mismatch can be substantial. The net effect of such misplacement is a shift of spectral information to nerves that typically carry higher-frequency information.
Recent studies by Dorman et al. 共1997兲 and Shannon et al. 共1998兲 lend support to the notion that such a shift in spectral envelope can be devastating for speech perceptual performance. Shannon and his colleagues implemented a simulation of a four-channel cochlear implant, and used that to process signals for presentation to normal listeners. In their reference condition, channels were unshifted and spaced equally by purported distance along the basilar
mem-brane. Performance in this condition was worse than that obtained with natural speech, but still relatively high共about 80% of words in sentences兲. However, when the spectral information was shifted so as to simulate an 8-mm shift on the basilar membrane basalward, performance dropped pre-cipitously 共⬍5% of words in sentences兲. Dorman et al.
共1997兲also found significant decrements in performance for basalward shifts of 4–5 mm in a five-channel simulation. In both these studies, however, listeners were given little or no opportunity to adapt to such signals, so it is impossible to say of what importance such a mislocation of spectral shape is for cochlear implant users, who will be gaining experience with their implant typically for more than 10 h per day.
In fact, there is much evidence to support the notion that listeners can learn to adapt to such changes, and even more extreme ones. Blesser共1972, 1969兲instructed pairs of listen-ers to learn to communicate in whatever way they could over a two-way audio communication channel that low-pass fil-tered speech at 3.2 kHz, and then inverted its spectrum around the frequency of 1.6 kHz. Although intelligibility over this channel was extremely low initially 共in fact, virtu-ally nil兲, listeners did learn to converse through it over a period of time. They also showed improved ability at per-ceiving processed unknown sentences, although even after about 10 h of experience, performance was still relatively low 共a mean of 35% of syllables identified correctly兲.
manner, as different speakers use different absolute frequen-cies for the formants which determine spectral envelope structure. It might even be said that the most salient aspect of speech perception is the ability to extract invariant linguistic units from acoustic signals that vary widely in rate, intensity, and spectral shape.
In an attempt to address this issue, we implemented the type of signal processing used by Shannon et al.共1998兲, and tested our subjects on a similar range of speech materials with both spectrally shifted and unshifted speech. What makes this study very different is that our subjects were given an explicit opportunity to learn about the shifted sig-nals, both by repeating the speech tests over a period of time, but more importantly, by letting them experience the frequency-shifted signals as receivers in Connected Dis-course Tracking 共De Filippo and Scott, 1978兲. The advan-tages of Connected Discourse Tracking for this purpose are manifold, insofar as it is a quantifiable, highly interactive task using genuine connected speech, and thus has high face validity. Using it, we are not only able to give our subjects extensive experience with constant feedback, but also to monitor their progress.
I. METHOD A. Subjects
Four normally hearing adults, aged 18–22, participated in the tests. Two were male and two were female. All were native speakers of British English.
B. Test material
Three tests of speech perception were used. All were presented over Sennheiser HD 475 headphones without vi-sual cues and without feedback. Two of these were computer-based segmental tests, with a closed set of re-sponses. The intervocalic consonant, or VCV test 共vowel– consonant–vowel兲 consisted of 18 consonants between the vowel /Ä/, hence /ÄmÄ/, /ÄbÄ/, etc, uttered with stress on the second syllable by a female speaker of Southern Standard British English. Every VCV was represented by at least 5 distinct tokens, with most having 12–15 tokens. Each of the consonants共/b tbd f g k l m n p r sbt v w j z/兲occurred three times in a random order in each test session, with the par-ticular token chosen randomly without replacement on each trial. Listeners responded by using a mouse to select 1 of the 18 possibilities, displayed orthographically on the computer screen in alphabetical order共b ch d f g k l m n p r s sh t v w y z兲. Results were analyzed not only in terms of overall percent correct, but also for percent correct, and information transmitted with respect to the features of voicing共voiced/m n w r l j b d g z v/ vs voiceless /p t k tb bs f/兲, manner of articulation共nasal /m n/ vs glide /w r l j/ vs plosive /b p d t g k/ vs affricate /tb/ vs fricative /b s f z v/兲 and place of articulation 共bilabial /m w b p/ vs labiodental /f v/ vs al-veolar /n l j d t s z/ vs palatal /r tb b/ vs velar /g k/兲. Note that studies like this often use an information transfer measure to analyze performance by feature, rather than percent correct. Although percent correct suffers from the drawback that dif-ferent levels of chance performance are not compensated for
in the calculation 共e.g., that voicing judgements will be ap-proximately 50% correct by chance alone whereas place judgements will be about 20% correct by chance兲, it is a more readily understood metric whose statistical properties are better characterized. Therefore, all statistical claims are made on the basis of percent correct only, although some summary statistics using information transfer are also pre-sented.
The vowel test consisted of 17 different vowels or diph-thongs in a /b/-/vowel/-/d/ context, in which all the utter-ances were real words or a common proper name—bad, bard, bared, bayed, bead, beard, bed, bid, bide, bird, bod, bode, booed, board, boughed, Boyd, or bud. The speaker was a共different兲female speaker of Southern Standard British En-glish. In each session, each vowel occurred three times in a random order, with each stimulus chosen randomly without replacement from a set of six distinct tokens. Again, listeners responded with a mouse to the possibilities displayed on the computer screen.
The third test consisted of the BKB sentence lists
共Bench and Bamford, 1979兲. These are a set of 21 lists, each consisting of 16 sentences containing 50 key words, which are the only words scored. The particular recording 共 de-scribed by Foster et al., 1993兲used the same female speaker as the consonant test. Listeners wrote their responses down on a sheet of paper, and key words were scored using the so-called loose method 共in which a response is scored as correct if its root matches the root of the presented word兲.
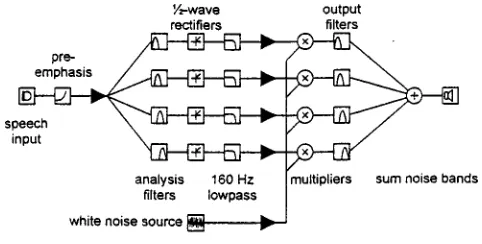
C. Signal processing
pass filtering at 160 Hz. These envelopes were then multi-plied by a white noise, and each filtered by a sixth-order elliptical IIR output filter, before being summed together for final digital-to-analog conversion. The gain of the four chan-nels was adjusted so that a flat-spectrum input signal resulted in an output spectrum with each noise band having the same level共measured at the center frequency of each output filter兲. Cross-over frequencies for both the analysis and output filters 共Table I兲 were calculated using an equation and its inverse, relating position on the basilar membrane to its best frequency共Greenwood, 1990兲:
frequency⫽165.4共100.06x⫺1兲,
x⫽ 1 0.06log
冉
frequency
165.4 ⫹1
冊
,where x is position on the basilar membrane 共in mm兲from the apex, and frequency is given in Hz.
The unshifted condition, in which analysis and output filters had the same center frequencies, was obtained by di-viding the frequency range from 50 to 4000 Hz equally using the equations above. This is similar to the LOG condition used by Shannon et al.共1998兲. In the shifted condition, out-put filters had their band edges increased upward in fre-quency by an amount equal to 6.46 mm on the basilar mem-brane 共e.g., shifting 4 kHz to 10 kHz兲.
D. Procedure
In the first testing session, listeners were administered the three speech tests in each of three signal processing con-ditions:共1兲normal speech共primarily to familiarize listeners with the test procedures, and not used with the BKB sen-tences兲; 共2兲 unshifted four-channel; 共3兲 frequency-shifted four-channel. One run of each of the vowel and consonant tests was performed with normal speech, and two runs of all three tests were presented for the two four-channel condi-tions.
Each subsequent testing session began with four 5-min blocks of audio-visual connected discourse tracking
共CDT—De Filippo and Scott, 1978兲with a short break be-tween blocks. The talker in CDT was always the same共the third author兲. Talker and receiver faced each other through a double-pane glass partition in two adjacent sound-proofed rooms. The receiver wore Sennheiser HD475 headphones through which the audio signal was presented. Near the ceiver was a stand-mounted microphone to transmit the re-ceiver’s comments undistorted to the talker. All CDT was done with the audio channel to the receiver undergoing the frequency-shifted four-channel processing. A low-level
masking noise was introduced into the receiver’s room so as to ensure the inaudibility of any of the talker’s speech not sufficiently attenuated by the intervening wall. Talker and receiver worked together to maximize the rate at which ver-batim repetition by the receiver could be maintained. The materials used for CDT were of a controlled level of gram-mar and vocabulary, being drawn from the Heinemann Guided Readers series aimed at learners of English. The ini-tial stages of CDT were performed audio-visually because it seemed highly unlikely that any subject would be able to track connected speech at all on the basis of the shifted sound alone at the beginning of the training.
In the sixth to tenth testing session, the first 5-min block of CDT was audio-visual, as in the previous sessions. Then visual cues were removed by covering the glass partition, and the second block of CDT was attempted in an audio alone condition. If the receiver scored more than ten words per minute 共wpm兲, the remaining two blocks of CDT were conducted in the audio alone condition. If, however, the re-ceiver scored less than 10 wpm, visual cues were restored for the remaining two 5-min blocks of CDT.
After each CDT training session, subjects were required to repeat the three speech perception tests given on the initial session 共again for two runs of each test兲, but only in the shifted condition. After ten sessions of training共each consist-ing of four 5-min blocks of CDT兲and testing, a final set of tests in the unshifted condition was also performed.
The 21 BKB sentence lists were presented in numerical order starting from list 1 in the unshifted condition, thus list 3 for shifted. As our experimental design required 24 lists, three lists only were repeated at the very end of testing共list 3 for the last test in the shifted condition, and lists 4 and 5 for the last tests in the unshifted兲. As scores were near zero for these lists when first presented; more than a week passed between presentations, and no feedback was ever given, it seems highly unlikely that subjects would have improved their performance on these lists simply through having expe-rienced them before. In any case, we would expect any im-provement to figure larger for the unshifted than the shifted condition.
E. Analysis
A common set of statistical analyses was performed for results from the three speech tests. As all these scores repre-sent binomial variables, a statistical modeling approach based on logistic regression was taken, using the GLIM 4 system 共Francis et al., 1993兲. Unless otherwise stated, all statistical claims are based on changes in deviance at a 0.05 significance level.
One analysis concerned performance in the first and last sessions, the only two sessions in which results from both test conditions共shifted and unshifted兲were obtained. Session and condition were treated as two-factor categorical vari-ables, and listener as a four-factor variable. Of particular interest was the significance of a session by condition inter-action, which would indicate the extent to which perfor-mance improves more across sessions for one condition than the other. In addition, a number of subsidiary analyses were performed, focusing on performance in either one session, or
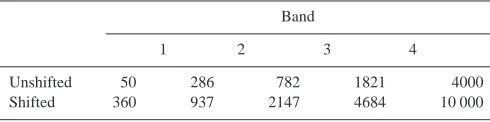
TABLE I. Frequencies of the band edges used for the four output filters in the two main conditions of the experiment, specified in Hz. The analysis filters always used the unshifted frequencies.
Band
1 2 3 4
Unshifted 50 286 782 1821 4000
one condition. The aim of these analyses was to determine the extent to which performance improved in either condi-tion, and whether performance was better for one condition or the other at the two points in time.
The other main analysis concerned trends across ses-sions for the shifted condition only, focusing on the extent to which increases in performance were significant, and the ex-tent to which they appeared to be slowing over sessions. Again, a logistic regression was used, here to look for sig-nificant linear and quadratic trends across session. Session number was treated as a continuous variable, and listener as a four-category factor. A significant positive linear trend in-dicates performance is improving, while an additional sig-nificant quadratic trend always indicated a deceleration in the increase of performance. Although it is typical to use a logit link in such analyses, here an identity link was used. In this way, a linear trend in the statistical model corresponds ex-actly with a linear trend in proportion correct as a function of session number. In fact, the analyses were done with both link functions. Although differences arose in the details of the statistical models resulting, a change of link never re-sulted in a different substantive conclusion.
The analysis of the results from CDT also explored the existence of linear and quadratic trends across session, al-though under the assumption that the rate obtained, in words per minute, could be modeled as a Gaussian random vari-able. These analyses thus took the form of a general linear model 共analyses of variance and covariance兲.
II. RESULTS
A. Initial test session
As expected, performance was high when the subjects were presented with natural speech. The mean score was 98.6% correct共range: 96.3–100.0兲for the VCVs, and a little lower for the vowels 共mean of 91.6% and a range of 86.0– 96.1兲.
In the unshifted condition, performance was worse than with natural speech 共as would be expected from Shannon et al., 1995兲, but still quite high, as seen in Table II. The shift in spectrum, however, had a devastating effect on speech scores, especially for those tests that require the perception of spectral detail for good performance.
For the understanding of BKB sentences, mean perfor-mance dropped from 64% of key words correct to just under 1%. Vowel perception, too, was severely affected. Perfor-mance on VCVs was least affected, primarily because man-ner and voicing were relatively well received. These features
are known to be well signalled by temporal 共Rosen, 1992兲 and gross spectral cues—cues which are apparently not dis-rupted by the spectral shift. Place of articulation, depending as it does upon fine spectral cues, was the most perceptually degraded phonetic feature.
B. Connected discourse tracking „CDT…
Although the main purpose of CDT was to provide a highly interactive training method, it is of interest to examine the trends found 共Fig. 2兲. Only one subject 共CP兲 failed to meet the criterion of 10 wpm in the auditory alone condition consistently for sessions 6–10, and even he met it on two of the sessions.
As would be expected, audio-visual performance was always considerably better than that obtained from auditory cues alone. There was also a clear improvement in the audio-visual condition, especially in the initial sessions. Three of the four subjects共excepting YW兲exhibited a statistically sig-nificant linear increase in performance across session ( p
⬍0.01). CP and YW both showed a significant quadratic trend across sessions, consistent with a deceleration in
im-FIG. 2. Box plots of rates obtained from each 5-min run of Connected Discourse Tracking共across subjects兲as a function of session. The box in-dicates the inter-quartile range of values obtained, with the median indicated by the solid horizontal line. The range of measurements is shown by the whiskers except for points more than 1.5 共indicated by ‘‘䊊’’兲 or 3 box lengths共‘‘*’’兲from the upper or lower edge of the box. Although no ‘‘*’’ appears on this plot, box plots are also used for Figs. 3–9, where these symbols do sometimes occur. The small numbers below the abscissa under each box indicate the total number of measurements used in the construction of each ‘‘box.’’ Two errors in the number of blocks run led to an extra CDT score in each of session numbers 6 and 7.
TABLE II. Percent correct scores obtained in the recorded speech tests for the unshifted共un兲and shifted共shft兲
conditions in the first testing session. Scores for each subject represent a mean of two tests.
Subject
BKB bVd VCV Place Voicing Manner
un shft un shft un shft un shft un shft un shft
CP 69 1 39 5 52 37 59 44 98 97 81 78
NW 64 0 43 5 57 32 61 38 94 85 76 80
SM 62 0 41 4 52 30 65 40 97 92 82 81
YW 61 2 45 5 55 33 74 42 94 82 90 74
provements in performance. Similarly, an ANOVA of the rates obtained without regard to subject revealed linear and quadratic trends over session.1
The same ANOVA over subjects revealed no trends in the auditory alone condition, indicative also of a greater het-erogeneity of trends across listeners. CP and SM showed no linear trend, NW showed a significant increase in CDT rate, whereas YW showed a significant linear decrease in CDT rate across session. Given the relatively high variability across sessions of CDT, and the small number of measure-ments, this heterogeneity should not be too surprising.
In short, whereas performance in the audio-alone condi-tion appears to be stable, performance improves across ses-sions in the audio-visual condition, but to a diminishing de-gree toward the later sessions. Note too that audio-visual tracking rates become quite high in the later sessions共 maxi-mum rates of CDT under ideal conditions are about 110 wpm—De Filippo and Scott, 1978兲, and this also may be limiting the rate of increase that is possible.
C. Sentences„BKB…
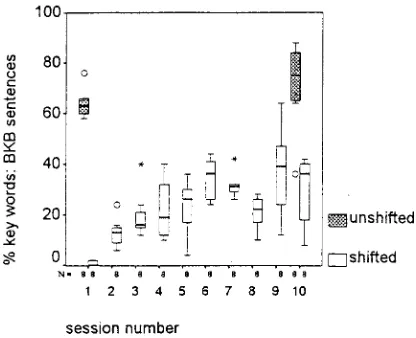
Figure 3 shows the results obtained in the BKB sentence test. As noted above, performance is far superior for un-shifted speech in session 1. However, performance improved significantly across sessions in the shifted condition, even though it did not reach the level obtained for unshifted speech. A statistical model of the results obtained only in sessions 1 and 10 showed a strong session by condition in-teraction ( p⬍0.0001), indicating that performance increased more in the shifted condition than in the unshifted condition. Other analyses showed significant improvements across ses-sions in both conditions, and that performance remained su-perior for the unshifted speech even in session 10.2
Statistical trends across sessions were generally similar to those found for audio-visual CDT. A model describing performance in the shifted condition showed a quadratic de-pendence of words correctly identified on session, indicating performance to be increasing over sessions, with the greatest increases in the early sessions. Although the complexity of the statistical model共and the paucity of data兲makes rigorous investigation of individual differences difficult, inspection of
the model fits showed three of the listeners to be very similar in overall levels of performance and trends across sessions. CP was unusual in showing much less pronounced improve-ments over time. Although a linear fit to CP’s data showed a significant increase in performance across sessions, the slope obtained was about half of that calculated from the other three listeners.
D. Vowels
Results for the vowel test are displayed in Fig. 4. Look-ing first only at results obtained in sessions 1 and 10, the pattern is as found for BKB sentences. Performance was al-ways worse in the shifted condition, even though it improved significantly over the course of training. The increase in per-formance in the unshifted condition is barely significant ( p
⬇0.03) whereas it is highly significant in the shifted condi-tion ( p⬍0.0001). This is also reflected in a strong session by condition interaction.
Trends across sessions were somewhat different than those found for sentences. Here, there was only evidence for a linear improvement in performance, with no significant quadratic term. It therefore appears that performance in-creased linearly over session, with no evidence of a decel-eration. This pattern held for all four listeners, although the slopes varied significantly between them. CP again exhibited a shallower slope than the others, although it did differ sig-nificantly from zero even when tested in a separate analysis of that data alone.
E. Intervocalic consonants„VCVs…
Figure 5 shows performance on the VCV test pooled across listeners. Analysis of the shifted results shows a sig-nificant linear effect of session, with no quadratic trend, just as found with the vowels. The statistical effects were smaller though, and the measured slopes considerably less shallow. In addition, there is no statistical evidence in the complete model of any differences in the slopes among listeners, al-though they did differ in overall level of performance.
Analyses of sessions 1 and 10 again exhibited a strong session by condition interaction ( p⬍0.01), showing that FIG. 3. Box plots of performance with BKB sentences, as a function of
session and condition, across subjects.
performance increased more in the shifted than in the un-shifted condition. In fact, the results from sessions 1 and 10 in the unshifted condition are not statistically different. Moreover, performance with unshifted speech was only bet-ter than that for shifted speech in the first session. At session 10, results from the two conditions are not statistically dif-ferent. This outcome is quite different to those from the other speech tests, in which performance in the shifted condition never reached that attained in the unshifted condition.
A slightly different outcome arose for the perception of place of articulation 共Fig. 6兲. As for percent correct, perfor-mance in the unshifted condition did not change across ses-sions, and shifted performance in session 1 was poorer than for unshifted speech. Here, however, shifted performance at session 10 still did not reach the level of the unshifted con-dition, even though it was significantly better than at session 1. But, just as with percent correct, the shifted results show a significant linear 共but no quadratic兲trend across the ten ses-sions.
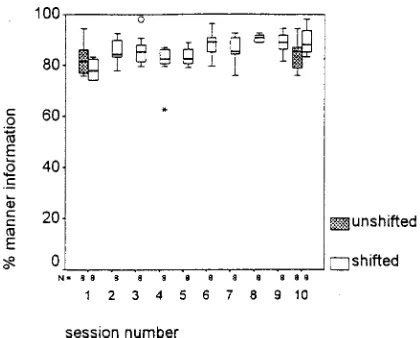
Changes in the accuracy of voicing and manner percep-tion were smaller through training, as would be expected from the greater role temporal and gross spectral aspects play
in signaling these features and the higher initial performance levels 共Figs. 7 and 8兲. Results for voicing were different to those found previously in that there was no significant con-dition by session interaction—rather, there were significant main effects of both factors. This indicates that performance increased to the same degree for shifted and unshifted speech, and that performance with shifted speech was infe-rior at both sessions. These changes in performance are small, however, and may also be constrained by ceiling ef-fects.
For manner, there was again a significant condition by session interaction, but here performance in the shifted con-dition was actually better on average than in the unshifted condition. Subsidiary analyses show that performance in-creased significantly across sessions only for shifted speech. Both voicing and manner perception showed significant linear trends across the ten testing sessions with shifted speech. Manner perception also exhibited a significant qua-dratic term. The form of the predictions for manner were quite varied across subject, with overall changes small in any case. The most important outcome for both these phonetic features was a significant improvement over time 共albeit small兲, but the degree of improvement may have been lim-ited by the relatively high performance overall.
FIG. 5. Box plots of percent correct in the VCV test as a function of session number for both shifted and unshifted conditions, across subjects.
FIG. 6. Percent correct for place of articulation in the VCV test as a func-tion of session number for both shifted and unshifted condifunc-tions.
FIG. 7. Percent correct for voicing in the VCV test as a function of session number for both shifted and unshifted conditions.
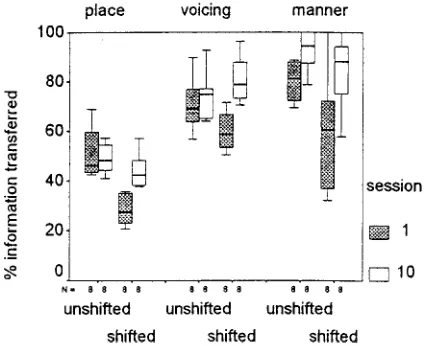
In order to make comparisons of performance across phonetic features that are uncontaminated by different levels of chance performance, Fig. 9 shows information transfer measures as a function of session number and condition. Clearly, overall performance was poorest for place of articu-lation, the phonetic feature which depends most strongly on fine spectral detail. Differences between the shifted and un-shifted conditions were larger in the first session, and tended to diminish over the course of training.
To summarize, performance in the VCV task for shifted speech improved over the course of training, with overall accuracy and perception of manner statistically indistin-guishable from the unshifted condition. However, the results from the perception of place of articulation, expected to be most affected by frequency shifts, suggest that subjects had not quite reached the level of performance they were able to obtain with unshifted speech.
III. DISCUSSION
Two aspects of the current study seem especially strik-ing. First, there is the enormous decrement in performance in understanding speech when processed to contain envelope information in four spectral channels when these are shifted sufficiently in frequency共a fact already known from the ear-lier study of Shannon et al., 1998兲. That different tests suffer different degrees of degradation is easily understood, as it would be expected that speech materials that require effec-tive transmission of detailed spectral information for good performance共e.g., vowels and sentences兲would be more af-fected by a spectral shift than those in which much can be apprehended through temporal cues or gross spectral con-trasts共e.g., consonants兲.
Second, there is the remarkable speed at which listeners learn to compensate for the spectral shift. After just 3 h of experience共not counting the tests themselves, which consist of quite short periods of speech without feedback兲, perfor-mance in the most severely affected tasks 共vowels and sen-tences兲increased from near zero to about one-half the per-formance in the unshifted condition. Also, all listeners
exhibited at least some improvement in all three recorded speech tests, even though the degree of improvement ap-peared to vary across listeners.
It might be argued that an important part of this im-provement with the shifted signals reflects adaptation not only to the spectral shift, but to other aspects of the stimulus transformation and/or testing procedures. We would, how-ever, expect learning of these latter aspects to be reflected in changes in performance for the unshifted signals as well. Although there was learning of this kind, the improvements tended to be small. All three recorded speech tests showed strong statistical evidence that performance increased more for the shifted signals than for the unshifted ones. It is there-fore clear that listeners are learning something about the spectral shift, although it is impossible for us to say exactly what that is.
In light of this evidence, it might seem odd that the audio-alone condition of CDT showed no improvements over sessions. For one thing, it is clear that some very large learning effects at the start of training have been missed
共where tracking rates would have been near zero兲, as subjects did not attempt this condition until session 6, where they already were tracking at a median rate of 30⫹ wpm. There was also a greater degree of variability among the subjects. It may well be that the relatively large variability shown in the CDT task has masked any trends, that training needs to be done over significantly longer periods of time, or even that the level of performance reached here represents the maxi-mum that will ever be achieved. Given the consistent evi-dence of improvements in all the other tasks, this last possi-bility seems unlikely, but a clarification of this issue requires further study.
We cannot, of course, say anything about whether com-pensation to shifted signals would be complete after some further degree of training, how long it would take were it to be possible, nor the extent to which performance might im-prove with training for unshifted speech. Nor do we know the extent to which CDT is effective as a training procedure, whether other procedures would be better, nor indeed whether the progress the subjects made can be attributed pri-marily to the use of CDT. These, though, are secondary questions. What is clear is that subjects were able to improve their performance considerably over short periods of time, periods that are inconsequential from the point of view of an implant patient.
That implant patients do, in fact, adapt to an altered spectral representation is seen most clearly in a recent study by Fu and Shannon 共1999兲. They manipulated the spectral representation of vowels in normal listeners 共using tech-niques similar to the ones we used兲and in users of cochlear implants. The normal listeners, who had little or no opportu-nity to adapt to the altered stimulation, always did best when the analysis and carrier bands matched in frequency 共an un-shifted condition兲. On the other hand, the implant users, with at least six months of experience, always showed best per-formance for the frequency allocations used in their every day speech processor共typically a shifted condition兲, in spite of the fact that electrode insertion depths varied widely over the group.
IV. SUMMARY AND FINAL REMARKS
Spectral distortions of the kind that are likely to be present in multi-channel cochlear implants can pose signifi-cant limitations on the performance of the listener, at least initially. With practice, a substantial part of these decrements can be erased. Although we cannot say on the basis of this study whether place/frequency mismatches can ever be com-pletely adapted to, it is clear that short-term experiments se-riously exaggerate the long-term consequences of such spec-tral shifts. If we were to argue that matching frequency and place is essential, then listeners with shallow electrode pen-etrations should not receive speech information below, say, 1–2 kHz. That such an approach would be preferable to one in which the lowest-frequency band of speech is assigned to the most apical electrode seems highly unlikely to us. For one thing, it is clear that the lower-frequency regions of speech are the best for transmitting the temporal information that can most suitably complement the information available through lipreading. Can we possibly imagine that the shal-lower an electrode array is implanted, the higher should be the band of frequencies we present to the patient? It may well be that patients with shallower electrode penetrations will perform more poorly on average than those with deeper penetrations. But this probably results more from the loss of access to the better-surviving apical neural population
共Johnsson, 1985兲, or from the fact that the speech frequency range must be delivered to a shorter section of the nerve fibre array, than from the place/frequency mismatch per se. It seems entirely possible that the speech perceptual difficulties which implant users experience as a result of a place/ frequency mismatch may be a short-term limitation over-come with experience.
ACKNOWLEDGMENTS
This work was supported by Defeating Deafness 共The Hearing Research Trust兲 and a Wellcome Trust Vacation
Scholarship to LCW共Grant reference No. VS/97/UCL/016兲. Our gratitude goes to the reviewers Bob Shannon, Ken Grant, and James Hillenbrand for their useful comments on an earlier version.
1
The outlier in the audio-visual condition at session number 6 was excluded from the statistical analyses.
2These analyses excluded an outlier for one listener in the unshifted
condi-tion in session 10 where performance is about half the level expected, and in line with results from the shifted condition.
Bench J., and Bamford, J.共Eds.兲 共1979兲. Speech-hearing Tests and the
Spo-ken Language of Hearing-impaired Children共Academic, London兲. Blesser, B.共1972兲. ‘‘Speech perception under conditions of spectral
trans-formation: I. Phonetic characteristics,’’ J. Speech Hear. Res. 15, 5–41. Blesser, B. A. 共1969兲. ‘‘Perception of spectrally rotated speech,’’
Unpub-lished Ph. D., MIT, Cambridge, MA.
De Filippo, C. L., and Scott, B. L. 共1978兲. ‘‘A method for training and evaluating the reception of ongoing speech,’’ J. Acoust. Soc. Am. 63, 1186–1192.
Dorman, M. F., Loizou, P. C., and Rainey, D.共1997兲. ‘‘Simulating the effect of cochlear-implant electrode insertion depth on speech understanding,’’ J. Acoust. Soc. Am. 102, 2993–2996.
Foster, J. R., Summerfield, A. Q., Marshall, D. H., Palmer, L., Ball, V., and Rosen, S.共1993兲. ‘‘Lip-reading the BKB sentence lists: corrections for list and practice effects,’’ Br. J. Audiol. 27, 233–246.
Francis, B., Green, M., and Payne, C.共Eds.兲 共1993兲. The GLIM System: Release 4 Manual共Clarendon, Oxford兲.
Fu, Q. J., and Shannon, R. V.共1999兲. ‘‘Recognition of spectrally degraded and frequency-shifted vowels in acoustic and electric hearing,’’ J. Acoust. Soc. Am. 105, 1889–1900.
Greenwood, D. D.共1990兲. ‘‘A cochlear frequency-position function for sev-eral species—29 years later,’’ J. Acoust. Soc. Am. 87, 2592–2605. Johnsson, L.-G. 共1985兲. ‘‘Cochlear anatomy and histopathology,’’ in
Co-chlear Implants, edited by R. F. Gray共Croom Helm, London兲. Ketten, D. R., Vannier, M. W., Skinner, M. W., Gates, G. A., Wang, G., and
Neely, J. G.共1998兲. ‘‘In vivo measures of cochlear length and insertion depth of nucleus cochlear implant electrode arrays,’’ Ann. Otol. Rhinol. Laryngol. 107, 1–16.
Rosen, S.共1992兲. ‘‘Temporal information in speech: Acoustic, auditory, and linguistic aspects,’’ Philos. Trans. R. Soc. London, Ser. B 336, 367–373. Shannon, R. V., Zeng, F. G., and Wygonski, J.共1998兲. ‘‘Speech recognition with altered spectral distribution of envelope cues,’’ J. Acoust. Soc. Am.
104, 2467–2476.
Shannon, R. V., Zeng, F.-G., Kamath, V., Wygonski, J., and Ekelid, M.