Western University Western University
Scholarship@Western
Scholarship@Western
Electronic Thesis and Dissertation Repository
4-22-2015 12:00 AM
Diabetic Bone Marrow & Stem Cell Dysfunction
Diabetic Bone Marrow & Stem Cell Dysfunction
Meghan A. Piccinin
The University of Western Ontario Supervisor
Zia A. Khan
The University of Western Ontario Graduate Program in Pathology
A thesis submitted in partial fulfillment of the requirements for the degree in Master of Science © Meghan A. Piccinin 2015
Follow this and additional works at: https://ir.lib.uwo.ca/etd
Part of the Cell Biology Commons, Medical Cell Biology Commons, Musculoskeletal, Neural, and Ocular Physiology Commons, and the Nutritional and Metabolic Diseases Commons
Recommended Citation Recommended Citation
Piccinin, Meghan A., "Diabetic Bone Marrow & Stem Cell Dysfunction" (2015). Electronic Thesis and Dissertation Repository. 2774.
https://ir.lib.uwo.ca/etd/2774
This Dissertation/Thesis is brought to you for free and open access by Scholarship@Western. It has been accepted for inclusion in Electronic Thesis and Dissertation Repository by an authorized administrator of
Diabetic Bone Marrow & Stem Cell Dysfunction
(Thesis format: Monograph)
by
Meghan Alyssa Piccinin
Graduate Program in Pathology
A thesis submitted in partial fulfillment of the requirements for the degree of
Master of Science
The School of Graduate and Postdoctoral Studies The University of Western Ontario
London, Ontario, Canada
Abstract
Defects in the proliferation, differentiation, and activity of bone marrow
(BM)-derived vasculogenic/vascular stem cells (VSCs) have been observed in diabetes
and contribute to the development of vascular complications. Diabetes leads to
enhanced bone marrow adipogenesis, altering the composition of the BM stem cell
(SC) niche and potentially disrupting the normal functioning of resident VSCs.
Here, I establish that adipocytes have a negative influence on SC survival in culture.
I also show that adipocytes and osteoblasts are responsible for the creation of
distinct extracellular microenvironments, with unique expression patterns of several
pro- and anti-angiogenic factors with known effects on VSCs, such as fibronectin,
Notch ligands, stromal cell-derived factor-1, and angiopoietin-1 and -2. I conclude
that alterations in marrow composition may mediate the connection between
hyperglycemia, VSC dysfunction, and impaired vascular repair in diabetes.
Keywords: diabetes, bone marrow, mesenchymal progenitor cells, adipogenesis,
Co-Authorship Statement
Manuscript:Pathophysiological role of enhanced bone marrow adipogenesis
in diabetic complications.
Adipocyte. 2014; 3(4): 263-272
Meghan A. Piccinin Drafted the manuscript
Zia A. Khan Supervisor; edited and finalized the manuscript
Chapters 2-4 also contain material from a manuscript in preparation which is
co-authored by Meghan A. Piccinin and Zia A. Khan. Meghan Piccinin performed all
Acknowledgments
Before starting in the lab, I attended the public lecture of a former Khan lab member, Emily Keats. She began her presentation by saying that she’s learned more in four years than most will learn in a lifetime. I assumed this statement was a hyperbole, but during my short tenure under Zia Khan, I have similarly learned vastly more than I ever could of imagined. Your incredible dedication and love for science have been inspiring and I am honoured to have had you as my supervisor.
I would also like to acknowledge my advisory committee members, Drs. Cheryle Seguin and Christopher Howlett, for their direction and guidance. In our few meetings together, your questions and thoughtful advice helped me to shape this project into what it is now and I am grateful for your time and expertise.
I have to thank all the members of the Department of Pathology who have helped me throughout my studies. I would like to acknowledge Dr. Chakrabarti and Michael Ruiz for generously allowing me to use the bones from their diabetic rat model for my project. I have to thank the Pathology administrative staff, especially Tracey for answering any and all of my questions, and Kathilyn and Rodney for printing my many posters.
Table of Contents
Abstract ii
Co-Authorship Statement iii
Acknowledgments iv
Table of Contents v
List of Tables viii
List of Figures ix
List of Abbreviations xi
Chapter 1 : Introduction 1
1 Introduction 1
1.1 Diabetes 1
1.1.1 Epidemiology 2
1.1.2 Diabetic Vascular Complications 3
1.2 Stem Cells in the Bone Marrow 9
1.2.1 Mesenchymal Precursors 11
1.2.2 Vascular Stem Cells 18
1.2.3 Stem Cell Niche 24
1.3 Bone and Marrow Complications of Diabetes 26
1.5 Hypothesis 39
1.6 Specific Aims 39
Chapter 2 : Materials and Methods 40
2 Materials and Methods 40
2.1 In Vitro Studies 40
2.2 In Vivo Model 41
2.2.1 RNA Isolation from Marrow Samples for qPCR 42
2.3 Measurement & Assessment 42
2.3.1 RNA Isolation and qRT-PCR 42
2.3.2 Immunofluorescence Cell Staining 54
2.3.3 Statistical Analyses 58
Chapter 3 : Results 59
3 Results 59
3.1 Effect of ECM Substrates on Adipogenesis 59
3.2 Establishing Co-culture of CD133-Positive Cells with Adipocytes and
Osteoblasts 61
3.3 Effect of Co-culturing CD133-Positive Cells with BM-MPCs, Adipocytes, or
Osteoblasts 66
3.4 BM-MPC, Adipocyte, and Osteoblast Contribution to SC Niche 70
3.5 Identifying Potential Role of Ang1 & Ang2 in SC Niche 89
3.7 In Vivo Diabetic Model 95
Chapter 4 : Conclusions 99
4 Conclusions 99
4.1 Discussion 99
4.2 Limitations 121
4.3 Future Directions 124
4.3.1 Confirming Gene and Protein Expression throughout Differentiation 124
4.3.2 Effects of Identified Target Genes on CD133-Positive Cells 124
4.3.3 Hindlimb Ischemia Model with Altered BM Composition 125
Chapter 5 : References 127
Appendix A: Copyright Permissions 177
List of Tables
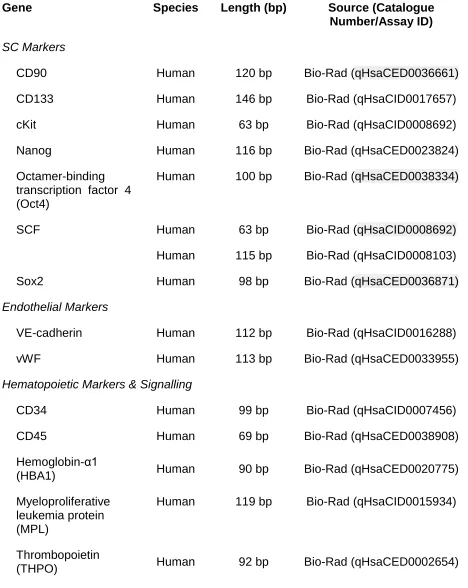
Table 2.1. Primer sequence information for niche gene qRT-PCR custom plate
array. ...43
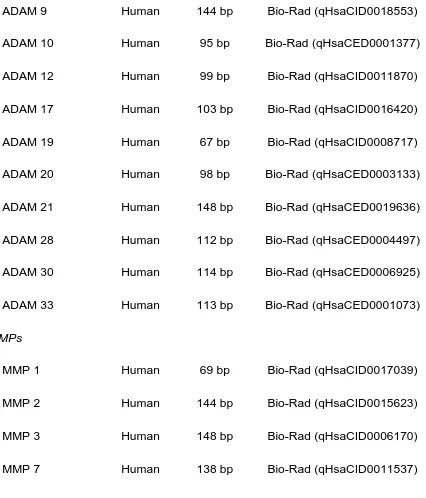
Table 2.2. Primer sequence information for ECM gene qRT-PCR custom plate
array. ...47
Table 2.3. Primer sequence information for qRT-PCR individual primers used for in
vitro experimental analyses. ...51
Table 2.4. Primer sequence information for qRT-PCR primers used for in vivo
experiment analyses. ...52
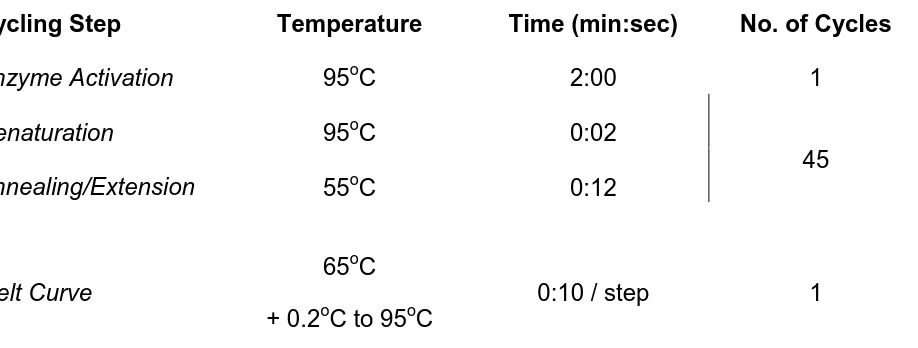
Table 2.5. Temperature profiles for qRT-PCR with SsoFast EvaGreen Supermix. .55
Table 2.6. Temperature profiles for qRT-PCR with qBiomarker SYBR Green Fluor
Mastermix. ...56
Table 2.7. Primary antibodies used for immunofluorescence staining. ...57
Table 3.1. Treatment conditions for Ang1-Ang2 overabundance experiment. ...90
Table 3.2. Clinical variables of control and diabetic rats used in in vivo model of
List of Figures
Figure 1.1. Mechanisms of hyperglycemia-induced endothelial damage in diabetes.
... 6
Figure 1.2. Impaired vascular repair in diabetes. ... 8
Figure 1.3. Developmental origin and potential of marrow-resident SCs. ...10
Figure 1.4. Key transcription factors regulating MPC differentiation. ...13
Figure 1.5. Schematic illustrating adipogenic determination and terminal differentiation. ...16
Figure 1.6. Schematic of interactions between BM SC niche components. ...25
Figure 1.7. Hyperinsulinemia promotes adipogenesis in MPCs...29
Figure 3.1. Effect of ECM substrates on adipogenesis. ...60
Figure 3.2. Immunofluorescence staining of CD133+ cells in BM-MPC co-culture. .62 Figure 3.3. Immunofluorescence staining of CD133+ cells in adipocytic co-culture. ...63
Figure 3.4. Immunofluorescence staining of CD133+ cells in osteoblastic co-culture. ...64
Figure 3.5. SC gene expression in CD133+ cells, MPCs, adipocytes, and osteoblasts. ...65
Figure 3.6. SC gene expression in adherence co-culture of CD133+ cells with MPCs. ...67
Figure 3.8. SC gene expression in adherence co-culture of CD133+ cells with
osteoblast co-culture. ...69
Figure 3.9. SC gene expression in CD133+ cell co-cultures for survival after one
day. ...72
Figure 3.10. SC gene expression in CD133+ cell co-culture for survival after 21
days. ...74
Figure 3.11. Ki67 stain for proliferation of BM-MPCs, adipocytes, and osteoblasts. 76
Figure 3.12. ECM gene expression by MPCs, adipocytes, and osteoblasts. ...79
Figure 3.13. Expression of ECM remodeling protein genes by MPCs, adipocytes,
and osteoblasts. ...83
Figure 3.14. Expression of Notch signalling genes in MPCs, adipocytes, and
osteoblasts. ...85
Figure 3.15. Cell adhesion molecule gene expression in MPCs, adipocytes, and
osteoblasts. ...86
Figure 3.16. Expression of SDF-1 in MPCs, adipocytes, and osteoblasts. ...87
Figure 3.17. Expression of angiopoietin genes in MPCs, adipocytes, and
osteoblasts. ...88
Figure 3.18. Expression of SC and EC markers in CD133+ cells upon Ang
exposure. ...91
Figure 3.19. Expression of cell adhesion molecules and niche receptors in CD133+
cells. ...94
Figure 3.20. In vivo expression of adipogenic, osteogenic, MPC, and SC markers in
List of Abbreviations
ADAM A disintengrin and metalloproteinase
AGE Advanced glycation end-products
ALP Alkaline phosphatase
Aminopeptidase A Glutamyl aminopeptidase
AMPK Adenosine monophosphate-activated protein kinase
Ang1 Angiopoietin 1
Ang2 Angiopoietin 2
ATP Adenosine-5’-triphosphate
BH4 Tetrahydrobiopterin
BADGE Bisphenol A diglycidyl ether
BM Bone marrow
BMD Bone mineral density
BMP Bone morphogenic protein
CBF Core-binding factor subunit
C/EBP CCAAT-enhancer-binding protein
CXCR4 C-X-C chemokine receptor type 4
DLL4 Delta-like ligand 4
DMEM Dulbecco’s Modification of Eagle Medium
EC Endothelial cell
eNOS Endothelial nitric oxide synthase
EPC Endothelial progenitor cell
ERK Extracellular signal-regulated kinase
FABP4 Fatty acid binding protein 4
FADH2 Flavin adenine dinucleotide
FAK Focal adhesion kinase
FAS Fatty acid synthase
FBS Fetal bovine serum
FFA Free fatty acid
FN Fibronectin
FOXO1 Forkhead box protein O1
GAPDH Glyceraldehyde 3-phosphate dehydrogenase
GDM Gestational diabetes mellitus
GLUT1 Glucose transporter 1
HDAC Histone deacetylase
HBA1 Hemoglobin-α1
HSPG2 Heparan sulfate proteoglycan 2; also known as perlecan
HIF Hypoxia-inducible factor
IGF-2 Insulin-like growth factor-2
IGF1R Insulin-like growth factor-1 receptor
IR Insulin receptor
IRS Insulin receptor substrate
JAG1 Jagged-1
LPL Lipoprotein lipase
MEK Mitogen-activated protein kinase kinase
MMP Matrix metalloproteinase
MNC Mononuclear cell
MPC Mesenchymal progenitor cell
MPL Myeloproliferative leukemia protein
MSC Mesenchymal/mesodermal stem cell
mTOR Mammalian target of rapamycin
NADH Nicotinamide adenine dinucleotide
N-cadherin Neural cadherin
NO Nitric oxide
NPH Neutral Protamine Hagedorn
Oct4 Octamer-binding transcription factor 4; also known as POU5F1
PECAM-1 Platelet endothelial cell adhesion molecule-1; also known as
PKB Protein kinase B; also known as Akt
PKC Protein kinase C
PKD-1 Protein kinase D-1
PPARγ Peroxisome proliferator-activated receptor-γ
PSF Penicillin, streptomycin, & fungizone (amphotericin)
RAGE Receptor for advanced glycation end products
qRT-PCR Quantitative Reverse transcription polymerase chain reaction
ROS Reactive oxygen species
Runx2 Runt-related transcription factor 2; also known as CBFα1
RXR Retinoid X receptor
SC Stem cell
SCF Stem cell factor
SCL Stem cell leukemia
SDF-1 Stem/stromal cell-derived factor-1; also known as CXCL12
SEM Standard error of the mean
Shh Sonic hedgehog
SMC Smooth muscle cell
Sox9 Sex determining region Y-box 9
SREBP1c Sterol regulatory element-binding protein 1c; also known as
TCA cycle Tricarboxylic acid cycle
THPO Thrombopoietin
Tie-1 Tyrosine kinase with immunoglobulin-like and EGF-like
domains-1
Tie-2 Tyrosine kinase with immunoglobulin-like and EGF-like
domains-2; also known as TEK tyrosine kinase
TIMP Tissue inhibitor of metalloproteinase
TZD Thiazolidinedione
VCAM Vascular cell adhesion molecule
VE-cadherin Vascular endothelial cadherin
VEGF Vascular endothelial growth factor
VEGFR-2 Vascular endothelial growth factor receptor-2; also known as
Flk-1
VSC Vascular stem cell; also known as an angioblast
vWF von Willebrand factor
Chapter 1 : Introduction
11
Introduction
1.1 Diabetes
Diabetes mellitus is a chronic metabolic disease characterized by insufficient
cellular responses to high blood glucose. Type 1 diabetes, comprising 5-10% of all
cases, is generally considered to be a disease of the young, with most patients
diagnosed before the age of twenty1, 2. This disorder is characterized by autoimmune
destruction of the pancreatic β-cells responsible for the production of insulin in response
to glycemic load1, 2. Destruction of β-cells results in an absolute insulin deficiency and
high blood glucose levels. The cause of type 1 diabetes is considered to be polygenic
and multifactorial2. Type 2 diabetes, also known as noninsulin-dependent diabetes
mellitus, comprises the bulk of the instances of the disorder and involves a relative lack
of insulin signalling stemming from peripheral insulin resistance and β-cell dysfunction1,
3
. In this form, hyperglycemia develops slowly over the course of several years1.
During this asymptomatic period, hyperinsulinemia may occur as the β-cells of the
pancreas struggle to keep up with the ever-increasing insulin resistance of target
tissues, allowing for inappropriate hepatic gluconeogenesis1, 3. Beta-cell function begins
1
to falter gradually over time, reducing insulin secretion and resulting in hyperglycemia4.
A third form of the disease is gestational diabetes mellitus (GDM), which is initially
diagnosed during pregnancy1, 5. GDM is characterized by insulin resistance and a
considerable reduction in β-cell function by late pregnancy5, 6
. GDM affects
approximately 14% of pregnancies, and although the majority of cases resolve
post-partum, those affected have a 65% chance of developing type 2 diabetes in the five
years following delivery1, 5-7.
1.1.1 Epidemiology
Diabetes is an incredibly prevalent disease, afflicting an estimated 347 million
individuals worldwide as of 20088. In the United States alone, there are approximately
20.9 million diabetes sufferers, with a prevalence of 6.9% in men and 5.9% in women9.
These prevalence estimates have increased sharply since 1980, by 156% in men and
103% in women, and is predicted to continue rising, even while holding the current
levels of obesity constant9, 10. If existing trends persist, one in three U.S. adults is
anticipated to have diabetes by 205011. Diabetes was responsible for 5.1 million deaths
globally in 2013, with one person dying of the disease every six seconds12. The disease
is anticipated to become the fifth leading cause of mortality worldwide by the year 2030,
underlying 3.5% of all deaths13. This disease represents a massive burden on the global
economy through significant reductions in productivity and the 2.3-fold increase in the
utilization of health care resources by diabetics14. Twelve percent of worldwide health
care expenditure is related to the care of diabetes, including $548 billion spent in the
1.1.2 Diabetic Vascular Complications
In developed countries, the morbidity associated with diabetes is primarily
associated with secondary sequelae rather than the acute complications, such as
ketoacidosis and diabetic coma, which are pervasive in low- and middle-income
nations17. An estimated 72% of diabetics suffer from at least one long-term vascular
complication of the disease16. Vascular complications can broadly be divided into two
categories on the basis of the size of the blood vessel affected. Microvascular sequelae
include retinopathy, neuropathy, cardiomyopathy, and nephropathy, while peripheral
vascular disease and coronary artery disease are common macrovascular
complications16. These complications are the consequence of hyperglycemia-induced
damage to blood vessels and aberrant vascular repair mechanisms.
1.1.2.1
Mechanisms of Diabetic Vascular Complications
The endothelial cells (ECs) comprising the tunica intima, the innermost layer of
the vasculature, are the first cells in the body to encounter chronically elevated blood
glucose levels in diabetes. The most abundant glucose transporter isoform expressed
by ECs is glucose transporter 1 (GLUT1), which aids in the facilitated diffusion of
glucose across the plasma membrane18-20. The expression and function of GLUT1 is
non-responsive to changes in glucose or insulin concentration, resulting in increased
glucose uptake under hyperglycemic conditions and heightened intracellular glucose
levels20-23. The cytosolic glucose is then processed via glycolysis and the tricarboxylic
acid (TCA) cycle to generate electron donors nicotinamide adenine dinucleotide (NADH)
system and provide energy to pump protons across the mitochondrial membrane22. A
transmembrane voltage gradient is then established, which can be harnessed to drive
production of adenosine-5’-triphosphate (ATP)22
. With excess glucose being processed
through the TCA cycle in hyperglycemic conditions, an increased number of electrons
are transferred into the electron transport chain, raising trans-membrane
hyperpolarization until a threshold limit is reached22. Electron movement is then halted
at complex III, resulting in an accumulation of electrons at coenzyme Q22. Coenzyme Q
dissipates this excess charge through the partial reduction of molecular oxygen to form
the free radical superoxide anion22.
Superoxide is able to exert its detrimental effects on the vasculature through a
number of mechanisms. The superoxide anion is able to inactivate nitric oxide (NO) by
converting the potent vasodilator into peroxynitrite24, 25. Peroxynitrite acts as an
oxidizing agent, reacting with tetrahydrobiopterin (BH4) which serves as a requisite
cofactor for endothelial nitric oxide synthase (eNOS)26. This results in uncoupling of
eNOS, favoring the generation of superoxide over NO production and leading to an
accumulative increase in reactive oxygen species (ROS) and runaway inhibition of NO
bioactivity27, 28.
This overactive production of ROS, both directly from the electron transport chain
and indirectly through uncoupled eNOS activity, leads to the induction of four
mechanisms which stimulate primary biochemical changes within ECs: 1) increased
activity of the polyol pathway, 2) generation of advanced glycation end-products
(AGEs), 3) activation of protein kinase C (PKC), and 4) stimulation of the hexosamine
leads to endothelial dysfunction through further induction of ROS production, the
release of inflammatory cytokines, increased synthesis of extracellular matrix
components, diminished EC migration and proliferation, and endothelial apoptosis
(Figure 1.1)22, 29-37.
In addition to diminishing the production of NO, hyperglycemia and
hyperinsulinemia further potentiate the vasoactive effects of diabetes by stimulating the
production and activation of the most powerful known endogenous vasoconstrictor,
endothelin-138-40. Hyperglycemia appears to enhance endothelin-1 activity through the
increased activation of PKC-β and –δ, while insulin likely exerts its effect via the tyrosine
kinase activity of the insulin receptor (IR)38-40. Interactions between endothelin-1 and its
receptors on vascular smooth muscle cells results in the release of Ca2+ from
intracellular stores and the opening on non-specific cation channels41. This leads to
depolarization sufficient to activate L-type Ca2+ channels and induce perivascular cell
contraction and vasoconstriction41, 42. Increased levels of endothelin-1 mRNA and
peptide have been observed in several organs known to be susceptible to diabetic
complications, such as the heart, kidneys, and retina38, 43-45. The dual vasoactive
effects of hyperglycemia on NO and endothelin-1 lead to diminished endothelial
integrity, culminating in impaired perfusion of targeted tissue and ischemia46, 47.
In the healthy patient, vascular repair mechanisms would be employed to restore
the damaged blood vessels and preserve the function and circulation of affected tissues
(Figure 1.2 A)46. Revascularization may occur through the proliferation and migration of
Figure 1.1. Mechanisms of hyperglycemia-induced endothelial damage in
diabetes.
Glucose enters and accumulates in ECs via Glut1, which is non-responsive to changes
in glucose concentration. Disproportionate glucose metabolism overwhelms the
electron transport chain, causing an accumulation of electrons at coenzyme Q. This
excessive charge is then dissipated through the partial reduction of molecular oxygen
into the free radical superoxide. Superoxide promotes the conversion of the potent
vasodilator NO into inactive peroxynitrite and uncoupling of eNOS, leading to a loss of
vasoregulation. Superoxide also stimulates the generation of other ROS, which by
several distinct mechanisms, mediate EC dysfunction and survival.
[AGE = advanced glycation end product; EC = endothelial cell; FADH2 = flavin adenine
A
Figure 1.2. Impaired vascular repair in diabetes.
(A) In healthy individuals, endothelial injury would signal for the mobilization of stem
cells from the BM into circulation and contribute to vascular regeneration. Injury may
cause some vascular stem cells to produce lineage-restricted EPCs which home to the
site of injury and repair damaged vasculature, though the identity of these cells is not
fully clear. (B) In diabetics, this response to endothelial damage is disrupted, through a
combination of reduced VSCs in the marrow and impaired EPC migration and
vasculogenic function.
bone marrow (BM)-derived endothelial progenitor cells (EPCs) to the site of injury48-50.
This response is disrupted and occurs unevenly in type 1 diabetics with poor glycemic
control and nearly all type 2 diabetic subjects (Figure 1.2 B)51. The non-uniform
distribution of vascular repair leads to divergent, tissue-specific complications, with
heightened retinal and renal vessel formation and a lack of revascularization in the
lower limbs and heart52-56. These pathological changes may be partially resultant from
deficits in EPC development, proliferation, migration, and/or function. Analyses of EPCs
from most diabetic subjects reveal a reduced number in both the circulation and the
bone marrow, as well as impaired proliferation, mobilization, and capacity for vessel
formation56-66. The mechanisms underlying these cellular changes have not yet been
fully elucidated, but may relate to the diabetes-induced alterations to the BM
microenvironment from which EPCs originate.
1.2 Stem Cells in the Bone Marrow
The primary role of the BM is to support the maintenance and differentiation of
hematopoietic stem cells (HSCs). In addition to blood cell precursors, the marrow is
also an abundant source of other precursors including mesenchymal and vascular cells.
Each of these progenitor cell classes reside within a hierarchy of progressively more
differentiated cell types (Figure 1.3). HSCs are responsible for the formation of novel
blood cells, generating leukocytes, erythrocytes, and thrombocytes. Mesenchymal
precursors regulate the creation of the marrow stroma that supports the HSC
population, while vascular stem cells (VSCs) serve as a pool of progenitors for blood
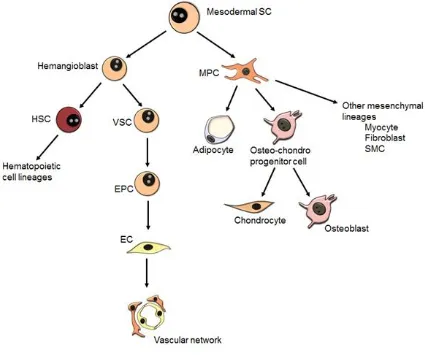
Figure 1.3. Developmental origin and potential of marrow-resident SCs.
Hypothesized model of stem cell hierarchy in the marrow showing mesodermal SCs
giving rise to embryonic hemangioblasts and mesenchymal progenitor cells (MPCs, also
known as mesenchymal stem/stromal cells (MSCs)). In the developing embryo,
hemangioblasts serve as precursors for hematopoietic and vascular lineages, though
the postnatal existence of hemangioblasts is disputed. MPCs have a tri-lineage
differentiation potential and able to develop into adipocytes, osteoblasts, and
chondrocytes.
[EC = endothelial cell; EPC = endothelial progenitor cell; HSC = hematopoietic stem
cell; MPC = mesenchymal progenitor cell; SC = stem cell; SMC = smooth muscle cell;
1.2.1 Mesenchymal Precursors
The first description of mesenchymal precursors in the BM came from
Friedenstein, Chailakhjan, and Lalykina in 1968, who observed a monolayer of
colony-forming fibroblastic cells developing from guinea pig marrow aspirates67. These
mesenchymal precursors are possibly the most abundant precursor type in the marrow
yet their identity and true differentiation potential is obscure and controversial. These
cells are often referred to as marrow/mesenchymal stem/stromal cells (MSCs) in the
literature. I have elected to refer to these cells as mesenchymal precursor/progenitor
cells (MPCs) due to the lack of experimental evidence for the ‘stem’ cell phenotype and
hematopoietic differentiation ability. Furthermore, stromal cell definition may also be
misleading depending on the context. For example, a well-known function of these
mesenchymal precursors is tissue repair following injury and thus, not solely a
supportive framework for other functional cell types within the BM. Therefore, I believe
a proper term for these cells is mesenchymal progenitor/precursor cell.
MPCs have typically been isolated from the BM mononuclear cell fraction on the
basis of their adherence to plastic surfaces relative to hematopoietic cells, although this
imprecise method invariably results in a contaminated heterogeneic cell population68-70.
As the characterization of MPCs improved and selective surface markers were
identified, monoclonal antibodies such as Stro-1 have been employed in order to better
isolate a homogenous subset of cells for experimentation and analysis68, 69. Other
surface antigens of mesenchymal precursors include CD73, CD90, and CD105, though
CD79α in order to exclude cells with a hematopoietic phenotype71, 72
. Additionally, the
cells must be capable of in vitro differentiation into osteoblasts, adipocytes, and
chondroblasts (Figure 1.4), though in vivo, chondrogenesis is typically localized to the
osteochondral environment of joint cavities as opposed to our primary area of interest,
the BM71, 73, 74.
1.2.1.1
Osteoblastogenesis & Chondrogenesis
The predominant factor involved in regulating osteoblastic differentiation is
Runt-related transcription factor 2 (Runx2; also known as core-binding factor subunit α 1
(CBFα1)75. Once induced by bone morphogenic protein-7 (BMP7), Runx2 and its
heterodimeric subunit CBFβ bind the Runx consensus sequence present in the
promoter regions of key osteoblastic genes, leading to the development of MPCs into
osteochondro-progenitor cells76-78. Runx2-induced expression of the transcription factor
Sp7 (also known as osterix) guides these bi-potential cells towards the osteoblastic
lineage, while repressing Sex determining region-Y box 9 (Sox9) that directs
chondrogenic development77, 79. Together, Runx2 and Sp7 drive the expression of the
major osteoblastic genes that contribute to the bone cell phenotype, including bone
gamma-carboxyglutamic acid-containing protein (BGLAP; also known as osteocalcin),
collagen 1A1, and osteopontin76, 80. Additionally, Runx2 also plays a major role in
suppressing the cell division of differentiating progenitor cells, entering osteoblasts into
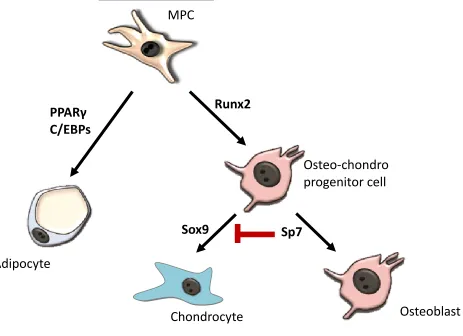
Figure 1.4. Key transcription factors regulating MPC differentiation.
MPCs differentiate into adipocytes upon induction of PPARγ and the C/EBP family of
transcription factors. Activation of Runx2 stimulates MPC commitment to osteoblastic
or chondrogenic lineages. Subsequent expression of Sox9 directs differentiation
towards chondrocytes, while Sp7 inhibits this pathway to facilitate osteoblastogenesis.
[C/EBP = CCAAT-enhancer-binding protein; MPC = mesenchymal progenitor cell; PPARγ = peroxisome proliferator-activated receptor γ; Sox9 = sex determining region
Y-box 9]
MPC
Runx2
Adipocyte
Chondrocyte
Osteoblast
Osteo-chondro
progenitor cell
PPARγ
C/EBPs
1.2.1.2
Adipogenesis
Adipogenic differentiation of MPCs is a biphasic process, broadly divided into two
stages: determination and terminal differentiation. In culture, the process requires
approximately seven days from the initiation of adipogenic stimulation and is tightly
regulated by an intricate cascade of transcription factors and ligand-receptor
interactions82.
1.2.1.2.1
Adipogenic Determination
Determination involves commitment of precursor cells to development along the
adipogenic lineage as a pre-adipocyte (Figure 1.5A). At this stage, pre-adipocytes
remain morphologically identical to their precursor, although these cells have lost the
ability to differentiate along any other developmental pathway82, 83. The molecular
mechanisms and interactions underlying adipogenic commitment are not well
understood. BMP4 is believed to play an important role in determination, having
repeatedly been shown capable of committing murine C3H10T1/2 cells to adipocyte
development84-87. Hypomethylation of the BMP4 locus is suspected to be involved, as
treatment with 5-azacytidine, a potent DNA methyltransferase inhibitor, is able to induce
commitment of precursor cells to the adipogenic lineage by increasing the accessibility
of the BMP4 transcriptional start site88, 89. Interactions between BMP4 and its cell
surface receptor BMP4R1A result in the rapid phosphorylation of Smad1/5/8, which
complexes with Smad486. This protein complex undergoes nuclear translocation, where
Figure 1.5. Schematic illustrating adipogenic determination and terminal
differentiation.
Differentiation of MPCs into adipocytes is governed by a tightly-regulated transcriptional
cascade. (A) The first stage of adipogenesis involves commitment of MPCs to the
adipogenic lineage in a process known as determination. Determination is primarily
regulated by a BMP and Smad signalling pathway. (B) Terminal differentiation of committed preadipocytes into mature adipocytes begins with C/EBP-β and C/EBP-δ inducing the transcription of PPARγ and C/EBPα, which are then able to facilitate the
transcription of genes responsible for producing the adipocytic phenotype.
[BMP4 = bone morphogenic protein 4; BMP4R1A = bone morphogenic protein 4
receptor 1A; C/EBP = CCAAT-enhancer-binding protein; ERK = extracellular
signal-regilated kinase; FABP4 = fatty acid binding protein 4; Glut4 = glucose transporter 4; IR
well-studied murine pre-adipocyte cell lines, determination and terminal differentiation
are separated by a brief period of proliferation, known as mitotic clonal expansion,
though it has previously been demonstrated that this stage is not a requirement for
human BM-MPC development91, 92.
1.2.1.2.3
Terminal Differentiation
The terminal differentiation of committed progenitor cells into mature adipocytes
is largely controlled by peroxisome proliferator-activated receptor-γ (PPARγ), which is
known as ‘the master regulator of adipogenesis’, and the CCAAT-enhancer-binding
protein (C/EBP) family of transcription factors. Pro-adipogenic stimuli promote the
hyper-phosphorylation and activation of C/EBP-β by mitogen-activated protein kinase
kinase (MEK)/extracellular signal-regulated kinase (ERK) signalling93, 94. C/EBP-β acts
synergistically with C/EBP-δ to enhance the expression of PPARγ and C/EBP-α through
direct binding to potential C/EBP sites located within the PPARγ and C/EBP-α promoter
regions83, 95. PPARγ and C/EBP-α form a positive feedback loop, in which each factor
is capable of promoting the expression of the other in order to maintain the
differentiated state96, 97. C/EBP-α is also able to bind its own C/EBP-regulatory element
to reinforce its own expression independently of PPARγ-mediated regulation98. PPARγ,
in tandem with its heterodimeric partner retinoid X receptor (RXR), and C/EBP-α act in
concert to stimulate the expression of a number of adipocyte-specific genes, including
fatty acid binding protein-4 (FABP4), Glut4, lipoprotein lipase, glycerophosphate
also becomes phosphorylated by cyclin D3, resulting in the formation of
growth-inhibitory complexes in order to enter adipocytes into a non-proliferative state99.
1.2.2 Vascular Stem Cells
VSCs are defined as “self-renewing multipotent stem cell[s] that [give] rise to
vascular lineages”100
. VSCs, which may also be known as angioblasts, share a
common developmental origin with HSCs as hemangioblasts residing within embryonic
blood islands, though some evidence suggests that hemangioblasts may persist into
adulthood in small numbers within the BM101-103. The development of a hemangioblast
into either a VSC or an HSC is contingent on the expression of vascular endothelial
growth factor (VEGF) receptor-2 (VEGFR-2; also commonly known as fetal liver
kinase-1 or Flk-kinase-1) and the stem cell leukemia (SCL) transcription factor, respectively104, 105.
SCL appears to be the predominant director of hemangioblast development and
hematopoietic fate via Runx1 signalling, while VEGFR-2 is necessary for vascular
lineage progression104-107. Hemangioblasts have been characterized by the expression
of VEGFR-2 and SCL, along with CD133 (a stem and progenitor cell marker; also
known as AC133 or prominin-1) and CD34 (a cell adhesion factor mediating stem cell
(SC) attachment to the BM)101, 103. Stimulation of VSCs with VEGF induces their
development into lineage-restricted EPCs, which can then enter into circulation,
differentiate into mature ECs, and contribute to the formation or repair of the
1.2.2.1
Endothelial Progenitor Cells
EPCs are committed progenitor cells that will eventually give rise to the ECs that
participate in the repair of damaged vasculature110. BM-derived EPCs enter into
circulation and migrate to the site of vascular injury, where they restore impaired blood
flow111, 112. Vessel repair may be comprised of angiogenesis and vasculogenesis. In
angiogenesis, blood vessels are formed by sprouting or intussusception (splitting) of
pre-existing vascular networks113. Vasculogenesis denotes the de novo formation of
blood vessels from precursor cells. In the embryo, vasculogenesis is employed in the
formation of the earliest vascular plexus, after which angiogenesis was originally
believed to take over as the predominant mechanism of vessel formation113-115. Only
relatively recently has vasculogenesis been accepted as a complementary method of
postnatal neovascularization, with circulating EPCs now serving as a novel biomarker
for vascular health116-120.
Asahara and colleagues were the first to identify and isolate EPCs from adult
circulation in 1997121. EPCs were obtained through magnetic bead selection for
CD34-positive cells in the leukocyte fraction of peripheral blood. After seven days of culture,
these progenitor cells adopted an endothelial-like phenotype and gene expression
pattern. Labelled CD34-positive cells were then injected into an athymic mouse model
of hind limb ischemia to evaluate vasculogenic capacity. After 6 weeks, there was
significant incorporation of CD34-positive cells into capillaries of the ischemic limb
relative to an injection of control CD34-depleted cells, suggesting a great potential of
in postnatal circulation, these cells have since been shown to significantly contribute to
vessel formation in both physiological and pathological capacities46, 49, 122, 123.
EPCs that have entered into circulation can be obtained through culture of
peripheral blood mononuclear cells in a VEGF-containing medium108, 124.
Characterizing EPCs has proven difficult, largely due to the co-occurrence of mature
circulating ECs, likely shed from the vessel walls, within peripheral circulation46.
Additionally, there appear to be two distinct categories of EPCs that are able to
contribute to blood vessel repair and development125. These two cell types can be
distinguished primarily on the basis of their morphology and ability to proliferate124, 126.
Early-outgrowth EPCs are spindle-shaped CD14- and CD45-positive cells that appear
after about 10-14 days of culture and exhibit a low propensity for mitogenesis125-131.
This population is believed to arise from the reprogramming of myeloid progenitors or
monocytes into cells with an endothelial-like phenotype130-134. Also contained within the
peripheral blood mononuclear fraction is a small subset of cobblestone-shaped, highly
proliferative cells, known as late-outgrowth colonies or endothelial colony-forming cells
that appear after three or more weeks of culture126, 128, 129, 135-137. Late-outgrowth cells
are free from monocytic and hematopoietic markers and correspond to BM-derived
EPCs138. Both early- and late-outgrowth cell types appear to have a similar capacity for
angiogenesis in vivo, though early EPCs were shown to be incapable of forming the
capillary-like structures characteristic of vasculogenesis126, 129, 139, 140. From this point
forward, discussion of EPCs will centralize solely on the BM-derived late-outgrowth EPC
As an intermediate between SCs and mature ECs, EPCs express markers of
both stem and fully differentiated cells141. In the BM, VSC precursors able to give rise to
EPCs are characterized by the expression of VEGFR-2, CD34, and CD133142-144.
CD133 is the only one of these markers not expressed by mature endothelial cells,
which allows EPCs or cells capable of giving rise to EPCs to be distinguished from the
circulating EC population50, 115. A single surface marker specific to EPCs has yet to be
described, although CD133 is currently considered to be the putative marker for the
identification of EPCs145-147. Functional characteristics of EPCs include the ability to
uptake acetylated low density lipoprotein and adhere to the fucose-binding lectin Ulex
europaeus agglutinin-1, which are features also shared by mature ECs127, 135. Upon
activation, BM-EPCs enter peripheral circulation and increase their expression of
endothelial markers, such as vascular endothelial-cadherin (VE-cadherin), von
Willebrand factor (vWF), tyrosine kinse with immunoglobulin-like and EGF-like domains
2 (Tie-2), eNOS, and CD31 (also known as platelet endothelial cell adhesion molecule-1
or PECAM-1), and reduce expression of the SC marker CD133108, 113, 148. Once fully
differentiated and incorporated into the endothelium, the expression of CD133 is
abolished148-150. In culture, CD133 is lost upon adherence of cells to culture plates.
While the expression of VEGFR-2 persists following maturation, CD34 may or may not
be expressed by differentiated ECs depending on the size of the blood vessel113, 148.
Though the specific cellular and non-cellular interactions in the marrow that
govern EPC derivation and release into circulation are poorly understood, a number of
studies have unanimously reported that the proliferation, differentiation, and migration of
prevents the proteosomal degradation of heterodimeric hypoxia-inducible factor (HIF)
within resident cells by a pair of mechanisms151. Under normoxic conditions,
hydroxylation of two prolyl residues of the HIF-α subunit facilitates the protein’s
interaction with a ubiquitin ligase and targets the protein for destruction151-155.
Additionally, a HIF-α carboxyl-terminal asparginyl residue may undergo β-hydroxylation
in order to prevent the binding of the transcriptional co-activator p300151, 153, 156. Both of
these hydroxylation reactions require the use of molecular oxygen as a requisite
cofactor157, 158. Under ischemic conditions, the failings of these regulatory measures are
unable to target HIF to the proteosome or prevent the transcriptional activity of the
protein. HIF can then up-regulate the expression and secretion of VEGF and
stem/stromal cell-derived factor-1 (SDF-1), which are believed to serve as principal
signalling molecules in EPC activation and mobilization, respectively159-165. VEGF and
SDF-1, along with other angiogenic factors such as insulin-like growth factor-2 (IGF-2),
enhance the expression and activity of matrix metalloproteinase (MMP)-9 in the BM,
which cleaves the membrane-bound Kit-ligand, known as stem cell factor (SCF) to
release its soluble form166-168. Soluble SCF interacts with its receptor, c-Kit, expressed
by various stromal cells to augment the BM microenvironment in favor of SC
proliferation and mobilization into circulation147, 166, 169. Several signalling pathways
have been implicated in directing the proliferation and migration of EPCs, including
Sonic hedgehog (Shh) acting through phosphoinositide-3-kinase (PI3K) and protein
kinase B (PKB)-mediated phosphorylation of NOS, as well as VEGF-induced signalling
via a protein kinase D-1 (PKD-1)-histone deacetylase (HDAC) 7 axis170-172. These
an SDF-1- and/or IGF2-mediated chemotactic gradient in order to home to sites in need
to neovascularization164, 168, 173-175.
In diabetes, the EPC-recruiting response to hyperglycemia-induced vascular
injury appears to be impaired. In cultured samples of peripheral blood obtained from
type 1 diabetics, the number of EPCs in circulation was reduced by 44% relative to
control subjects, suggesting that the disease impairs mobilization of precursor cells from
the BM62. The same study also found that the EPCs of diabetic patients exhibited a
significantly diminished capacity for angiogenesis in an in vitro assay62. Analysis of
CD34-positive EPCs derived from type 1 diabetics showed reduced in vitro
differentiation of the progenitors into mature ECs176. Similar results demonstrating
impaired differentiation, migration, and function have also been obtained through the
study of type 2 diabetic and mixed diabetic population EPCs, as well as animal
models57-59, 61, 118, 177-182. Additionally, our laboratory has shown that hyperglycemia
significantly increases caspase-3 activity in EPCs183. The number of EPCs in circulation
has been identified as an important biomarker for vascular function and overall
cardiovascular risk and thus, understanding the mechanisms underlying diabetic EPC
dysfunction is crucial117-120. Furthermore, the quantities of EPCs from subjects with
long-duration type 1 diabetes free from vascular complications were equivalent to
non-diabetic controls and demonstrated an enhanced migratory ability184. This finding
suggests that preservation of the EPC population and its function are critical in
preventing or ameliorating diabetic damage to the vasculature.
The underlying cause of the EPC dysfunction that occurs in diabetes is not
impairment of circulating EPC survival under hyperglycemic conditions and a reduction
in the hypoxia-induced expression of pro-angiogenic factors VEGF and SDF-1185-188. I
propose that a major contributor to this EPC dysfunction may be disrupted signalling
resulting from diabetes-induced alterations to the BM SC niche.
1.2.3 Stem Cell Niche
As with other SCs, the fates of VSCs in vivo are governed by intracellular gene
regulation, though this intrinsic program is subject to influence by external elements in
order to maintain an appropriate balance between self-renewal and differentiation189.
These extrinsic cues come from SCs’ interactions with the surrounding
microenvironment. This microenvironment is comprised of soluble paracrine signalling
molecules, interactions with nearby stromal cells, and the extracellular matrix, which are
collectively referred to as the SC niche189-191. The specific composition of these niches
are vital in regulating SC quiescence, self-renewal, and differentiation in nearly every
progenitor cell type166, 191, 192. The BM SC niche is comprised of a number of cell types,
as well as their secretory products, cell-cell interactions, and extracellular matrix (ECM)
(Figure 1.6). A number of SC niches have been identified and well-characterized,
including the epithelial, intestinal, and hematopoietic niches. Recent work has
broadened our understanding of the BM HSC niche, including changes to the niche in
disease states such as diabetes and obesity193, 194. Although EPC dysfunction is
associated with the development of pathological vascular complications, comparatively
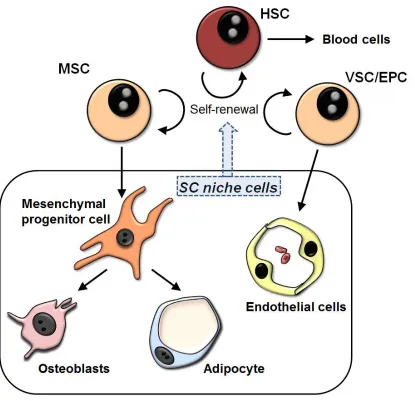
Figure 1.6. Schematic of interactions between BM SC niche components.
Within the BM reside three SC types: HSCs, MSCs, and VSCs. The self-renewal and
differentiation of these SCs is controlled by the surrounding microenvironment, which
includes MPCs, adipocytes, osteoblasts, and endothelial cells.
[EPC = endothelial progenitor cell; HSC = hematopoietic stem cell; MSC =
1.3 Bone and Marrow Complications of Diabetes
One of the extravascular complications of diabetes involves changes to the
composition and structural integrity of the skeletal system. This phenomenon was first
described by Morrison and Bogan in 1927, who observed impaired bone development
and skeletal atrophy in children with long-standing diabetes195. Clinically, it has been
well-documented that diabetes induces a significant increase in fracture risk among
both type 1 and type 2 diabetics, as described by a 2007 systematic review by
Janghorbani et al. and a 2007 meta-analysis by Vestergaard196, 197. These fractures are
particularly common in the radius, femur, and hip and may partially be the result of an
increased propensity for falls due to retinopathy and lower limb neuropathy198.
Interestingly, type 1 and type 2 diabetes have distinct effects on skeletal
composition. Type 1 diabetics suffer from a substantially increased risk of fragility
fractures – approximately 6-fold higher than the general population – and as to be
expected, display osteopenia and significant reductions in bone mineral density
(BMD)196, 197, 199-203. One study has reported the prevalence of osteoporosis (defined as
BMD at least 2.5 standard deviations below the mean BMD of an average 30-year old
white woman) as 19.1% among type 1 diabetics (with mean age of 30 years), with
osteopenia (defined as BMD 1-2.5 standard deviations below the same standard) being
found in 34-67% of patients201, 204-206. Low BMD has also been found to correlate with
an increased severity and incidence of chronic vascular complications, underscoring the
typically presents during childhood or adolescence, low bone mass may be the result of
impaired bone formation during critical skeletal growth periods195, 207.
Type 2 diabetes however, despite being characterized by normal or heightened
BMD (up to 8% higher than non-diabetic subjects after controlling for confounding
factors), is also associated with an increase in fracture risk due to inferior bone
quality196, 197, 199, 208-210. The impaired bone quality is associated with altered collagen
crosslinking, build-up of AGEs, and reduced bone turnover211. Interestingly, the risk of
fracture in type 2 diabetes appears to have a biphasic distribution, with a reduced
fracture risk in newly diagnosed diabetics and significantly greater risk with increasing
duration of the disease212.
1.3.1 Mechanisms of Skeletal Involvement in Diabetes
The involvement of the skeleton in diabetes may arise as the combined
consequence of several mechanisms, including altered regulation of vitamin D, reduced
calcium absorption in the intestine, and accumulation of AGEs within the bone. The
changes in blood chemistry associated with diabetes have also been shown to alter the
development of marrow MPCs, preventing their proliferation and skewing lineage
potential in favor of adipogenic development over osteoblastogenesis183, 213, 214. The
distinct effects of type 1 and 2 diabetes on bone composition may be explained by a
disrupted balance between BM-MPC self-renewal and differentiation, with promotion of
adipogenesis over osteoblastogenesis in type 1 diabetes and at the expense of
self-renewal in type 2 diabetes. Both diseases result in an altered cellular composition of
EPC dysfunction. There appear to be several mechanisms underlying the shift in MPC
developmental potential in diabetes, including hyperinsulinemia, hyperlipidemia,
hyperglycemia, and the use of certain diabetic medications.
1.3.1.1
Hyperinsulinemia
Insulin is responsible for the regulation of a number of different processes in
adipocytes: the accumulation of triglycerides, increasing glucose transport, enhancing
the rate of lipogenesis, inhibiting lipolysis, and promoting adipogenic differentiation215.
In vitro, insulin signalling is requisite to induce adipogenesis in cell culture systems and
in vivo IR-knockout models are subject to compromised adipogenic differentiation216-220.
Hyperinsulinemia is often present in the initial stages of type 2 diabetes as pancreatic
β-cell insulin production surges in an attempt to combat increasing peripheral insulin
resistance221, 222. Insulin binding activates IR or IGF-1 receptor (IGF1R), which leads to
the tyrosine phosphorylation of the insulin receptor substrate (IRS) and stimulation of a
tyrosine signalling pathway involving PI3K and PKB (Figure 1.7)215. The specific effects
of insulin on adipocytes occur via two mechanisms. Firstly, PKB activates mammalian
target of rapamycin (mTOR), which in turn stimulates sterol regulatory element-binding
protein 1c (SREBP1c; also known as adipocyte determination and
differentiation-dependent factor 1 or ADD1) to regulate the transcription of adipogenic genes, such as
fatty acid synthase (FAS) and lipoprotein lipase (LPL)223-226. PKB also phosphorylates
forkhead box protein O1 (FOXO1), precluding its entry into the nucleus where it serves
as a transcriptional repressor of PPARγ227, 228
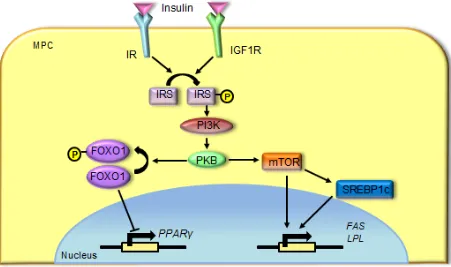
Figure 1.7. Hyperinsulinemia promotes adipogenesis in MPCs.
Binding of insulin to IR or IGF1R stimulates the phosphorylation of IRS, leading to the
activation of a PI3K/PKB signalling pathway. This pathway induces the transcription of PPARγ and adipocyte-specific genes, such as FAS and LPL.
[FAS = fatty acid synthase; FOXO1 = forkhead box protein O1; IGF1R = insulin-like
growth factor-1 receptor; IR = insulin receptor; IRS = insulin receptor substrate; LPL =
Insulin has also been suggested to have anabolic actions on bone229.
Osteoblasts possess high affinity receptors capable of binding insulin at physiological
concentrations, and insulin signalling has been shown to be critical for osteogenic
progenitor cell proliferation, bone mineralization, and bone turnover230-235. Insulin has
also been shown to positively influence the survival of osteoblasts in a dose-dependent
manner236. As hyperinsulinemia characterizes the early stages of type 2 diabetes, the
unique effects insulin exerts on osteoblasts may contribute to the increased BMD and
reduced fracture risk seen in newly-diagnosed diabetic subjects212, 237, 238. Following
β-cell failure (or in type 1 diabetics), patients devolve into a hypoinsulinemic state,
preventing the occurrence of these osteo-anabolic effects and potentially contributing to
the enhanced fracture risk in the type 2 diabetic population with increasing disease
duration239.
1.3.1.2
Hyperlipidemia
Hyperlipidemia is nearly a universal hallmark of type 2 diabetes and is also a
frequent comorbidity in type 1 diabetes, particularly when poorly controlled240-242.
Plasma levels of free fatty acids (FFAs) are elevated in many diabetics and have been
shown to contribute to the development of insulin resistance and cardiovascular
disease242-246. Significant elevations in the relative quantities of di- and tri-unsaturated
fatty acids relative to saturated fats have also been found in the plasma of non-obese
diabetic mice247. PPARγ is capable of serving as a physiological sensor of lipid levels,
with both mono- and poly-unsaturated fatty acids binding to and activating the
acids on undifferentiated cells, treatment of osteoblasts with serum high in fatty acids
was found to induce their cross-differentiation into adipocytes, as characterized by Oil
Red O staining and up-regulation of FABP4250. Diabetes has also been associated with
increases in the endogenous production of prostaglandins251-253. Prostaglandins have
similarly been shown to bind PPARγ to promote adipogenic differentiation, while also
inhibiting osteoblastogenesis of MPCs254-256.
1.3.1.3
Hyperglycemia
1.3.1.3.1
PI3K-PKB Pathway
High levels of blood glucose have been demonstrated to increase adipocyte
formation, lipid accumulation, and the expression of PPARγ in mouse BM-derived
MSCs257. It has been suspected that hyperglycemia partially mediates its effects
through changes to post-receptor insulin signalling, which may be implicated in the
development of insulin resistance257, 258. High levels of glucose increases the activity of
PI3K and the subsequent phosphorylation of PKB, both of which are involved in the
insulin signalling cascade257, 258. PKB-facilitated de-repression of the pparγ gene
though FOXO1 nuclear export leads to the induction of PPARγ and C/EBPα expression,
along with increased adiposity of the bone marrow257, 259-261.
1.3.1.3.2
Reactive Oxygen Species
As described earlier, diabetes is characterized by overproduction of ROS.
Excessive movement of electrons through the TCA cycle eventually overwhelms the
oxygen. Superoxide is then able to inhibit the action of glycolytic enzyme
glyceraldehyde-3 phosphate (GAPDH), which leads to the stimulation of the AGE
pathway that has been shown to be increasingly activated in diabetes22, 262, 263. AGEs
are proteins or lipids that become glycosylated following exposure to sugars and
accelerate cellular oxidative damage and have been implicated in both micro- and
macro-vascular diabetic complications264-267. Binding of AGEs and their receptors,
known as RAGE, have been associated with reduced bone formation by osteoblasts
and diminished matrix mineralization, in addition to impaired osteoblastogenesis268, 269.
AGE-RAGE interactions have also been identified as promoters of the MPC and
osteoblast apoptosis, contributing to the depletion of the BM SC niche270, 271.
Additionally, AGEs in collagen lead to heightened cross-linking and increased stiffness
of the collagen network, possibly resulting in bone fragility263, 272.
Oxidative stress induced by hyperglycemia has also been found to activate the
PI3K/PKB pathway, which acts to inhibit osteoblastic maturation and stimulate
adipogenesis273. Osteoblasts exposed to ROS resultant from high glucose demonstrate
decreased expression of Runx2 and osteocalcin, with a concomitant increase in the
abundance of the adipogenesis-related factors PPARγ, adipsin, and aP2273
. ROS is
also able to prevent matrix mineralization and enhance the accumulation of lipid
droplets in osteoblasts273.
1.3.1.3.3
Non-Canonical Wnt-PKC Pathway
While most of the wingless-type MMTV integration site family member (Wnt)
shown that Wnt11 may be induced by hyperglycemia to enhance the adipocytic
differentiation of marrow cells274. While the mechanism remains to be fully elucidated,
our current working model is that, through a non-canonical pathway, hyperglycemia
induces a switch in Wnt11 signalling that differentially activates the various isoforms of
PKC, specifically inducing the phosphorylation and consequent activation of PKCγ or
-ε274, 275. PKC-ε is trans-located from the cytoplasm to the nucleus where it is expressed
in spatiotemporal symmetry with C/EBPβ, suggesting a potential interaction274, 276
.
Through a currently unknown process likely involving the phosphorylation and
regulation of key nuclear adipogenic factors, PKC-ε activation results in the acceleration
of adipocytic differentiation276.
1.3.1.3.4
Hyperglycemia on Osteoblasts
Understanding the effects of excessive glucose on pre-osteoblasts has been
complicated by the inconsistent definitions of hyperglycemia used by researchers,
although this also allows for the characterization of a dose-response effect to increasing
glucose concentrations. Moderate elevations in glucose level (15 mmol/L) have been
shown to promote the proliferation and differentiation of pre-osteoblasts via activation of
the PI3K/PKB signalling pathway, while also significantly reducing calcium uptake and
deposition277, 278. As glucose concentration increased to 20-35.5 mM, differentiation of
pre-osteoblasts and the expression of osteogenic genes progressively decreased278, 279.
Escalating glucose levels have also been associated with significant increases in ROS,
as well as apoptosis in mature osteoblasts280. Hyperglycemia has been shown to
up-regulation of adipogenic genes PPARγ, adipsin, and adipocyte protein 2 (aP2), as well
as lipid accumulation, suggesting the potential for cross-differentiation281, 282.
Diabetes is characterized by the accelerated formation of AGEs due to the
greater availability of glucose283. AGEs are capable of inhibiting the osteoblastic
differentiation of precursor cell lines via repression of Sp7 independently of
hyperglycemia284. Additionally, long-term interactions between AGEs and its receptor,
RAGE, stimulates the apoptosis of osteoblastic cells both in vitro and in vivo, particularly
in more mature cell types270. In addition, the formation of AGEs has been shown to
increase collagen network stiffness, leading to a reduction in its ductility and contributing
to the increased susceptibility to fractures in diabetics211, 285.
1.3.1.4
Effects of Diabetic Medications
1.3.1.4.1
Thiazolidinediones
Thiazolidinediones (TZDs or glitazones) are a class of oral anti-diabetic
medications once commonly prescribed to improve insulin responsiveness that have
since fallen from favour over concerns regarding their cardiovascular and hepatic
safety286, 287. TZDs exert their beneficial effect on insulin resistance through high affinity
binding to and activation of PPARγ288
. Within adipose deposits, this interaction skews
the differentiation potential of resident progenitor cells towards the fat cell lineage,
leading to weight gain289. In the BM, TZDs skew the development of MPCs by driving
adipogenesis directly through the induction of PPARγ, while simultaneously suppressing
results in up-regulation of fat cell-specific factors, such as adipsin and FABP4293.
BM-MPCs treated with rosiglitazone demonstrate suppression of early markers of
osteoblastic differentiation, such as Runx2, as well as biochemical indicators of bone
formation, such as osteocalcin, alkaline phosphatase, and collagen 1293-295. Others
have attributed the loss of bone density to TZD-induced apoptosis of osteoblasts and
mature osteocytes in concomitance with inhibition of bone formation296-298.
TZDs have been variously reported as having both positive and negative effects
on the differentiation and function of osteoclasts. TZDs have been shown to be potent
inhibitors of osteoclast formation and minimizers of bone resorption299, 300. Alternatively,
osteoclast-specific deletion of PPARγ has also been found to result in osteopetrosis and
increased bone mass, while TZD-mediated stimulation of PPARγ can increase
osteoclastic differentiation and lead to excessive bone resorption301, 302. This effect
appears to be the result of a PPARγ-stimulated increase in the transcription of c-Fos,
which plays a critical role in the differentiation of osteoclasts301, 303. Additionally,
rosiglitazone has been shown to increase the abundance of C-terminal telopeptide in
some diabetic populations, which serves as a biomarker of osteoclast function, though it
has also been reported to inhibit osteoclastogenesis and bone resorption295.
1.3.1.4.2
Insulin Analogues
As insulin is a well-known inducer of adipogenesis, it is of little surprise that
starting diabetic patients on exogenous insulin therapy is often associated with a
significant increase in adiposity. Type 2 diabetic subjects treated solely with Neutral
kg over 12 months of therapy304. This weight gain appears to be a consequence of
increased lipid accumulation from fully developed fat cells and promotion of the
adipogenic differentiation of progenitor cells305. Interestingly, not all insulin analogues
have an identical effect on progenitor cells, with lower mRNA expression of adipogenic
markers PPARγ and leptin among preadipocytes treated with insulin detemir305-307
.
Insulin detemir has been shown to have a minimal effect on MPC differentiation or
weight gain relative to other insulin formulations305, 308-310. This may be a function of the
medication’s reduced affinity for the insulin receptor, though treatment of preadipocytes
with both equimolar and equipotent concentrations of insulin detemir resulted in
significantly less differentiation than did treatment with human insulin305, 306, 311.
Specifically in regards to bone, treatment of type 2 diabetics with insulin therapy has
been associated with an increased risk of fractures312, 313.
1.3.1.4.3
Metformin
Metformin is the often the first-line pharmacological therapy of choice in the
management of type 2 diabetes314. Metformin is an orally administered biguanide that
moderates plasma glucose levels by suppressing excessive hepatic
gluconeogenesis315. Unlike many other anti-diabetic medications, metformin is not
associated with increased enhanced adipogenesis or weight gain, and in many cases,
actually leads to a reduction in weight316, 317. A retrospective chart review of type 2
diabetics treated with metformin alone identified a significant increase in BMD, while
joint therapy with metformin and insulin failed to produce this increase318. Other studies
metformin319, 320. In vivo animal models have shown increased BMD and bone
formation when treated with metformin, while the administration of metformin to in vitro
culture systems appears to promote osteoblastic differentiation of MPCs and inhibit
adipogenesis321-326. Metformin increases the expression of several biochemical
markers of bone formation among osteoblasts, such as alkaline phosphatase, collagen
1, and BGLAP323. Metformin also enhances the production of osteoprotegerin, an
osteoclast-inhibitory factor, and decreases the expression of the osteoclast-stimulating
factor RANKL by osteoblastic cells to reduce bone turnover321.
Metformin has been shown to increase bone density by promoting the osteogenic
differentiation of MPCs both in vitro and in vivo, with up-regulation of osteoblastic
transcription factor Runx2 and no discernable effect on PPARγ, potentially leading to a
slight reduction in fracture risk319, 322-324. This enhanced osteogenesis appears to be the
result of increased activation of AMP-activated protein kinase (AMPK) leading to
up-regulation of eNOS and BMP2324, 327, 328. Metformin may also reduce levels of
sclerostin, an osteocyte-produced glycoprotein with anti-anabolic effects on bone
through Wnt and β-catenin signalling to enhance bone density318
1.4 Rationale
Previously, the primary role of adipocytes was believed to be energy storage,
though as of late, an important regulatory function for adipocytes has been realized.
Adipocytes are now recognized as acting systemically through the production of
hormones such as adiponectin, resistin, and leptin, as well as acting locally via the
actions of an assortment of cytokines. We believe that diabetes-induced shift in the
developmental potential of BM-MPCs leads to the formation of a unique cellular
composition within the BM, skewed in favor of adipocytes. Studies of numerous other
SC types have established the importance of the extracellular environment surrounding
SCs in guiding cellular differentiation. Many studies have investigated the role of the
BM hematopoietic SC niche on HSC development, including variations of the niche
within the context of disease states such as diabetes193, 329-331. Interestingly, relatively
little has been written about the interactions between the BM microenvironment and
resident VSCs and EPCs, even though the cell types are significant contributors to
vascular health. The interactions between VSCs/EPCs, BM stromal cells, and other BM
components that govern the differentiation and release of EPCs into circulation are
poorly understood46. Elucidating the mechanism by which diabetes leads to
impairments in EPC survival, migration, and proliferation may provide a novel
1.5 Hypothesis
I hypothesize that the diabetes-induced changes in the differentiation potential of
BM-MPCs alters the composition of the BM SC niche in a way which significantly
impairs resident VSC survival.
1.6 Specific Aims
In order to test out hypothesis, I established three primary objectives:
1. To construct an in vitro niche modelling system to assess the impact that
co-culture with MPCs, adipocytes, and osteoblasts have on the survival and
adherence of CD133-expressing VSCs
2. To identify genes that are differentially regulated by adipocytes and osteoblasts
relative to MPCs that may affect the properties of VSCs
3. To utilize a rat model of diabetes to correlate our in vitro gene expression data to