2078 | P a g e
Estimating the Drilling Induced Damage and Simulating
the Optimised Parameters through the Regression
integrated Simulated Annealing seed Tabu Search
Algorithm on Sandwich FRP Composites Machining
Dr.D.Ramalingam*
1, R.RinuKaarthikeyen
2, Dr.S.Muthu
3, Dr.V.Sankar
4*
1Associate Professor, Nehru Institute of Technology, Coimbatore, (India)
*corresponding author
2
Research Associate, Manager – Engineering, TCMPFL, Chennai,( India)
3
Principal, Adithya Institute of Technology, Coimbatore,(India)
4
Professor, Nehru Institute of Engineering and Technology, Coimbatore,(India)
ABSTRACT
The composite materials are attracting the high importance in the wide range of fields and are substituted to
many traditional engineering materials. Producing the parts with the FRP materials into this desired
dimensional accuracy is the prime challenge in the manufacturing operations. At the same time unlike the
metals FRP composites are facing the delamination problems as an added issue. A large dismissal rate is
recorder in manufacturing which in addition impacts on the long-term performance of the composite structures
with drilled holes owing to the drilling induced damage. Huge number of attempts has been adopted to bring
down such damage but still a common analytical model for estimating the drilling induced damage eludes the
composite’s alliance. The present study is an effort to employ the Simulated Annealing Algorithm and the
concept of Tabu Search Algorithm in the gradient based training of neural network in the MATLAB platform
programming to optimize and hence to develop a predictive model for estimating the drilling induced damage in
Sandwich FRP laminates. The values of the experimental observation while drilling the sandwich frp composite
laminates of different fibre volume ratios are the base for this investigation. Statistical projections is carried out
in MINITAB software and afterwards the regression equations are fed as input as a hybridization and the
simulation is performed. The results of the model are in good agreement with the training and the testing data.
Henceforth the developed projecting model is sestablishing the suitability within the range of levels for different
variables and for selection of optimal drilling parameters to achieve damage free drilling in composite
laminates.
Keywords
2079 | P a g e
I. INTRODUCTION
Composite materials are becoming increasingly important in a wide range of fields and are replacing many
traditional engineering materials. Composite materials such as fibre-reinforced plastics are broadly used in
aerospace, automotive and civil applications due to their exceptional mechanical properties. The quality of the
products being manufactured acting with the main accountability in the current scenario in terms functional
aspect as well as the life of the product with consistent performance. At time of manufacturing it is very
essential to control the quality parameters regarding all attributes of the product concern within the acceptable
range in order to fulfill the end usage. In this context, the quality of the hole produced during the drilling
operations is influenced by several factors which are impending into the process. The feed rate of the tool and
spindle speed are the prime factors in drilling operations which reflects on the end product quality in addition
with other properties of the materials being processed and the tool materials. Though it is burdensome to take
the complete factors under the control while processing, to the maximum extent possible attempts are being
taken by proper selection of machining parameters which trade in high influence on the end product quality.
Application of optimisation techniques is the commonly accepted and exercised approach in this context. With
this objective and clear understanding of the specific effects of machining parameters in various machining
operations, many researchers are using both the traditional and nontraditional optimization techniques to resolve
the issues.
II. RELATED LITERATURE
Much research effort has been done in examining drilling induced damages in polymer matrix composites.
Zhang et al. [1] have demonstrated on the assessment of the exit defects in CFRP plates caused by drilling and
concluded that delamination are the major mechanism in an exit defect caused by drilling. Chen [2] has revealed
on the variations of cutting forces with or without onset damage during the drilling operations and concluded
that the damage-free drilling processes may be obtained by the proper selections of tool geometry and drilling
parameters. Caprino and Tagliaferri [3] have conducted investigational experiments to compare the interaction
mechanisms between drilling tool and material. The results obtained are useful describing the damage and pave
path to design drill geometries specifically conceived for composite machining. They also confirmed that the
amount of damage induced in a composite material at time of machining is sturdily dependent on the feed factor.
V. Tagliaferri et al. [4, 5] accomplished through an experimental study on woven glass fiber reinforced plastic
(GFRP) composites that correlated the width of the damage zone to the ratio between the drilling speed and the
feed rate. C. C. Tsao et al [6] suggested further an analytical approach based on the linear elastic fracture
mechanics (LEFM) to predict the onset of delamination in drilling of composite laminates. G. Caprino et al. [7]
concluded that the type of damage induced in a composite material during drilling is strongly dependent on the
feed rate. J. Mathew et al. [8] have experimented on the crack propagation around the drilled holes and found it
to be more severe when the cutting lips pass through the bottom sub-laminates. Di Paolo et al. [9] have
addressed three significant damage mechanisms that cause the growth of delamination such as plate bulge, crack
opening and fiber tearing/twisting. R. Piquet et al [10] proved that it is the geometry of the drill point that
significantly influences the damage that takes place during drilling. E. Capello et al [11, 12] have executed
2080 | P a g e
that feed rate is the most critical parameter that influences the damage. In this attempt, the consequences of suchmain parameters machining speed, tool feed rate on the frp laminate material towards the hole diameter damage
factor (delamination) is analysed and optimization of input machining parameters is carried out. Simulated
Annealing and Tabu Search Algorithms (with the feed of Regression relationship) are employed in MATLAB
for the optimisation.
III.EXPERIMENT DATA
On the sandwich composite laminates which was made by hand layup method the drilling experiment was
conducted by Naveen et al [13] to evaluate the performance of the operations and outcome (delamination factor
of the hole produced). Investigations of the delamination effect on the produced hole was carried out through
conducting experiment on three different Four-layered unidirectional glass, hemp and sandwich fiber composite
laminates with three different fibre volume fraction. Machining speed and tool feed are considered as input
machining variables and (delamination) diameter damage factor as the outcome parameter for the investigation.
The dimension of the specimen were 100 mm x 50 mm x 3 mm with 10, 20, 30 % volume fractions. The
produced hole damages were observed using dye penetrate test to measure the diameter of the hole outcome.
The damaged factor of the hole diameter calculated with the relationship Dmax / D; where D max is the maximum hole diameter observed, D is the standard hole diameter. The parameter selection in three levels is
shown in the Table 3.1 and data obtained through the experiment is mentioned in the Table 3.2
Table 3.1 Machining input variables selection
Machining input parameters Level 1 Level 2 Level 3
Machining speed (m / min) 40 60 80
Feed (mm /min) 0.1 0.2 0.3
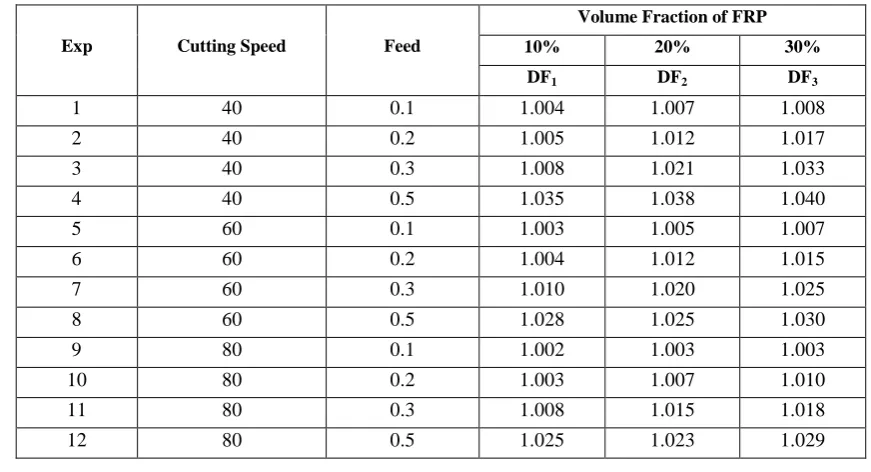
Table 3.2 Experimental result (Delamination factor)
Exp Cutting Speed Feed
Volume Fraction of FRP
10% 20% 30%
DF1 DF2 DF3
1 40 0.1 1.004 1.007 1.008
2 40 0.2 1.005 1.012 1.017
3 40 0.3 1.008 1.021 1.033
4 40 0.5 1.035 1.038 1.040
5 60 0.1 1.003 1.005 1.007
6 60 0.2 1.004 1.012 1.015
7 60 0.3 1.010 1.020 1.025
8 60 0.5 1.028 1.025 1.030
9 80 0.1 1.002 1.003 1.003
10 80 0.2 1.003 1.007 1.010
11 80 0.3 1.008 1.015 1.018
2081 | P a g e
Where Cs represents the cutting speed, F represents the feed and DF1, DF2, DF3 represents the drill hole damage factor of 10% , 20 % and 30 % fibre volume fraction specimen.VI. STATISTICAL PROJECTIONS
Since the mathematical relationship between the process parameters are projecting the real connectivity between
the input and output of any experimental work out, with the commercial Minitab 17 software the statistical
projection carried out and the statistical Fit regression model to the responses of the drill hole delamination
factor with the input machining parameters cutting speed, feed as continuous predictors of order 2 interactions
are taken. From the 95 % confidence level of two sided confidence level interval for the second order
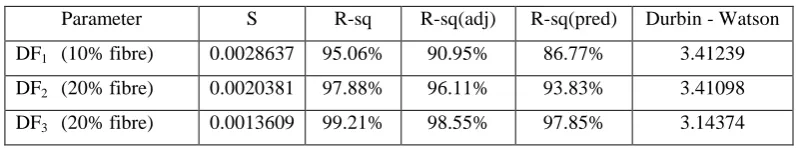
regression analysis of DF1, DF2, DF3 Vs Cs, F, and the model summary is noted in Table 4.1.
Table 4.1 Regression model: DF1, DF2, DF3 Vs Cs, F
Parameter S R-sq R-sq(adj) R-sq(pred) Durbin - Watson
DF1 (10% fibre) 0.0028637 95.06% 90.95% 86.77% 3.41239 DF2 (20% fibre) 0.0020381 97.88% 96.11% 93.83% 3.41098 DF3 (20% fibre) 0.0013609 99.21% 98.55% 97.85% 3.14374
The second order relations which are statistically significant since reveals that the R-sq value as along with the
R-Sq (adj) and R-Sq (pred) values as close. Regression Equations framed for all the three DF1, DF2, DF3 with the coefficient of variables as follows through the Minitab software. The equations reveal that the feed rate F is
highly influencing parameter on the Drill hole damage factors than the machining speed.
DF1 = (0.9977) – (0.000139*Speed) + (0.1107*Feed) + (0.000001*Speed^2) – (0.0530*Feed^2) – (0.000336*Speed*Feed)
DF2 = (1.0064) – (0.000224*Speed) + (0.0877*Feed) + (0.000001*Speed^2) – (0.0462*Feed^2) + (0.000086*Speed*Feed)
DF3 = (1.01472) – (0.000544*Speed) + (0.1249*Feed) + (0.000003*Speed^2) – (0.0803*Feed^2) – (0.000114*Speed*Feed)
V. OPTIMIZATION METHODOLOGIES
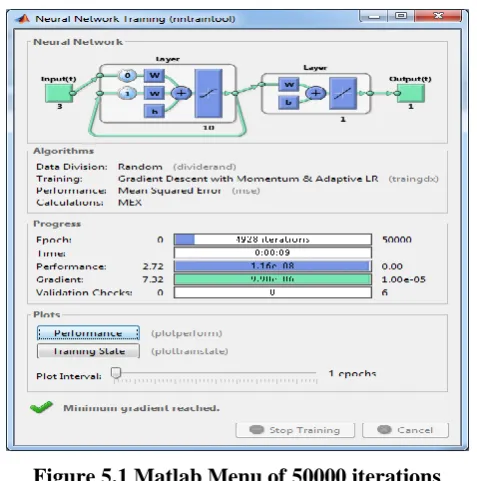
The MATLAB (R2014a) software with Elman Back Propagation is used for coding Simulated annealing
optimisation and Tabu Search algorithm. The algorithm is coded to the execution in the Gradient Descent with
Momentum & Adaptive Learning. The performance indicator is the mean square error. Based on the objectives,
the coding was developed towards optimization, i.e. delamination to the minimum value as the objective
functions. Initially the simulation is trained for 50000 iterations. Figure 5.1 shows the MATLAB menu of
2082 | P a g e
Figure 5.1 Matlab Menu of 50000 iterations
Mean squared error in computation is found as 0.001154407 for Simulated Annealing Algorithm and
0.000789091 for the Tabu Search Algorithm. In this simulation the regression relationship equations generated
by the Minitab is fed into the programme for the closeness in resulting the simulation instead of random
selection. While comparing the outcome of the both selected algorithms Tabu Search Algorithm projects better
responses than the Simulated Annealing Algorithm and henceforth the new approach with the seeding method is
employed, i.e the outcome of the Simulated Annealing Algorithm values is taken as the seed as the input to the
Tabu Search Algorithm and further simulation is carried out. The MSE value is found to be further reduced as
0.0001084567 which are shown in the Table 5.1. Further to that, the values for the periodical interval between
the parameter selection into 15 step up values chosen as (40:2.666667) for the speed parameter and
(0.1:0.026667:0.3) for the feed parameters. The computed values through this hybrid approach are given in the
Table 5.2 to Table 5.4.
Table 5.1 MSE error rate in simulation
Algorithm Error rate in simulation
Simulated Annealing Algorithm 0.001154407
Tabu Search Algorithm 0.000789091
Simulated Annealing seed Tabu 0.0001084567
Table 5.2 Computed values of DF1, DF2, DF3 Vs F for speed 40, and 45 and 50 m / min
Feed Speed 40 m / min Speed 45 m / min Speed 50 m / min
DF1 DF2 DF3 DF1 DF2 DF3 DF1 DF2 DF3
0.10 1.005 1.007 1.008 1.004 1.008 1.009 1.004 1.007 1.007
0.12 1.001 1.006 1.010 1.007 1.009 1.018 1.006 1.009 1.017
0.14 0.999 1.005 1.026 1.002 1.009 1.016 1.001 1.009 1.014
0.16 1.010 1.006 1.015 1.006 1.009 1.017 1.005 1.009 1.015
2083 | P a g e
0.20 1.012 1.011 1.024 1.012 1.012 1.020 1.011 1.011 1.0180.22 1.014 1.014 1.021 1.013 1.014 1.021 1.012 1.013 1.019
0.24 1.016 1.018 1.025 1.014 1.016 1.023 1.013 1.015 1.021
0.26 1.016 1.021 1.026 1.016 1.019 1.023 1.015 1.017 1.021
0.28 1.018 1.023 1.025 1.017 1.021 1.024 1.016 1.019 1.022
0.30 1.019 1.025 1.027 1.018 1.023 1.025 1.017 1.021 1.024
Table 5.3 Computed values of DF1, DF2, DF3 Vs F for speed 55, 60 and 65 m / min
Feed Speed 55 m / min Speed 60 m / min Speed 65 m / min
DF1 DF2 DF3 DF1 DF2 DF3 DF1 DF2 DF3
0.10 1.003 1.006 1.006 1.002 1.005 1.004 0.999 1.005 1.003
0.12 1.004 1.009 1.014 1.002 1.009 1.012 1.000 1.008 1.010
0.14 1.001 1.009 1.012 1.000 1.008 1.010 0.998 1.008 1.009
0.16 1.004 1.009 1.014 1.003 1.008 1.012 1.002 1.008 1.011
0.18 1.009 1.010 1.016 1.008 1.009 1.014 1.006 1.009 1.012
0.20 1.010 1.011 1.016 1.008 1.010 1.014 1.006 1.009 1.013
0.22 1.011 1.012 1.017 1.009 1.011 1.016 1.007 1.010 1.014
0.24 1.012 1.013 1.019 1.011 1.012 1.017 1.010 1.011 1.016
0.26 1.014 1.015 1.020 1.013 1.013 1.018 1.012 1.012 1.017
0.28 1.015 1.017 1.021 1.014 1.015 1.019 1.013 1.013 1.018
0.30 1.017 1.019 1.022 1.016 1.016 1.020 1.015 1.014 1.019
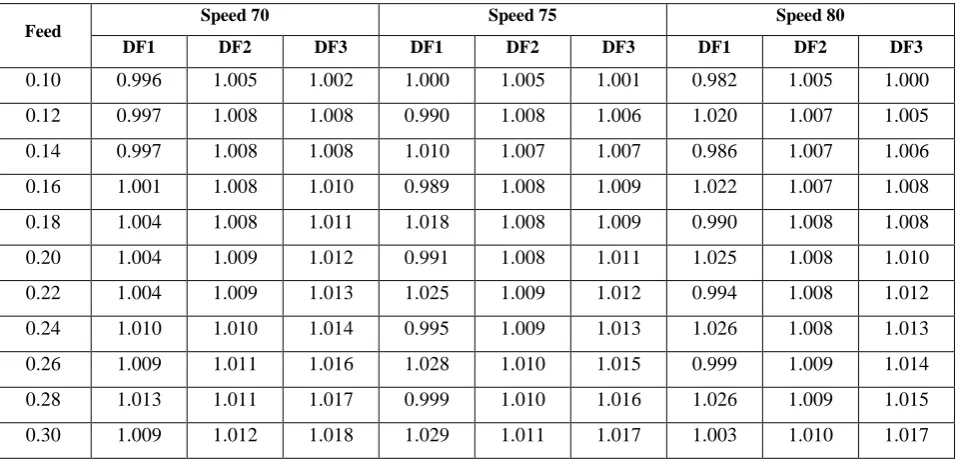
Table 5.4 Computed values of DF1, DF2, DF3 Vs F for speed 70, 75 and 80 m / min
Feed
Speed 70 Speed 75 Speed 80
DF1 DF2 DF3 DF1 DF2 DF3 DF1 DF2 DF3
0.10 0.996 1.005 1.002 1.000 1.005 1.001 0.982 1.005 1.000
0.12 0.997 1.008 1.008 0.990 1.008 1.006 1.020 1.007 1.005
0.14 0.997 1.008 1.008 1.010 1.007 1.007 0.986 1.007 1.006
0.16 1.001 1.008 1.010 0.989 1.008 1.009 1.022 1.007 1.008
0.18 1.004 1.008 1.011 1.018 1.008 1.009 0.990 1.008 1.008
0.20 1.004 1.009 1.012 0.991 1.008 1.011 1.025 1.008 1.010
0.22 1.004 1.009 1.013 1.025 1.009 1.012 0.994 1.008 1.012
0.24 1.010 1.010 1.014 0.995 1.009 1.013 1.026 1.008 1.013
0.26 1.009 1.011 1.016 1.028 1.010 1.015 0.999 1.009 1.014
0.28 1.013 1.011 1.017 0.999 1.010 1.016 1.026 1.009 1.015
2084 | P a g e
Table5.5 gives the time consumed for the simulation by the employed algorithms. The hybrid SimulatedAnnealing seed Tabu Search Algorithm takes higher time for converging than the algorithms individually
converges.
Table 5.5 Time pulses for simulation of algorithms
Algorithm Time for simulation
Simulated Annealing Algorithm 7.827
Tabu Search Algorithm 11.711
Simulated Annealing seed Tabu Search Algorithm 22.653
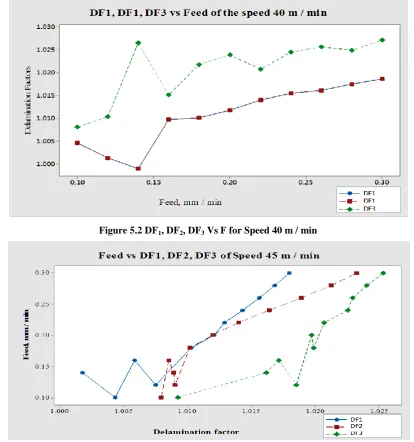
The graphical plots for all such combinations of speed, feed and depth of cut are depicted in the Figures 5.2 to
5.10.
Figure 5.2 DF1, DF2, DF3 Vs F for Speed 40 m / min
2085 | P a g e
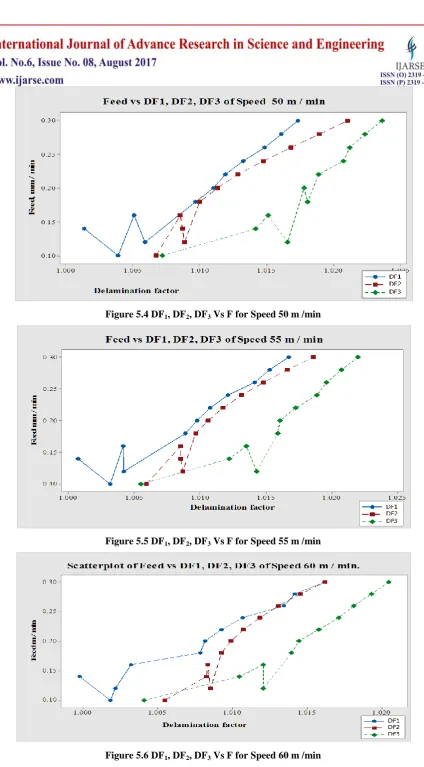
Figure 5.4 DF1, DF2, DF3 Vs F for Speed 50 m /min
Figure 5.5 DF1, DF2, DF3 Vs F for Speed 55 m /min
2086 | P a g e
Figure 5.7 DF1, DF2, DF3 Vs F for Speed 65 m /min
Figure 5.8 DF1, DF2, DF3 Vs F for Speed 70 m /min
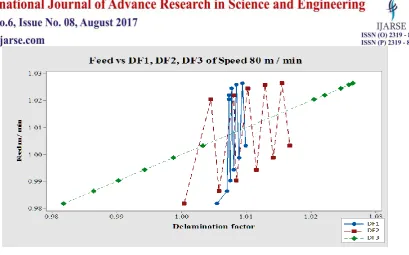
2087 | P a g e
Figure 5.10 DF1, DF2, DF3 Vs F for Speed 80 m /min
The optimal value of the hole diameter damage factor for each clause of fibre volume fraction is shown in the
Table 5. 5.
Table 5.5 Optimal value of the hole diameter damage factor
Fibre Volume fraction Speed Feed DF values
10 % 80 0.10 0.982
20 % 40 0.14 1.005
30 % 80 0.10 1.000
VI. RESULTS AND CONCLUSIONS
This attempt of optimizing the process parameters towards the minimum delamination (hole diameter damage
factor) in drilling operations on the sandwich frp composite laminates is simulated by applying Simulated
Annealing and Tabu Search Algorithm in the MATLAB programming. Based on the error rate in compiling the
results the Tabu Search Algorithm shows better results than the Simulated Annealing Algorithm and the new
method of Seeding technique is used and further enhanced results attained through Simulated Annealing Seed
Tabu Search Algorithm. From the regression analysis it is evident that the feed parameter of the tool is showing
high level influence on the hole diameter damage factor over the other parameter (speed). The optimum
parameter selection within the set of values employed for minimum hole damage factor for the individual fiber
volume fraction content of the frp is given through the Table 5.5 Graphical plots presented through the Minitab
for various combinations of input machining parameter values would be the guidelines to the manufacturer
concern in the selection of machining parameter combination with reference to the required product quality.
References
[1] H. Zhang, W. Chen.W, D. Chen and L. Zhang, Assessment of the exit defects in carbon fibre-reinforced plastic plates caused by drilling, Prec. Mach. Adv. Mater, 196, 2006, 43-52.
2088 | P a g e
[3] G. Caprino and V. Tagliaferri, Damage development in drilling glass fibre reinforced plastics, Int. J. Mach.Tools Manuf, 35 (6), 1995, 817-829.
[4] Caprino, G.; Diterlizzi, A.; Tagliaferri, V. (1988). Damage in Drilling Glass Fiber Reinforced Plastics. Advancing with composites, Proceedings of International Conference on Composite Materials, Milan,
Italy,493-503
[5] Tagliaferri, V.; Caprino, G.; Diterlizzi, A.(1990). Effect of Drilling Parameters on the Finish and Mechanical Properties of GFRP Composites, International Journal of Machine Tools and Manufacture,
Vol. 30 (1), 77-84
[6] Tsao, C.C.; Chen Wen-Chou.(1997). Prediction of the Location of Delamination in the Drilling of Composite Laminates, Journal of Materials Processing Technology, Vol. 70,185-189
[7] Caprino, G.; Tagliaferri, V. (1995). Damage Development in Drilling Glass Fiber Reinforced Plastics, International Journal of Machine Tools and Manufacture, Vol. 35(6),817-829
[8] Mathew, J.; Ramakrishnan, N.; Naik, N.K. (1999). Investigations into the Effect of Geometry of Trepanning Tool on Thrust and Torque during Drilling of GFRP Composites, Journal of Materials
Processing Technology Vol. 91, 1-11
[9] DiPaolo, G.; Kapoor, S.G.; DeVor, R.E. (1996). An Experimental Investigation of the Crack Growth Phenomenon for Drilling of Fiber Reinforced Composite Materials, Journal of Engineering for
Industry-Transactions of the ASME, Vol. 118, 104-110
[10] Piquet, R.; Ferret, B.; Lachaud, F.; Swider, P.(2003). Experimental Analysis of Drilling Damage in Thin Carbon/Epoxy Plate using Special Drills, Composites Part A,Vol.31,1107-1115
[11] Capello, E.; Tagliaferri, V. (2001) Drilling damage of GFRP and residual mechanical behavior – Part I: Drilling damage generation, Journal of Composites Technology Res , Vol. 23(2),122– 130
[12] Capello, E.; Tagliaferri, V. (2001) Drilling Damage of GFRP and Residual Mechanical Behavior – Part II: Static and Cyclic Bearing Loads, Journal of Composites Technology Res, Vol.23(2),131-137.
[13] Naveen, P.N.E, Yasaswi, M,& Prasad.R.V, 2012, Experimental Investigation of Drilling Parameters on Composite Materials, IOSR Journal of Mechanical and Civil Engineering (IOSRJMCE), vol. 2, issue 3, pp