FARMING RISKS AND SECURITY CHALLENGES IN VEGETABLE
PRODUCTION IN ORLU, IMO STATE
Osuji, E.E.
1+N.C. Ehirim.
2M.A.Y Rahji
3T.T. Awoyemi
4K.K. Salman
5M.A.C.A Odii
6S.C. Onyemuwa
7Ibeagwa, O.B.
8C. Chikezie
9M.O. Okwara
101Dept of Agricultural Economics, Michael Okpara, University of Agriculture Umudike, Abia State,Nigeria
2,6,7,8,9,10
Department of Agricultural Economics, Federal University of Technology Owerri, Imo State,Nigeria
3,4,5
Department of Agricultural Economics, University of Ibadan, Ibadan-Oyo State,Nigeria
(+ Corresponding author)
ABSTRACT
Article History
Received: 7 November 2016 Revised: 24 January 2017 Accepted: 8 February 2017 Published: 23 February 2017Keyword
s
Farming risk SecurityManagement strategies Vegetable crops Risk intensity Linear model
Farming risk is a security challenge that reduces the actual outcome from farmers
expected outcome. Predominant farming risk is the reason for deviations from planned
production in Imo State. Food supply gap becomes reduced if the farming risk associated
with vegetable production is reduced and the effect on output increased through this
study. A total of 152 farmers from 10 communities across three (3) local government
areas of Orlu agricultural zone were used for data analysis. Data were obtained using a
well-structured questionnaire and analyzed using descriptive statistics and econometric
tools. Majority (98.7%) and (94.7%) of farmers planted fluted pumpkin, bitter leave
respectively in a mixed cropping pattern to withstand risk and security challenges with
96.7% and 95.4% of them adopting correct planting distances and soil fertility
amendments as copping strategies. The perceived risk intensity equation showed the
linear model as the best fit with F-statistics of 15.182, greater than its tabulated value of
4.689 at p ‹ 0.05 critical value, hence the lead equation. The model has only 5 significant
explanatory variables at p ‹ 0.05 with a co-efficient of multiple determination of 0.697,
implying that 69.7% of the total variations in perceived farming risk intensity in
vegetable production in the area were due to the included explanatory variables. Farmers
perceived risk intensity increased significantly by 0.212%, 3.60% and 0.735% with a
unit increase in farmer’s age, access to credits and household size respectively but
decrease significantly by 5.87% and 2.6X10⁻⁶% with a unit decrease in risk mitigation
measures and income at p ‹ 0.05 critical levels. Intensifying risk mitigation measures and
encouraging younger vegetable farmers in vegetable production in the area can reduce
farming risk in the area.
Contribution/ Originality:
This study documents that perceived risk intensity of farmers engaged in vegetable
crop production can be reduced or eliminated through the adoption of adequate risk management strategies which
enhances the profitability and output of the farmers thereby engendering food security among household farmers in
the area.
Asian Development Policy Review
ISSN(e): 2313-8343 ISSN(p): 2518-2544
DOI: 10.18488/journal.107/2017.5.1/107.1.37.42 Vol. 5, No. 1, 37-42
1. INTRODUCTION
Vegetable production is a risky farming enterprise either because of its rapid perishable nature, short supply
period or its inelastic demand nature
(Hardwood
et al.
, 1999)
hence planned outcome continually deviates from the
actual outcome. According to
Reddy
et al.
(2004)
farming risk refers to perfect knowledge of the probability of a
possible outcome of an event, while uncertainty exists when the probability of such event is not known. It produces
an adverse variation in an expected outcome
(Binswanger, 1982)
.
Ehirim
et al.
(2006)
noted that the risk factors are
so adverse on farmers’ livelihood and food security status as the actual output or returns of the farmer is forced to
drop below an expected or desired level for food security. Chances of farming risk pose security challenges with
much pressure on contingency plans and cost of production, decline in farm outputs and farm inefficiency. Other
areas where risks are eminent is in processing, distribution and marketing of farm products.
Moscardi and Janury (1977)
observed evidence of high risk aversion among food crop farmers. Security position
of farm enterprise is always threatend when the risk factors is seriously challenging the viability of farmers’enterprise
such that production is unsustainable
(Ehirim
et al.
, 2006)
. Overcoming security challenges of the farm due to certain
risk is guided by past experiences or knowledge of such risk occurence by the farmer just as prediction about the risk
occurence in the farm is usually very difficult and cost ineffective. Vegetable production in Nigeria, though practiced
as backyard farming by some farmers, is faced with a fairly large capital and a considerable investment on lands, soil
ammendments and watering equipment. Often times, farmers are confronted with risk despite their short and long
term production and marketing decisions
(Hardaker
et al.
, 1997)
. Vegetable productions are risk-prone with high
degree of uncertainty especially in pest and diseases attack with total crop failures
(Ronmasset, 1976)
. This explains
why the cost of vegetable production poses a challenge to expected profits
(Wik and Holden, 1996; Kimura
et al.
,
2010)
.
Farm enterprises usually adopt a number of strategies to avoid risk or rather to reduce its adverse effect upon
occurence.
Hardwood
et al.
(1999)
noted risk management as choosing among alternatives that which reduces the
effects of risk. Risk management is a process of measuring or assessing risk and then developing strategies to manage
the risk. However, in ideal risk management priority, the processes that follow each other whereby the risk with the
greatest loss and its probability of occurring are handled first while risks with lower probability of occurrence are
handled later. This is an element of farm business management that deals with making decision that aimed at
eliminating or avoiding the incidence of risk or rather minimizing its adverse effects. Hence vegetable crop farmers
should assess management strategies that aim at minimizing adverse risk effects such as; choosing a reliable
enterprise, enterprise diversification, intercropping, irrigation, flood control, sales of assets, etc
(Hazell and Valdes,
1985)
.
Alderman and Paxson (1994)
further opined that risk management strategies in vegetable crop production
aims at identification, assessment, and prioritization of risk followed by coordination, economical application of
resources to minimize, monitor, and control the probability and/ or impact of unfortunate events or to maximize the
realization of opportunities.
2. MATERIALS AND METHOD
This study was carried out in Orlu Agricultural zone of Imo State, Nigeria. The zone has 11 local government
areas, namely; Egbema-Oguta, Oru East, Orlu, Orsu, Isu, Ideato North, Ideato South, Nkwere, Nwangele, Oru West,
and Njaba. A multi-stage random sampling technique was employed for this research. The first stage involved a
purposive selection of 3 (three) local government areas from the 11, local governmnent areas which include Ideato
South, Isu and Egbema-Oguta local government areas from the Orlu north, central and south respectively. This
selection was because of the dominant farming activities and vegetable production in those areas selected. The second
stage involved a random selection of 3communities from each of the 3 selected local government areas. This gave a
total of 9 communities for the study. Finally, from a list of vegetable crop farmers with agricultural department of
selected local government headquaters, 20% of vegetable farmers were randomly selected from each communities.
This gave a total 87 farmers in Ideato north, 62 farmers in Isu and 51 farmers in Egbema-Oguta local goverment
areas. A total of 200 farmers were selected for the study. A well structured questionaire was used to elicit information
on some perceived risk occurences, quantity of inputs used and their levels of output, risk mitigation measures and
socio-economic features of the farmers. Only 152 responses were found useful for data analysis.
Data were analyzed using both descriptive statistics and econometric tools. The level of production of vegetable
crop farmers and their risk management strategies were analyzed using descriptive statistics such as frequency and
relative frequency. While determinant of perceived risk intensity of vegetable crop farmers were isolated using the
ordinary least squares multiple regression model. The perceived risk intensity and their determinants were fitted into
four functional forms. These models were explicitly specified as follows;
Linear function;
Y = f (b
0+ b
1x
1+ b
2x
2+ b
3x
3+ b
4+ x
4+ b
5x
5+ b
6x
6+ b
7x
7+ U) ---eqn.(1)
Double – log function;
LnY = f (b
0+ b
1lnx
1+ b
2lnx
2+ b
3lnx
3+ b
4lnx
4+ b
5lnx
5+ b
6lnx
6+ b
7lnx
7+ U)--- eqn.(2)
Semi – log function;
Y = f (b
0+ b
1lnx
1+ b
2lnx
2+ b
3lnx
3+ b
4lnx
4+ b
5lnx
5+ b
6lnx
6+ b
7lnx
7+ U)--- eqn.(3)
Exponential function;
LnY= f (b
0+ b
1lnx
1+ b
2lnx
2+ b
3lnx
3+ b
4lnx
4+ b
5lnx
5+ b
6lnx
6+ b
7lnx
7+ U)--- eqn.(4)
Where Y = Percieved risk intensity index
x
1= age of the farmers in years
x
2= gender (Femal is “1” and “0” otherwise)
x
3= Level of formal education attainment (number of years spent in formal education)
x
4= farming experience in years
x
5= household size from nominal value of member of the household
x
6= access to credit (dummy variable 1 – access and 0’ otherwise)
x
7= farming as a major occupation (dummy variable 1 for faming and 0’ otherwise)
b
1– b
7are the co-efficient parameters to be estimated
e = stochastic error variable
A priori expectations showed that X
1, X
2, X
3, X
4, X
5, X
6, X
7, > 0;
3. RESULTS AND DISCUSSION
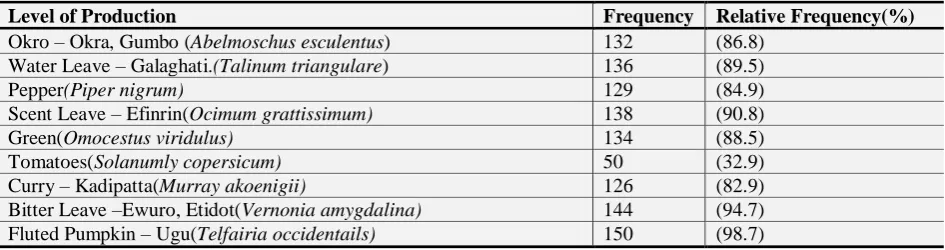
3.1. Production of Vegetable Crop by Farmers in Imo State
farmers planted Pepper(
Piper nigrum
), also (82.9%) of them planted Curry
(Murray akoenigii
), and lastly, (32.9%) of
the vegetable crop farmers planted Tomatoes
(Solanumly copersicum
). This implies that Tomatoes’ has the lowest
production and the rate of Tomatoes production is very low in the study area.
Table-1. Distribution of Farmers based on Vegetable Crop Produced in the Area
Level of Production
Frequency
Relative Frequency(%)
Okro – Okra, Gumbo (
Abelmoschus esculentus
)
132
(86.8)
Water Leave – Galaghati.
(Talinum triangulare
)
136
(89.5)
Pepper
(Piper nigrum)
129
(84.9)
Scent Leave – Efinrin(
Ocimum grattissimum)
138
(90.8)
Green(
Omocestus viridulus)
134
(88.5)
Tomatoes(
Solanumly copersicum)
50
(32.9)
Curry – Kadipatta(
Murray akoenigii)
126
(82.9)
Bitter Leave –Ewuro, Etidot(
Vernonia amygdalina)
144
(94.7)
Fluted Pumpkin – Ugu(
Telfairia occidentails)
150
(98.7)
Source: field survey data, 2013.
3.2. Risk Management Strategies of the Vegetable Crop Farmers in the Area
The result in Table 2; showed that majority (96.7%) of the farmers adopted adequate plant distance or spacing in
the planting of vegetable while (95.4%) adopted the use of fetlizers as risk management strategy. The use of adequate
planting distance and application of fertilizer was commonly used of all strategies. According to
Allemann and
Young (2008)
fertilizer is recommended in situations where vegetable crops are grown without the soil being
analyzed. Thus, on very poor soils, vegetable crops would be improved by even higher fertilizer application rates.
Application of lime during raining season was the least (12.5%) of all the risk management strategy used by the
farmers. According to
Allemann and Young (2008)
liming should be considered in areas where there is high rainfall
as such soils tend to be inherently infertile and more acidic. The use of lime becomes very important in this case. The
study therefore, suggest that farmers should be encouraged to apply lime in a correct proportion to ensure that the soil
is not exposed to risk. Insurance policy is also a low (17.1%) strategy used by these farmers as a cover to the losses
made in vegetable production. The low frequency of insurance policy could be the reason why most farmers finds it
difficult to set up another farm as soon as there is emergency due to crop failure or adverse weather condition in the
area.
Table-2. Risk Management Strategies of the Vegetable Crop Farmers.
Source: Field survey data, 2013.
3.3. Determinant of Risk Intensity of Vegetable Crop Production in Imo State
Table 3; showed that the linear functional form was chosen as the lead equation based on econometric and
statistical criterion. The coefficienct of multiple determination (R
2) shows that 69.7% of the variation in risk
Risk Management Strategies Frequency Relative Frequency (%)Correct spacing/ planting distance. 147 (96.7)
Mixed cropping/ Inter cropping. 99 (65.1)
Construction of Drainages cut off ditches/ trench. 120 (42.8)
Avoidance of bush burning. 132 (86.8)
Application of Manure (organic and inorganic). 145 (95.4)
Security against theft and poaching. 102 (65.4)
Application of lime during Raining season. 19 (12.5)
Taking insurance policy against crop failure or damages. 26 (17.1)
Construction of bars across furrows or contour ridges on slope. 144 (94.7)
Complete clearance of borrowed debt before payback period. 91 (59.9)
Early planting/ harvesting. 98 (59.9)
management strategy is been determined by the included independent variables. The F-statistics at p ‹ 0.01 critical
level is 15.182. This value is greater than the tabulated value of 4.689
at p ‹ 0.05
critical level. It implies that the null
hypothesis is rejected in the study. Therefore there is no significant relationship between the socio–economic
characteristics of the vegetable crop farmers and percieved farming risk associated with vegetable crop production in
the State.
It could be seen from the table that age and access to credit have a positive and significant relationship with
percieved risk at p ‹ 0.01 critical level.This indicates that as the farmers get older and as the volume of credit used
increase, the level of percieved risk rises. Net income from vegetable production have negative values but siginificant
at p ‹ 0.05 critical level. This implies that a unit increase in this variable will reduce percieved risk associated wih
vegetable production in the area. Household size has a positive relationship with risk management strategy and is
statistically significant at 5% level indicating that as the number of people in the household increase, the ability of the
farmer to manage risk increases. This variable is highly important to risk management strategy. Other variables like
education, farm experience and risk diversion rate have a negative relationship with risk management strategy but
was not significant even at p ‹ 0.1 critical level. Although these variables were not significant in the study, it shows
that a unit increase in any of them will reduce percieved risk. Education and farming experience can increase farming
skills among which are risk management stategies of the farmers.
Gender has a positive relationship with risk management strategy but was not statistically significant at 1%, 5%
or 10% level indicating that the involvement of women in vegetable production increases the risk management ability
of vegetable production in the area. This is true as vegetable production is women’s crop. Although this variable was
not influential in the study. Farming as a major occupation has a negative relationship with risk management strategy
and significant at 10% level. This indicates that the more the farmers choose vegetable production as a major
occupation, the lesser the ability of the family to manage risk. This may be as a result of the inability of the farmer to
learn management skills than venturing into other businesses.
Table-3. Determinants of Risk Intensity in Vegetable Crop Farmers in Orlu Agricultural Zone Imo State Factors Linear Exponential Cob-Daugls Semi-log
Co-efficient Co-eefficient Co-efficient Co-efficient
Constant 60.095***
(9.666) 4.159*** (28.681) 4.906*** (17.433) 92.381*** (7.649)
Age 0.212***
(-3.173) 0.005*** (-3.069) 0.216*** (-2.991) 9.605*** (-3.099)
Gender 1.464
(1.011) 0.033 (0.967) 0.024 (0.721) 1.141 (0.785)
Education -0.017
(-0.078) -0.0003 (-0.056) 0.015 (0.321) 0.606 (0.299)
Farming experience -0.48
(-0.947) -0.003 (-1.029) -0.042 (-0.909) -1.576 (-0.789)
Household size 0.735**
(2.384) 0.017** (2.329) 0.060 (1.745) 2.669 (1.800)
Credit 3.599***
(-2.668) 0.091 (-2.882) 0.103*** (-3.248) 4.116*** (-3.015)
Farming as major
occupation -3.577 (-1.754) 0.086* (1.812) 0.069 (1.562) 2.891 (1.504)
Risk mitigation rate -5.872***
(-3.872) -0.151 (-1.959) -0.149 (-1.358) -5.829 (-1.740)
Net income -2.6E-06**
(-2.107) -6.8E-8** (-2.326) -0.024** (-2.509) -0.943** (-2.318)
R2 0.697 0.678 0.259 0.246
Adj. R2 0.584 0.460 0.212 0.198
F-statistics 15.182*** 5.550*** 5.515*** 5.153***
No of observation 152 152 152 152
(**) significant @ 5%;(***) significant @ 1.0% and t-value are in paranthesis
4. CONCLUSION AND RECOMMENDATIONS
The study concluded that vegetable farmers adopted modern, old and traditional method of risk management like
construction of drainages, fertilizer application, complete clearance of borrowed debts before payback period, correct
spacing, mixed cropping, etc. Hence four variables identified as determinants of risk intensity were age, credit,
gender, and household size. However, It was discovered that the low frequency of insurance policy could be the
reason why most most farmers finds it difficult to set up another farm as soon as there is emergency due to crop
failure or adverse weather condition in the area. The study recommends a functional insurance agencies to take up
farmers risk to enable them stay in food and vegetable production in the area. Also Increase in net income reduces
percieved risk; hence measures to increase farmers profit such as input subsidy and efficienct input management
should be encouraged to ensure a reduced risk in vegetable farming in the State.
Funding: This study received no specific financial support.
Competing Interests: The authors declare that they have no competing interests.
Contributors/Acknowledgement: All authors contributed equally to the conception and design of the study.
REFERENCES
Alderman, H. and C. Paxson, 1994. Risks management intensity of farmers. A Paper Presented at International Economics
Association Conference Moscow. pp: 23-29.
Allemann, L. and B.W. Young, 2008. Risks control measures among crop farmers in Pretoria. Journal of Agricultural Systems,
4(1): 31–57.
Binswanger, H.P., 1982. Empirical estimation and use of risk preferences: Discussion. American Journal of Agricultural
Economics, 64(2): 391-393.View at Google Scholar | View at Publisher
Boehije, M. and D. Lins, 2010. Risk management in an industrialized agriculture. Journal of Economic Review, 2(1): 12-17.
Ehirim, N.C., S.N. Odurukwe, J. Ajaero and C.A. Emenyonu, 2006. Socio-economic analysis of farming risk in cassava based
enterprise in Imo State. International Journal of Natural and Applied Science, 2(2): 89-95.
Hardaker, J.B., R. Huirne, J.R. Anderson and G. Lien, 1997. Coping with risk in agriculture. Thailand: CABI Publishing. pp: 1
4-23.
Hardwood, J., R. Heifner, K. Coble, J. Perry and A. Somwaru, 1999. Managing risk in farming: Concepts and analysis.
Agricultural Economics Report No. 774. Economics Research Service. USDA, 3(2): 31-34.
Hazell, P. and A. Valdes, 1985. Crop insurance for agricultural development: Issues and experience agricultural Insurance.
Baltimore: IFPRI/John Hopkins University Press, 2: 3-5.
Kimura, S., J. Anton and R. Martini, 2010. Risk management in agriculture in Canada. OECD Food, Agriculture and Fisheries
Paper, No. 40 OECD: 24.
Miller, A., M. Mayhew and A. Susan, 2004. Dictionary of geography and business article. London: Oxford University Press. pp:
12-14.
Moscardi and Janury, 1977. Evidence of food crop farmers’ risk aversion strategies? Journal of Agricultural Science, 2(4): 23-27.
Reddy, S., P. Raghu-Ram, T.V. NeelakantaSastry and I. Bhavani-Devi, 2004. Concepts of Agricultural economics. Chicago:
Oxford University Press. pp: 23-26.
Ronmasset, K., 1976. Risk is business decision. London: Longman Press. pp: 19-21.
Wik, M. and S. Holden, 1996. Experiment studies of peasants. Attitude towards risk in Northern Zambia; Discussion Paper No.
10-14. Department of Economics and Social Science. Norway: Agricultural University of Norway.