IJEDR1504115
International Journal of Engineering Development and Research (www.ijedr.org)674
Decoding Black Swan
A Quantitative Approach to Tactical Stock Investing
1Dr. Jay Desai, 2Nisarg A Joshi 1Assistant Professor, 2Assistant Professor
1Shri Chimanbhai Patel Institute of Management & Research, Ahmedabad, India 2Shri Chimanbhai Patel Institute of Management & Research, Ahmedabad, India
________________________________________________________________________________________________________ Abstract - In this paper we examine unanticipated outliers of stock market. Weather these outliers are truly Black Swans that cannot be anticipated or they are avoidable? Also we try to evolve a quantitative strategy to earn superior returns. The simple strategy not only removes outliers from portfolio but also increases average daily returns from 0.05% to 0.35%. To test the risk return proposition we have used Sharpe ratio. We are also able to conclude that the daily Sharpe ratio shoots up 15 times in the results. We found increase in volatility in a declining market as Standard Deviation increases in declining market. We also conclude that returns are generated only during up trend in the market.
Keywords - Black Swan, Stock Investing, Outliers, Tactical, Technical Analysis, Seasonality, Quantitative, EMH, Market Timing
________________________________________________________________________________________________________
INTRODUCTION
In January, 2008 the world financial markets witnessed a meltdown. The US sub-prime crises had taken its toll on the world-wide financial system. The Indian stock market was no exception and it hit negative circuits. Investors saw carnage and lost money. Mutual Funds, institutions and investors could not save or protect their investments as the event was not expected and they were always taught to buy and hold investments in stock markets. The very foundations of Efficient Market Hypothesis [1] says that, “It is not possible to time the market” as the constant flow of information makes stock prices fluctuate and the information is not predictable.
Fooled by Randomness [2] and The Black Swan [3] published by Nassim Nicholas Taleb has endorsed the fundamental assumptions of Efficient Market Hypothesis [1]. The concept of “Black Swan” popularized by, Taleb talks about ‘the occurrence of unforeseeable events that are thought of to be not possible’.
The Black Swan can be explained as [3]:
1. An outlier outside the realm of regular expectations because nothing in the past can convincingly point to its occurrence.
2. The event carries an extreme impact.
3. Explanations for the occurrence can be found after the fact, giving the impression that it can be explainable and predictable.
The truth here is that Black Swans or Outliers do occur. If we study the occurrence of Outliers in the Indian stock market, starting from 1997 there have been 38 more occurrences of outliers than expected. In his book The Failure of Risk Management
[4]
Hubbard has illustrated the inability of the Gaussian Models. Following test clearly demonstrates failure of Gaussian curve in it’s inability to forecast the maximum possible daily movement.
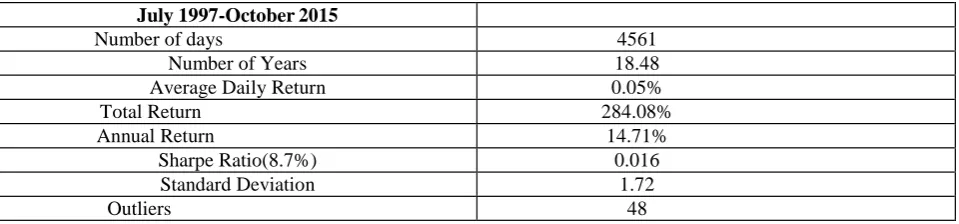
For this test we have considered trading days of Sensex starting from 1st July, 1997 to 29th October, 2015. The data has been collected from www.bseindia.com. Considering previous days close as the base price if we calculate daily movement in percentage, there have been 4561 trading days. The statistics for the period are summarized in Table 1.
The Outliers are the daily movements which fall out of mean daily movement plus three times standard deviation and mean daily return less three times standard deviation range. As per Gaussian Curve the occurrence of such events should be only 0.27% of total observations. The expected occurrence of such outliers in Sensex should be 9.58 times in the period starting from July, 1997 to October, 2015. But, the actual occurrence is 48 times. These days of unexpected abnormalities are the Black Swans of Sensex.
Table 1
IJEDR1504115
International Journal of Engineering Development and Research (www.ijedr.org)675
July 1997-October 2015
Number of days 4561
Number of Years 18.48
Average Daily Return 0.05%
Total Return 284.08%
Annual Return 14.71%
Sharpe Ratio(8.7%) 0.016
Standard Deviation 1.72
Outliers 48
Out of 48 outliers, 25 have been the most damaging days for the market. If we simply could eliminate these 25 days the average daily return shoots up to 0.10%. Our concern here is to avoid these negative outliers and improve the performance of investments. The total impact of negative outliers is -163.49% on portfolio. The year wise summery is given in Table 2 given below.
Table 2
Year Negative Outliers
1997 0
1998 2
1999 0
2000 5
2001 4
2002 0
2003 0
2004 2
2005 0
2006 1
2007 0
2008 9
2009 2
2010 0
2011 0
2012 0
2013 0
2014 0
2015 0
Total 25
The popular theories like, Black Swan and Efficient Market Hypothesis have proved that rare events like outliers cannot be avoided as they are impossible to predict. And hence, there is nothing to do other than buy and hold investments and wait out any negative outliers. However, this paper presents a simple but effective quantitative method to avoid Black Swan event like unanticipated negative outliers.
LITERATURE REVIEW
“Measures of uncertainty that are based on the bell shaped curve simply disregard the possibility, and the impact, of sharp jumps……..Using them is like focusing on the grass and missing out on the (gigantic) trees. Although unpredictable large deviations are rare, they cannot be dismissed as outliers because, cumulatively, their impact is so dramatic.” (Taleb, 2007)[2] (Taleb, 2007)[3] defines a black swan as an event with three attributes:
1. It is an outlier, lying outside the realm of regular expectations because nothing in the past can convincingly point to its occurrence.
2. It carries an extreme impact.
3. Despite being an outlier, plausible explanations for its occurrence can be found after the fact, thus giving it the appearance that it can be explainable and predictable. Thus a black swan characteristics can be summarized as: rare, extreme impact, and retrospective predictability.
4. Looking at its’ unpredictable nature and massive impact it is recommended to adjust to the existence of black swan rather than trying to predict them (Taleb, 2007) [3].
IJEDR1504115
International Journal of Engineering Development and Research (www.ijedr.org)676
The impact of outliers is huge on the long term returns of portfolios of investors. Black Monday (*Black Monday is 28th October, 1929 on which Dow fell 12.8%) was an extremely rare event; it did have a very significant impact on investors’ portfolios (Haugen, 1999)[7].The EMH(Fama, French)[1] also advocates buy and hold strategy and negates earning superior returns by timing the market as predicting stock prices is not possible as prices change due to information and information is unpredictable. This means, an investor does not have a way to escape black swans and earn superior returns. The acceptability of EMH is unquestionable and it makes many investors exposed to the risk of outliers.
(Estrada)[8] studied evidence from 16 emerging markets (Argentina, Brazil, Chile, India, Indonesia, Israel, Korea, Malaysia, Mexico, Peru, Philippines, South Africa, Sri Lanka, Taiwan, Thailand and Turkey) covering over 110,000 daily returns showed that a few outliers have massive impact on long term performance. Also he found that missing the best 10 days resulted in loss of 69.3% and missing the worst 10 days resulted in value addition of 337.1% .(Estrada)[9] also studied the US stock markets and found similar pattern.
A number of academic papers have examined the effects of missing both the best 10 days as well as the worst 10 days(Gire, 2005) [11](Ahrens, 2008)[10]. This remains one of the major dark spot in investing as these misleading statistics make people believe in Buy & Hold strategy, and thus exposing them to outliers. Across the world academicians and professional investment managers have always believed in the principal of averaging, by investing regularly over a period of time and thus hedging the risk by time.
Simple investment strategies can help to avoid black swans and can improve portfolio performance significantly (Mebane Faber, 2011) [12]. Also, even if the best 10 days are missed in attempt to protect the portfolio from the worst 10 days, the portfolio will still have superior returns (Mebane Faber, 2011) [12]. This also eliminates the statistics endorsed by many researchers of missing the best 10 days and its’ adverse effects on portfolio returns while timing the market
(Faber, 2007) [13] tested a simple method of using 10 month simple moving average for market timing and found it to be very profitable. (Wong et al, 2003) [14] studied timing of stock market with moving averages and found them more profitable than buy & hold strategy, they also confirmed the superior returns of trend following strategies.
In this study we aim to derive a strategy that can help to eliminate effects of outliers from portfolio and derive superior returns from investments.
THE QUANTITATIVE SYSTEM
The proposed trading system using moving average method has the following distinct features: 1. It is very simple and easy to understand.
2. It is purely mechanical and hence completely removes emotional and subjective decision making. 3. The model can be applied to various asset classes by pre testing.
4. It is price based and does not require knowledge of complicated mathematics, statistics or software.
Moving average based trading systems are the simplest and most popular trend-following systems (Taylor & Allen, 1992). Moving averages have been significantly profitable (Wong et al, 2003). The example mentioned below shows Closing price with 10 Day SMA of BSE Sensex.
Many analysts use moving averages as the trend deciders. 200 Day SMA is one of the most cited longer term measure of trend used by both Technical as well as Fundamental Analysts. (Jeremy Siegel, 2008) investigates the use of 200 day SMA in timing Dow Jones Industrial Average from 1886-2006. He concluded that market timing improves the absolute and risk adjusted returns over Buy & Hold in DJIA. (Wong et al, 2003) used various moving averages starting from short term to long term in Singapore Stock Markets and found them effective.
If Moving averages are truly able to improve risk adjusted portfolio performance, It should be able to avoid Black Swans (Unanticipated Outliers). Without avoiding major negative outliers it is not possible to generate superior returns. (Faber, 2011) has found Outliers to be cluttered below 200 Day SMA.
The System we propose is as follows.
BUY RULE
Buy when daily close price > Day SMA*
IJEDR1504115
International Journal of Engineering Development and Research (www.ijedr.org)677
Sell when daily close price < Day SMA*1. All the entry and exit prices are based on the signal at the end of the day. The model does not consider intraday crosses above or below averages.
2. Brokerage, Slippage and Taxes are ignored while calculations. 3. Dividend income is not included while calculating returns. 4. We have not considered 6% p.a. returns while on cash. We summarize the various DSMA strategies as follows:
Table 3
Name Trading System
System 1 10 Day Simple Moving Average
System 2 25 Day Simple Moving Average
System 3 50 Day Simple Moving Average
System 4 100 Day Simple Moving Average
System 5 200 Day Simple Moving Average
* We have tested various SMAs for the model to find the best portfolio. Replacing various SMAs will not change other rules.
RESULTS
Table 4: BSE Sensex( 1st July, 1997 to 29th October, 2015) 10 days SMA
Sensex System 1
Number of Days 4561 2030
Average Daily Return 0.05% 0.35%
Return 284.08% 672.25%
Return of Cash Days 0 25.17%
Standard Deviation 1.72% 1.28%
Sharpe Ratio # 0.016 0.25
Worst Day -11.14% -4.81%
Best Day 17.34% 17.34%
Negative Outliers 25 0
Table 5: BSE Sensex( 1st July, 1997 to 29th October, 2015) 25 days SMA
Sensex System 2
Number of Days 4561 2048
Average Daily Return 0.05% 0.22%
Return 284.08% 442.74%
Return of Cash Days 0 24.29%
Standard Deviation 1.72% 1.34%
Sharpe Ratio # 0.016 0.15
Worst Day -11.14% 4.81%
Best Day
17.34% 17.34%
Negative Outliers 25 0
Table 6: BSE Sensex( 1st July, 1997 to 29th October, 2015) 50 days SMA
IJEDR1504115
International Journal of Engineering Development and Research (www.ijedr.org)678
Number of Days 4561 2022
Average Daily Return 0.05% 0.18%
Return 284.08% 353.97%
Return of Cash Days 0 26.15%
Standard Deviation 1.72% 1.41%
Sharpe Ratio # 0.016 0.11
Worst Day -11.14% -7.25%
Best Day 17.34% 17.34%
Negative Outliers 25 2
Table 7: BSE Sensex( 1st July, 1997 to 29th October, 2015) 100 days SMA
Sensex System 4
Number of Days 4561 1970
Average Daily Return 0.05% 0.16%
Return 284.08% 316.1%
Return of Cash Days 0 26.15%
Standard Deviation 1.72% 1.47%
Sharpe Ratio #
0.016 0.09
Worst Day -11.14% -11.14%
Best Day 17.34% 17.34%
Negative Outliers 25 2
Table 8: BSE Sensex( 1st July, 1997 to 29th October, 2015) 200 days SMA
Sensex System 5
Number of Days 4561 2071
Average Daily Return 0.05% 0.12%
Return 284.08% 256.39%
Return of Cash Days 0 24.49%
Standard Deviation 1.72% 1.49%
Sharpe Ratio # 0.016 0.06
Worst Day -11.14% -11.14%
Best Day 17.34% 17.34%
Negative Outliers 25 3
# The sharp ratio is calculated as follows (Average daily return – Risk free daily return) / Standard Deviation
FINDINGS
From the tests we are able to summarize findings as follows.
IJEDR1504115
International Journal of Engineering Development and Research (www.ijedr.org)679
2. All the quantitative systems reduce portfolio volatility as the standard deviation decreases compared to buy & holdstrategy. The standard deviation of buy & hold is found to be 1.72% for the test period, whereas System 1 reduces risk to 1.28%.
3. As the time period of average for the test is increased, the volatility increases. The standard deviation for all the systems starting from System 1 is as follows 1.28%, 1.34%, 1.41%, 1.47% and 1.49%.
4. The average daily return for all systems starting from System 1 is as follows 0.35%, 0.22%, 0.18%, 0.16% and 0.12%. 5. Sharpe ratio for System 1 is found to be 0.25 and is highest amongst all. The Sharpe ratio starting from System 2 is as
follows 0.15, 0.11, 0.09 and 0.06.
6. System 1 Sharpe ratio if found to be 15 times more than buy & hold strategy.
7. System 1 and 2 are able to completely eliminate negative outliers from the portfolio saving the loss of -163.49% caused by negative outliers.
8. System 3 and 4 are able to avoid 23 negative outliers. System 5 is able to avoid 22 outliers.
9. For all the systems the days when market is below moving average, the returns are found to be negative. The negative returns on non-invested days are as follows starting from System 1 -0.32%, -0.17%, -0.11%, -0.08% and -0.05%.
CONCLUSION
The paper has demonstrated that it is possible to avoid negative outliers (Black Swans) from stock market investments and trading. It is also possible to decrease portfolio risk (volatility) by using simple quantitative methods of investing as per the systems tested in this paper as evidenced by decreased standard deviation as compared to buy and hold strategy. The various moving average strategies tested in this paper have significantly outperformed the market on both the fronts – margin and risk. The System 1 has improved the margin by 700%. The System 1 has Sharpe ratio of 0.25 against 0.016 of buy and hold. This research has further pointed out that with increase in length of average the daily average return decreases and the sharp ratio also decreases Market returns are found to be present only during positive trend periods, during rest of the periods the returns are found to be negative. The Trading systems proposed in this paper are powerful applications of simple moving averages. However these averages suffer from inherent limitations of not being very effective when market behaves in a trend less manner. The investors should exercise enough caution as markets can surprise with a sharp move against trend and can result in portfolio loss. Hedging in appropriate form may be used to avert risk.
REFERENCES
[1] Fama, Eugene (1970). “Efficient Capital Markets: A Review of Theory and Emprical Work”. Journal of Finance,25(2), 383-417.
[2] Taleb, Nassim (2001). Fooled by Randomness. The Hidden Role of Chance in Life and in Markets. Random House. [3] Taleb, Nassim (2007). The Black Swan. The Impact of the Highly Improbable. Random House.
[4] Hubbard, Douglas (2009). The Failure of Risk Management : Why It’s Broken and How to Fix it. WILEY. [5] Fama, Eugene (1965). “The Behavior of Stock Market Prices”. Journal of Business, 38, 34-105.
[6] Mandelbrot, Benoit (1963). “The Variations of Certain Speculative Prices”. Journal of Business, 36, 394-419. [7] Haugen, Robert (1999). Beast on Wall Street. How Stock Volatility Devours Our wealth. Prentice Hall.
[8] Estrada, Javier, Black Swans in Emerging Markets (September 3, 2008). Available at SSRN: http://ssrn.com/abstract=1262723
[9] Estrada, Javier, Black Swans, Market Timing, and the Dow (November 2007). Available at SSRN: http://ssrn.com/abstract=1086300
[10] Ahrens, Richard (2008), “Missing the Ten Best Days”. Technical Analysis of Stocks and Commodities, 26(4), 56-57. [11] Gire, Paul (2005). “Missing the Ten Best”. The Journal of Financial Planning.
[12] Faber, Mebane T., Where the Black Swans Hide & the 10 Best Days Myth (August 1, 2011). Cambria – Quantitative Research Monthly, August 2011. Available at SSRN: http://ssrn.com/abstract=1908469
[13] Faber, Mebane T., A Quantitative Approach to Tactical Asset Allocation (February 17, 2009). Journal of Wealth Management, Spring 2007. Available at SSRN: http://ssrn.com/abstract=962461
IJEDR1504115
International Journal of Engineering Development and Research (www.ijedr.org)680
Annexure 1
Occurrence of Negative Outliers:
Date Open High Low Close
% Movem ent 10 SMA 25 SMA 50 SMA 10 0 SM A 20 0 SM A 06/15/19 98 3344. 49 3344. 49 3151. 23 3152. 96 -5.8089 6 3416.7 63 3674.0 14 3881.8 78 3712.3 55 3752.3 28 10/05/19 98 3036. 15 3036. 15 2877. 92 2878. 07 -7.2275 6 3118.5 28 3067.8 97 3058.3 54 3251.7 02 3470.7 98 04/04/20 00 4907. 41 4907. 41 4666. 95 4691. 46 -7.1538 5 5064.9 95 5257.1 87 5420.1 55 5182.5 43 4903.5 34 04/17/20 00 4797. 95 4899. 54 4797. 95 4880. 71 -5.6344 2 5105.1 45 5135.1 16 5393. 81 5227.5 96 4943.6 03 05/02/20 00 4736. 02 4737. 68 4344. 51 4372. 22 -6.1261 8 4633.0 24 4923.5 86 5206. 05 5219.5 89 4957.2 74 07/24/20 00 4347. 52 4353. 44 4188. 34 4188. 34 -6.1680 3 4692.5 77 4763.8 85 4562.2 88 4777.4 25 4917.4 96 09/22/20 00 4188. 47 4208. 66 4028. 49 4032. 37 -5.2811 7 4464.2 92 4471.8 05 4450.1 53 4481.6 79 4853.2 36 03/13/20 01 3605. 53 3777. 48 3436. 75 3540. 65 -6.0309 6 3997.5 98 4194. 12 4184.6 28 4064.3 98 4245.9 26 09/14/20 01 2986. 86 2986. 86 2770. 24 2830. 12 -5.2679 4 3127.2 63 3232.6 82 3285.1 68 3401.3 22 3697.5 02 09/17/20 01 2758. 16 2758. 16 2640. 58 2680. 98 -5.2697 4 3072.6 49 3207.1
37 3272.4