IJEDR1503049 International Journal of Engineering Development and Research (www.ijedr.org) 1
To Study the Trends of Activation Energy in Metal
Extractions Process
1
Rakesh M Prajapati , 2 Prof. I.J.Patel, 3Pravin Zinzala,
1M.E Student , 2Professor , 3Assistant Professor
1 PG Student in Mechanical Engineering Department, LJIET, Ahmadabad, India,
_______________________________________________________________________________________________
Abstract -The project aim set study of thermal behavior, thermal degradation kinetics, and effect of composition on flow characterization of blast furnace slag is important to Understanding the flow characteristics of blast furnace (B/F) slag. It is an important parameter for efficiency/productivity of a blast furnace. In the present study flow characteristics of five different B/F slag will be investigated. This study is predominantly based on the estimation of activation energy. The activation energy was estimated using two methods: differential scanning calorimetry (DSC) and High temperature viscometer. Activation energy can be estimated from such DSC plots using Kissinger and Ozawa methods. It has observed that activation energy is largely dependent on C/S ratio of B/F Slag – The activation energy decreases with increase in C/S ratio. The flow characteristics of different B/F slag were also investigated by high temperature heating microscope, Differential scanning calorimetry (DSC). The estimated IDT (initial deformation temperature), ST (softening temperature), HT (hemispherical temperature) and FT (fusion temperature) of different B/F slag was shown in table
Index Terms – Blast Furnace, Activation Energy, DSC
________________________________________________________________________________________________________
I.INTRODUCTION
Most reactions involving neutral molecules cannot take place at all until they have acquired the energy needed to stretch, bend, or otherwise distort one or more bonds. This critical energy is known as the activation energy of the reaction. Higher temperatures, faster reactions:It is common knowledge that chemical reactions occur more rapidly at higher temperatures. Everyone knows that milk turns sour much more rapidly if stored at room temperature rather than in a refrigerator, butter goes rancid more quickly in the summer than in the winter, and eggs hard-boil more quickly at sea level than in the mountains. For the same reason, cold-blooded animals such as reptiles and insects tend to be noticeably more lethargic on cold days. It is not hard to understand why this should be. Thermal energy relates direction to motion at the molecular level. As the temperature rises, molecules move faster and collide more vigorously, greatly increasing the likelihood of bond cleavages and rearrangements as described above.
Fig.1 Activation Energy and Activated complex
A general objective of the analysis and prediction of thermally activate reactions is the derivation of a complete description of the progress of a reaction that is valid for any thermal treatment as a
Isothermal by linear heating
Non-isothermal treatment
IJEDR1503049 International Journal of Engineering Development and Research (www.ijedr.org) 2
𝐝𝛂 𝐝𝐭
= 𝐟(𝛂)𝐤(𝐭) (𝟏)
Temperature dependent function follows Arrhenius type dependency,
𝐊𝐓
= 𝐊𝟎 𝐞𝐱𝐩 (−𝐄
𝐑. 𝐓) (𝟐)
The quantity α is the degree of conversion, f(α) is a mathematical function whose form depends on the reaction types and KT is the temperature dependent rate constant K0 is pre exponential factor , E is the activation energy and R is the gas constant, 8.314 J/mol K
From equation (1) and equation (2)
𝐝𝛂 𝐝𝐭
= 𝐊 𝐟(𝛂) 𝐞𝐱𝐩 − ( 𝐄
𝐑. 𝐓) (𝟑)
II.LITERATURE REVIEW
Borham, B. M. et al [1] studied the urea nitrate by differential thermal analysis (DTA) curves using the Murray and White equation and various other reaction rate equations and An average activation energy ∆E‡ of 31.7 ± 10.0 kcal/mole was calculated and they have shown that These results illustrate the pronounced effect of self-heating on calculation of activation energies. The Kissinger method of calculating the reaction order developed for endothermic DTA peaks produced good results when applied to the present DTA study.
C T Moynihan et al [2]. Studied the activation energy ∆H for structural relaxation in the glass transition region which determined from the heating rate dependence of the glass transition temperature Tg or the cooling rate dependence of the limiting fictive temperature T′f measured using DSC or DTA. The activation energy ∆H for structural relaxation m the glass transition region can be determined from the heating rate dependence of the glass transition temperature Tg or the cooling rate dependence of the limiting fictive temperature T’f measured using DSC or DTA. ∆H values determined this way are in good agreement with the shear viscosity activation energies ∆Hn. ∆Hn * for high Tg inorganic glasses can also be estimated from the width ∆(1/Tg) of the glass transition region measured by DSC or DTA using an empirical constant C = (∆Hn */R)∆(1/Tg). New data for sodium borate glasses yield values of the constant C in agreement.
Keuleers, R. R., J. F. Janssens, et al [3] comparison the effective methods for calculation of activation energy for the thermal decomposition of chemical compounds .They have studied for the comparative study of different measurement and calculation procedures for the thermal decomposition of Mn (Urea)2 Cl2.
Starink, M. J, et al [4] studied the Model-free iso-conversion methods which were most reliable methods for the calculation of activation energies of thermally activated reactions and a large number of these iso-conversion methods have been proposed in the literature . Type A methods such as Friedman methods make no mathematical approximations, and Type B methods, such as the generalised Kissinger equation. And they found that accuracy of determination of transformation rates is limited, and type B methods will often be more accurate than type A methods.
Homer E. Kissinger et al [5] studied the Variation of Peak Temperature with Heating Rate in Differential Thermal Analysis and found that Changes in heat content of the active sample are indicated by deflections shown by a line representing the differential temperature. It is conventional to represent an endothermic effect by a negative deflection and an exothermic effect by a positive deflection. The deflections, whether positive or negative, are called peaks.
Masashi Nakamoto et al [6] studied the viscosity of molten slag with low melting point to develop an improved blast furnace operation at lower temperature such as 1673 K. They measured the viscosities of molten CaO- SiO2-MgO-Al2O3 slag by rotating
cylinder method and compared with the results of the model developed. They showed that slag with composition 35% Al2O3-43.1%
CaO-7.5% MgO-14.4% SiO2 has melting temperature below 1673 K and has a viscosity less than 0.6 Pa.s below 1673 K.
Y.S. Lee et al [7] studied the influence of MgO and Al2O3 contents on the viscosities of blast furnace slag containing FeO. The
viscosities of CaO-SiO2-Al2O3-MgO-FeO slag were measured under conditions of C/S 1.35-1.45, 10-18% Alumina, 3.5-10% MgO
IJEDR1503049 International Journal of Engineering Development and Research (www.ijedr.org) 3
III. EXPERIMENTAL PROCEDURE
The Experimental Work Is Divided In ‘Five’ Parts, The Aim Being to determine the Activation Energy of Blast Furnace Slag and Correlate the chemical composition of Slag for proposing the Flow Characteristics that would Give Slag Behavior with Blast Furnace:
Collected Five Blast Furnace Slag from Steel Plant Contained Different Heat
To Determine Chemical Composition By Conventional Methods (Chemical Analysis).
For Estimation of Activation Energy We have done two measurements i.e. DSC & Viscosity measurements
Flow Characteristics of Sample were carried out on Heating Microscope Analysis
Microstructure analysis were carried out by Scanning Electron Microscope (SEM)
Phase Analysis of sample were carried out by X-Ray Diffraction Techniques (XRD) .
IV. EXPERIMENTAL DATA
Table. 1 Chemical composition (wt %) of blast furnace slag
Sr No SiO2 Al2O3 CaO MgO TiO2 Na2O K2O Fe2O3 C/S
1 31.86 16.92 38.00 10.23 0.7 0.98 0.48 0.66 1.192
2 33.25 16.31 38.84 10.56 0.82 1.1 0.52 0.54 1.107
3 32.48 17.00 35.78 11.88 0.55 1.1 0.52 0.60 1.101
4 31.08 17.04 36.96 11.22 0.5 1.8 0.88 0.40 1.189
5 34.32 16.58 36.2 9.57 0.55 1.36 0.82 0.53 1.054
`
Fig.1 DSC Curves of four powdered slag samples: sample 1, sample 2, sample 3, sample 4, at different heating rates @ 2, 4, 6, 8 and 100C/min
Thermal analysis of blast furnace slag is carried out by DSC (Differential Scanning Calorimeter) measurement to determine the crystallization mechanism as mentioned in Section 4.4 and Fig.1 -shows four DSC curves of finely powdered blast furnace slag sample whose C/S ratio 1.192., 1.107, 1.101, and 1.189 respectively.
IJEDR1503049 International Journal of Engineering Development and Research (www.ijedr.org) 4
Ln ( ∅ Tp2
)
= −Ea
R. Tp
+ Constan𝑡 (4)
2. Ozawa Method –
Ln (∅)
= −Ea
Tp R+ Constan𝑡 (5)
Where
Ø is heating rate in K/min
Tp is peak point temperature in (k) at melting point of slag,
R is universal Gas constant = 8.314 J/mol-k, Ea is Activation Energy in KJ/mole
Calculation of Peak Temperature from DSC curve of different sample at different heating rate. The glass-transition temperature Tg has determined as the point of intersection of the straight-lines extending from the tangents of the DSC curves in the region of
the baseline shift. Some similar features of each thermo gram are apparent
A reversible endothermic peak at beginning of crystallization temperature, corresponding to the glass-transition temperature Tg
Exothermic events with maxima in the range of 10000C to 11000C, indicating crystallization temperature T c
Endothermic events at about 1280 0C ± 1315 °C, involving the melting of some crystal phases, T p (K)
Table 3 Peak temperature of different obtained from DSC Curve (0C/min)
Heating rate
W0
(mg) T (min.)
Tp (K)
Sample: 1 C/S: 1.192
Tp (K)
Sample: 2 C/S: 1.107
Tp (K)
Sample: 3 C/S: 1.101
Tp (K)
Sample: 4 C/S: 1.189
2.0 25.0 287.00 1468.8 1472.1 1466.6 1466.6
4.0 25.0 199.50 1473.2 1471.6 1466.2 1469.2
6.0 25.0 170.30 1474.2 1473.5 1467.7 1469.5
8.0 25.0 155.75 1474.8 1474.4 1467.6 1471.3
10.0 25.0 147.00 1476.8 1476.0 1468.7 1471.2
From the given tabulation value and plot between Activation Energy vs. C/s ratio gives the conclusion that As the C/S ratio increases the Activation Energy values decreases and so viscosity of slag decreases due to increase of C/S value basic oxide namely lime, magnesia provide oxygen, act as network breakers and result in depolymerisation of the melt there by decreasing the viscosity
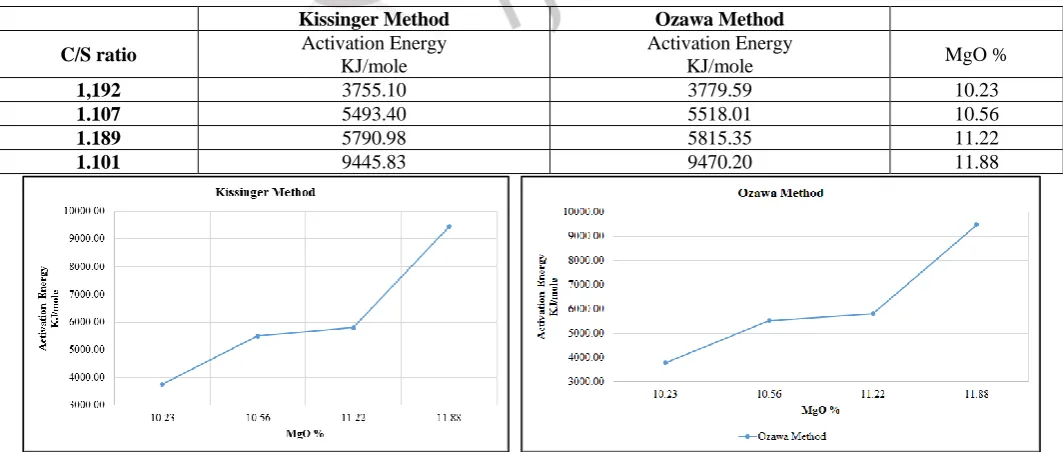
Table. 3 Activation Energy and MgO% by Kissinger and Ozawa Methods
Kissinger Method Ozawa Method
C/S ratio Activation Energy
KJ/mole
Activation Energy
KJ/mole MgO %
1,192 3755.10 3779.59 10.23
1.107 5493.40 5518.01 10.56
1.189 5790.98 5815.35 11.22
1.101 9445.83 9470.20 11.88
IJEDR1503049 International Journal of Engineering Development and Research (www.ijedr.org) 5 These Graphs shows that as the MgO% increases Activation Energy increases up to 10.56% of MgO contain and then it does not show any significant variation till 11.2% MgO. Beyond 11.22% MgO the Activation Energy again shows an abrupt increase with increase of MgO percentage
In my experimental work calculation of viscosity of blast furnace slag has done by VIS 403 Rotating High Temperature Viscometer which has viscosity range 101-108 dPas, Max Temperature 17000C.
In viscosity measurement rate of cooling from liquid phase has adopted 50C/min. The calculation of viscosity by Arrhenius equation [16] mainly depends on temperature and chemical composition
ή
= AeRTE (6)
Where
ή is viscosity of slag during cooling (d pas), E is Activation Energy KJ/mole,
R is universal Gas constant =8.314 J/mole, T is Temperature in Kelvin
The calculation of viscosity of blast furnace slag has done by the Arrhenius equation. We obtained viscosity 2.95d pas at 1299.30C of slag sample 4. Which chemical composition is given in Table no 5.6
From this value we have calculated logarithmic value of slag viscosity and this gives the Activation Energy 3906.1002 KJ/mole. Which is approximately same value is as obtained from DSC analysis.
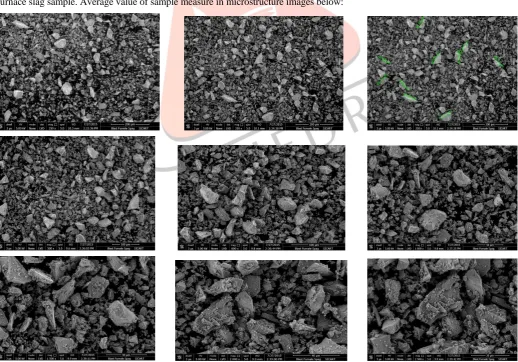
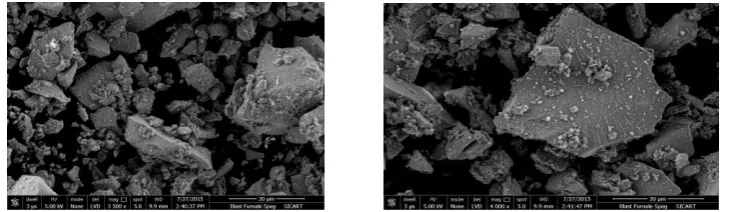
Microstructure
IJEDR1503049 International Journal of Engineering Development and Research (www.ijedr.org) 6
Fig. 3 SEM Microgpahes at at 350 to 4000 magnifications of powder sample having C/S Ratio of 1.192
V.CONCLUSION
Methods adopted for the calculation of activation energy gave identical values by DSC analysis.
The values of activation energy obtained by DSC analysis also matched with the results of viscosity measurement
As the C/S ratio increases the Activation Energy decreases 1.078 and MgO 10.09 to 11.01%) resulting in a short slag.
As the MgO percentage increases the Activation Energy increases up to 10.56% of MgO and then after 11.22% of MgO abruptly increases Activation Energy
The calculated value of Activation Energy was much higher may be due to lattice strain in the silicate structure
.
VI.REFERENCE
[1] B M Borham Et al, “Estimation of Activation energies from differential thermal analysis curves”, Thermochimica Acta, 2014,pp 345-351.
[2] C T Moynihan Et al, “Estimation of activation energies for structural relaxation and viscous flow from DTA and DSC experiments”, Thermochimica Acta, 2014, pp 153-162
[3] R R Keuleers Et al, “Comparison of some methods for activation energy determination of thermal decomposition reactions by thermogravimetry”, Thermochimica Acta, 2002, pp 127-142
[4] M J Starink, “Activation energy determination for linear heating experiments: deviations due to neglecting the low temperature end of the temperature integral” , J Mater Sci, 2007, pp 483-489
[5] Homer E Kissinger, "Reaction kinetics in differential thermal analysis." Analytical chemistry, 2014 pp:1702-1706
[6] Masashi Nakamoto Et al, “Evaluation of Viscosity of Molten SiO2-CaO-MgO-Al2O3 slags in blast furnace operation”, ISIJ International, 2004, pp 2115-2119
[7] Y.S.Lee Et al, “Viscous behavior of CaO- SiO2- Al2O3-MgO-FeO slag”. Proceedings of VIII international conference on molten slag, fluxes and salts, The South African Institute of Mining and Metallurgy, 2004, p.225
[8] Dr. R H Tupkary, “An Introduction to Modern Iron Making” Khanna Publication.
[9] Boggs, “General Chemistry Virtual Textbook → kinetics/dynamics → collision / activaton” 2014 www.chem1.com/acad/webtext/dynamics/dynamics-3.html