University of South Carolina
Scholar Commons
Theses and Dissertations
2018
Cortical Damage and Disconnection Contribute to
Post-Stroke Sensorimotor Impairment
Shafagh Yazdani University of South Carolina
Follow this and additional works at:https://scholarcommons.sc.edu/etd Part of theExercise Science Commons
This Open Access Thesis is brought to you by Scholar Commons. It has been accepted for inclusion in Theses and Dissertations by an authorized administrator of Scholar Commons. For more information, please [email protected].
Recommended Citation
Cortical Damage and Disconnection Contribute to Post-Stroke
Sensorimotor Impairment
by
Shafagh Yazdani
Bachelor of Science University of Tehran, 2009
Submitted in Partial Fulfillment of the Requirements
For the Degree of Master of Science in
Exercise Science
Norman J. Arnold School of Public Health
University of South Carolina
2018
Accepted by:
TroyM. Herter, Director of Thesis
Stacy L. Fritz, Reader
Roozbeh Behroozmand, Reader
D
EDICATIONA
CKNOWLEDGMENTSI would like to express my great appreciation to all of those who put in time and energy to help,
support, and guide me. A special thanks to my advisor, Dr. Troy Herter, who patiently guided
me along in my studies and research, supported me to attend conferences and presentations,
and helped me in the arduous process of completing my dissertation. He has set an example of
excellence as a researcher, mentor, instructor, and role model. I also would like to thank Dr.
Grigori Yourganov, who helped me tremendously by teaching me the fundamentals of MRI
and neuroimaging analyses. I would also like to thank Dr. Stacy Fritz and Dr. Roozbeh
Behroozmand for serving on my dissertation committee and mentoring me in the formative
stages of my dissertation. I would like to thank the members of the different research groups
in Department of Exercise Science at the University of South Carolina, including Dr. Jill
Stewart, Dr. Tarkeshwar Singh, Chris Perry, and Adam Harrison. I would like to thank all my
friends in Columbia, South Carolina, who have been like a family to me. Last, but not least, I
would like to thank my husband who has patiently supported me throughout my studies, my
A
BSTRACTBACKGROUND. Stroke is a cerebrovascular event that causes permanent damage to brain regions and decreases in connectivity (disconnection) between brain regions. Most stroke
survivors have permanent difficulties performing functional motor tasks, thus research into
how damage and disconnection produce difficulties performing motor tasks can help guide
post-stroke rehabilitation. Previous studies have examined the extent to which cortical damage
produces motor impairments, but the extent to which disconnection produces motor
impairments remains unclear. Furthermore, studies have focused on how motor impairments
contribute to difficulties performing motor tasks, whereas the role of visuospatial impairments
has received little attention. Neuroimaging techniques for quantifying stroke-induced damage
and disconnection of brain networks are powerful tools for examining the neural mechanisms
that underlie difficulties performing visuomotor tasks. OBJECTIVE. The purpose of the proposed research study is to examine the extent to which cortical damage and disconnection
independently contribute to deficits in visuomotor task performance. HYPOTHESES. Three hypotheses will be tested. Hypothesis 1: Cortical damage and disconnection will be largely independent of each other. Hypothesis 2: Damage and disconnection involving two different (but partially overlapping) cortical networks will be associated with motor and visuospatial
cerebral artery at least six months before testing. Subjects will perform a bimanual, visuomotor
task (Object Hit), which will be used to quantify Task Performance (Object Hits), Motor
Impairment (Hand Speed Bias), and Visuospatial Impairment (Spatial Miss Bias). Magnetic
resonance imaging (MRI) and diffusion tensor imaging (DTI) will be used to quantify Damage
(Lesion Volume) and Disconnection (Connectivity Bias) of cortical visuomotor regions. These
T
ABLE OFC
ONTENTSDedication ... iii
Acknowledgements ... iv
Abstract ...v
List of Tables ... ix
List of Figures ...x
CHAPTER 1 Background and Significance ...1
1.1 Fundamental features of visuomotor behavior ...1
1.2 Paradigms for studying visuomotor behavior ...2
1.3 Robotic assessment of visuomotor impairments ...3
1.4 Cortical control of reaching in normal humans ...4
1.5 Lesion-symptom mapping in stroke ...7
CHAPTER 2:Research Question ...10
2.1Purpose ...10
2.2Hypothesis ...10
CHAPTER 3:Research Strategy ...12
3.1Participants ...12
3.2Clinical assessment ...12
3.3Neuroimaging ...13
CHAPTER 4:Results ...21
4.1 Participant characteristics ...21
4.2 Lesion volume of participants ...22
4.3 Relationships between behavioral measurements ...22
4.4 Relationships between cortical damage and disconnection ...23
4.5 Relationships between cortical damage and motor impairment ...23
4.6 Relationships between cortical disconnection and motor impairment ...23
4.7 Relationships between cortical damage and visuospatial impairment ...24
4.8 Relationships between cortical disconnection and visuospatial impairment ...24
4.9 Relationships between cortical damage and task performance ...24
4.10 Relationships between cortical disconnection and task performance ...25
CHAPTER 5:Discussion ...34
5.1Prediction of motor outcomes from cortical damage and disconnection ...34
5.2Limitations ...38
5.3Future directions ...38
Reference ...40
Appendix A-tables of lesion symptom mapping results ...49
L
IST OFT
ABLESTable 3.1 List of motor network of 30 ROIs within 8 cortical regions ...18
Table 4.1 Summary of demographic and clinical data...21 Table A.1 Lesion symptom mapping results of behavioral measurements...49
Table B.1 Connectome-Based Lesion symptom mapping results of task performance....50
Table B.2 Connectome-Based Lesion symptom mapping results of motor impairment...51
Table B.3 Connectome-Based Lesion symptom mapping results of visuospatial
L
IST OFF
IGURESFigure 1.1 Sensorimotor network...5
Figure 3.1 Robotic apparatus and task...16
Figure 3.2 Sensorimotor network comprised of eight distinct subnetworks...18
Figure 4.1 Lesion overlay in standard space from all participants...22
Figure 4.2 Relationships between behavioral measures...25
Figure 4.3 Relationships between cortical damage and disconnection...26
Figure 4.4 Relationships between cortical damage and motor impairment...27
Figure 4.5 Relationships between cortical disconnection and motor impairment...28
Figure 4.6 Connectome of correlations between cortical disconnection and motor impairment ...29
Figure 4.7 Relationships between cortical damage and visuospatial impairment...30
Figure 4.8 Relationships between cortical disconnection and visuospatial impairment...31
Figure 4.9 Relationships between cortical damage and task performance...32
CHAPTER 1
BACKGROUND AND SIGNIFICANCE
1.1. Fundamental features of visuomotor behavior
Humans perform a broad repertoire of daily motor tasks, such as cooking, eating, and
driving. These motor tasks often involve coordinated movements of both arms and hands to
interact with objects. They also rely on visual processing to identify what objects are present
in the environment and where those objects are located. Accordingly, the ability to efficiently
gather visual information and use it to coordinate bimanual arm and hand movements is critical
for normal performance of functional motor tasks.
Theoretical frameworks of information processing suggest that the brain carries out a
number of processes that transform sensory signals into motor commands, which are used to
perform voluntary movements. A fundamental question in movement neuroscience is where
and how the brain carries out these processes. Early theories suggested that the brain performs
serial information processing in which information is sequentially relayed between brain
regions that conduct specific processes (Donders, 1969). Within this framework, there are three
broad classes of information processing: 1) perception, in which specialized brain regions
interpret sensory information, 2) cognition, in which specialized brain regions manipulate
perceptual information to plan actions, and 3) action, in which plans are converted into motor
commands that control movement. A more recent framework posits that information is
2010). Action selection involves processing and evaluating sensory information to
decide when and where to move our limbs to achieve action goals. Action specification
involves processing and transforming sensory information to determine how to move our limbs
to achieve action goals.(Desmurget et al., 1998)
1.2. Paradigms for studying visuomotor behavior
To interact with objects in our surrounding environment, humans make hundreds of
coordinated arm movements (reaching) in everyday life. Many paradigms have been used to
study various features of visuomotor behavior. Notably, reaching movements have served as a
key paradigm for examining visuomotor behavior involving whole-limb movements.
Georgopolis and colleagues (1981) fist developed 2D and 3D reaching paradigms that were
used to examine the role of cortical neurons in the control of whole-limb movements to visual
targets. Kalaska and colleagues (1989) further advanced this paradigm by adding mechanical
loads to manipulate forces used to perform visually-guided reaching movements (Kalaska et
al. 1989). Others have subsequently developed robotic devices that are used to create various
mechanical environments for studying visually-guided reaching movements (Shadmher and
Mussa-Ivaldi, 1994; Scott, 1999). Overall, these paradigms have immensely contributed to our
understanding of the neural mechanisms that mediate visually-guided, limb movements.
As stated above, many functional tasks involve bilateral reaching movements in which
both arms either work independently or together to achieve task goals. A number of recent
studies have developed bilateral reaching paradigms for examining independent and coupled
control of bilateral reaching movements in normal and clinical populations (Asai et al., 2010;
Tyryshkin and colleagues (2014) used an upper-limb robotic device coupled to a virtual
environment to develop a bilateral object hitting task in which subjects made independently
controlled bilateral reaching movements to hit away objects using virtual paddles attached to
each hand. They used this paradigm to examine the how perception (visuospatial awareness)
and action (bilateral motor control) contribute to overall task performance in healthy adults and
stroke survivors.
1.3. Robotic assessment of visuomotor impairments
Clinical behavioral assessments are typically used to evaluate motor impairments
resulting from neurological disorders. Although most of these clinical assessments are valid
and reliable, they often exhibit several important limitations. First, they typically use
criteria-based scoring systems that often display floor or ceiling effects. As a result, they have poor
efficiency at detecting subtle but clinically relevant changes in visuomotor performance.
Furthermore, clinical assessments rarely examine bilateral control of movements and are often
unable to consider important details of motor performance such as reaction time and movement
speed. (Scott and Dukelow , 2011 ;Reinkensmeyer et al., 2004; Einav et al., 2011).
Assessment of motor impairments using robotic technology can provide valid and
reliable on in patients with sensorimotor impairments. For example, a reaching task
implemented on an limb robotic device provided a more sensitive estimation of
upper-limb motor function than standard clinical assessment scales like the Chedoke-McMaster
Stroke Assessment Scale (CMSA) and Fugl-Meyer Assessment (Coderre et al., 2010). This
contrast, the paradigm that Tyryshkin and colleagues developed for examining bilateral
reaching movements provides a better alternative for examining bilateral movements to visual
targets. Importantly, this paradigm allowed for independent examination of the extent to which
visuospatial awareness and bilateral motor control contribute to task performance (Tyryshkin
et al., 2014).
1.4. Cortical control of reaching in normal humans
A bilateral network of cortical regions and interconnecting tracts regulates planning
and execution of visually-guided, reaching movements (Figure 1). This network consists of
several brain regions within the frontal and parietal lobes, including primary motor cortex,
premotor cortex, supplementary motor area, somatosensory cortex, intraparietal sulcus,
parietooccipital sulcus, and precuneus. These regions contribute to the corticospinal tract,
which is the major neural pathway connecting cortex with the spinal cord. These cortical
regions are also part of a broader network involved in performing voluntary movements that
includes the basal ganglia, thalamus, cerebellum, and brainstem regions (Jaeger et al., 2014; la
Fougere et al., 2010; Takakusaki, 2017). A number of these regions project to the spinal cord
via the rubrospinal, reticulospinal, and vestibulospinal tracts.
1.4.1. Primary motor cortex
Primary motor cortex is located within the anterior bank of central (Rolando) sulcus
and posterior section of the precentral gyrus. It is highly interconnected with somatosensory
cortex and is the largest contributor to the corticospinal tract. It plays a key role in initiating
Figure 1.1 Sensorimotor network. SMA, supplementary motor area; M1, primary motor cortex; PMC, premotor cortex; CP, cerebral peduncle; RN, red nucleus (adapted from Peters et al., 2018).
1.4.2. Premotor cortex
Premotor cortex is located anterior to primary motor cortex within the anterior section
of the precental sulcus and posterior sections of the superior frontal sulcus, middle frontal gyrus
and inferior frontal sulcus. It has neurons that contribute to the corticospinal tract and is highly
interconnected with primary motor cortex and posterior parietal cortex. It is involved in
planning and initiating voluntary movements.
1.4.3. Supplementary motor area
The supplementary motor area (SMA) is located anterior to primary motor cortex and
coordinating complex movements, including sequential and bimanual movements (Walsh et
al., 2008).
1.4.4. Intraparietal sulcus
The intraparietal sulcus (IPS) is located within the posterior parietal cortex and is
highly interconnected with premotor cortex. It includes several subregions, which are involved
in visually-guided movements of the eyes, head, arms and hands. The medial intraparietal
sulcus is involved in planning of reaching movements (Kertzman et al., 1997).
1.4.5. Precuneus
The precuneus is located medially within the superior parietal gyrus and precuneus
gyrus. The anterior precuneus (aPCu) is involved in planning of visually-guided reaching
movements, though its specific role remains uncertain.
1.4.6. Superior parietooccipital sulcus
The superior parietooccipital cortex (SPOC) is located posterior to the precuneus within
the parietooccipital sulcus and cuneus gyrus. It is involved in planning of visually-guided
reaching movements, though its specific role remains uncertain.
1.4.7. Corticocortical tracts
Several white-matter tracts provide connections between cortical regions on the same
and opposite sides of the brain. The corpus callosum is the main tract connecting cortical
regions within the two hemispheres and plays a key role in interhemispheric inhibition, which
is essential for coordinating bimanual reaching movements (Wahl et al., 2007). The superior
longitudinal fasciculus connects the posterior parietal cortex with premotor and prefrontal
cortex within the same hemisphere (Makris et al., 2005; Schulz et al., 2015).
1.5. Lesion-symptom mapping in stroke
Stroke is cerebrovascular incident, resulting in decreased cerebral blood flow and
neuronal cell death. Stroke results in a widespread sensory, cognitive, and motor impairments,
and is the second leading cause of disability and death worldwide (Rehme et al., 2012).
Sensorimotor impairments contribute to difficulties performing daily (functional) activities
after stroke and are a major target for rehabilitation interventions following stroke. Research
aimed at better understanding how stroke affects sensorimotor function is essential for
enhancing post-stroke rehabilitation by informing the development of new therapies.
Lesion symptom mapping is a statistical technique for identifying associations between
brain lesions and impaired function. As a result, it is a key tool for understanding relationships
between the brain and behavior. Voxel-based lesion-symptom mapping (VLSM) has been used
since early 2000s to study the association between lesioned voxels obtained from magnetic
resonance imaging (MRI) and impaired behavior (Bates et al., 2003). This technique typically
uses an independent statistical test at each voxel within whole brain to create maps of areas
involved in various functions. It is usually an exploratory method that does not require
predefined regions of interest but has poor statistical power because it usually involves
compensate for this, VLSM requires large samples of patients (Rorden et al., 2007; Corbetta
et al., 2015).
A more recent variant of lesion-symptom mapping uses regions of interest (ROIs)
rather than individual voxels to determine associations between brain damage and impaired
behavior. In this analysis, ROIs are defined using brain anatomical atlases and the proportion
of damage within each ROI is used for computing statistical relationships. ROI-based
lesion-symptom mapping (RLSM) is statically more powerful than traditional VLSM because it
requires far fewer statistical comparisons (Findlater et al., 2016).
A major limitation of these lesion-symptom mapping techniques is that they were
designed for examining damage to grey matter structures are not well suited for examining
relationships between damage to white matter tracts and impaired behavior. As a result, studies
using these techniques have largely overlooked the extent to which behavioral impairments are
associated with disconnection caused by white matter damage.
Recent advances allow for better imaging of white matter tracts using Diffusion Tensor
Imaging (DTI) (Behrens et al., 2003). Tractography can then be used to reconstruct whole brain
white matter tracts from DTI images. Following stroke, decreases in the size of white matter
tracts (disconnection) have been observed independent of lesion volume (Yourganov et al.,
2016), which highlights the potential role of disconnection as a mediator of impaired behavior.
Tractography has subsequently been used to determine associations between disconnection of
brain regions and impaired behavior (Yourganov et al., 2016; Gleichgerrcht et al., 2017; Peters
et al., 2017). This connectome-based lesion-symptom mapping (CLSM) method is a
understanding of structure-function relationships by examining the roles of both damage and
CHAPTER 2
RESEARCH QUESTION
2.1. Purpose
Understanding the brain regions and networks that underlie motor function can help
guide post-stroke rehabilitation. Neuroimaging techniques that quantify stroke-induced
damage to brain structures and disconnection of brain networks are powerful tools for
examining the relationships between the brain and behavior. These techniques have advanced
our understanding of the neural mechanisms that underlie perceptual, cognitive and language
functions. However, studies of motor function have independently focused on damage and
disconnection. Furthermore, most studies have focused on deficits in motor control without
consideration for perceptual and cognitive contributions to motor performance. (Lindenberg et
al., 2010; Chen et al., 2013; Sterr et al., 2014) The objective is to investigate the extent to which cortical damage and disconnection independently contribute to motor impairments.
2.2. Hypotheses
Hypothesis 1. Motor impairments and visuospatial impairments will be independent of each other but related to task performance.
Hypothesis 2. Damage and disconnection of cortical sensorimotor regions will be largely independent of each other.
Hypothesis 4. Damage and disconnection of superior parietal, intraparietal, precuneus and superior parietooccipital ROIs will be primarily associated with visuospatial impairments.
CHAPTER 3
RESEARCH STRATEGY
3.1. Participants
The proposed research included 57 adults (39 male, 18 female, age 60±10 years old)
with mild to moderate upper-extremity motor impairment caused by a single, unilateral stroke
of the left middle cerebral artery at least six months before testing. Data was collected as part
of a larger collaborative study approved by the Institutional Review Board at the University of
South Carolina. Subjects were excluded if they had: 1) any history of a neurological disorder
other than stroke (questionnaire), 2) any ongoing musculoskeletal problems of either arm or
hand (questionnaire), 3) moderate to severe spasticity (clinical assessment), moderate to severe
cognitive impairment (clinical assessment), visual impairments (clinical assessment), or
visuospatial neglect (clinical assessment). All participants provided informed consent prior to
participation.
3.2. Clinical assessment
All participants completed a comprehensive clinical assessment to establish
inclusion/exclusion eligibility. We used the modified Ashworth Scale (Bohannon and Smith,
1987) to determine moderate to severe spasticity (scores > 2+), the Visual Cognition
Assessment (unpublished) to establish moderate to severe cognitive impairment (scores < 12),
a Snellen chart to test for visual impairment (corrected acuity > 50/20), and Landmark line
of visuospatial neglect (deviation > 10% on line bisection or accuracy < 90% on cancellation).
To further characterize participants, we used the Edinburg Handedness Inventory (Oldfield et
al., 1971) to examine handedness, the Box and Block test (Mathiowetz et al., 1985) to examine
manual dexterity, the Modified Nottingham Sensory Assessment (Lincoln et al., 1998) to
examine somatosensory function, the TULIA (Vanbellingen et al., 2010) to examine apraxia,
and the Stroke Impact Scale (Duncan et al., 1999) to examine difficulties performing function
tasks.
3.3. Neuroimaging
3.3.1. Data acquisition
Scanner: MRI and DTI data were acquired with a Siemens Trio 3T scanner and 12
channel head coil and were collected from each patient within two days of behavioral testing.
MRI: T1-weighted images were acquired using a high-resolution 3D MP-RAGE
sequence with 1 mm isotropic voxel. The matrix size was 256×256 and with 9-degree flip
angle. 192 slice sequence with repetition time (TR)=2250 ms, inversion time (TI)=925 ms,
echo time (TE)=4.15 and parallel imaging (GRAPPA=2, 80 reference lines) were used. Each
scan took about 7 minutes to be completed. T2-weighted images were acquired using a flip
angle evolution (3D-SPACE) sequence. This scan was acquired with TR=2800 ms, TE=402
ms, variable flip angle, and 256 × 256 matrix scan with 192 slices (1 mm thick), and parallel
imaging (GRAPPA X2, 120 reference lines) for lesion size and location determination.
mm FOV, and parallel imaging (GRAPPA of 2, 80 reference lines), axial slices of 2.7 mm
thickness, with 45 total number of slices and scanning time of 390 s.
3.3.2. Data Processing
MRI: Lesions were manually drawn by a neurologist on the T2-weighted images,
which were then coregistered with the native T1 images. Smoothing was then performed on
the T2 images using a 3mm Gaussian kernel (FWHM) to eliminate any jagged edges created
my manually drawing the lesions (Nachev et al., 2008). T1-weighted normalization to standard
MNI space were performed with enantiomorphic unified segmentation using software
Statistical Parametric Mapping (SPM) 12 in-house Matlab scripts (Rorden et al., 2012). The
segmentation-normalization steps were: 1) mirror image from T1 scan around the midline, 2)
create a chimeric image using native T1 scan with replacing lesion tissue from mirrored image,
and 3) reform the chimeric image in standard space using SMP12 software with segmentation
normalization (Ashburner & Friston 2005). The normalized lesion map was then binarized
using a 50% probability threshold and grey and white matter segmented into 384 homotopic
regions based on the Atlas of Intrinsic Connectivity of Homotopic Areas (AICHA) (Joliot et
al., 2015).
DTI: Parcellated lesion maps were first coregistered to the DTI images and lesion sites
were masked out from DTI images. Next, the DTI images were coregistered with the native
T1 images and normalized based on non-diffusion images using FSL (FMRIB Software
Library), FMRIB (Functional MRI of the Brain), and Linear Image Registration Tool. The
normalized DTI images were then parcellated using the AICHA atlas regions of interest. The
tractography to determine the white matter streamline connectivity between two gray matter
regions (FMRIB Diffusion Toolbox) (Behrens et al., 2007). Distribution of diffusion per voxel
and probability of distribution for each possible white matter streamline were computed using
probtrackX and FDT BEDPOST. The probabilistic tractography map excluding the stroke
lesion were used to compute the structural connectivity between each possible pair of ROIs as
the number of streamlines connecting each pair. This process was performed for all seeds
(ROIs) and lead to creating connectivity matrix Xij in which i,j each represent as seed. The
weighted connectivity between i ROI and j ROI (in both directions) were computed by total
distance travelled and by total number fiber tract between ROIs divided by total volume of
areas in these ROIs (Bonilha et al., 2014).
3.3.3. Neuroimaging measures
Damage was measured by quantifying Lesion Volume as the percent of lesioned
voxels relative to the total number of voxels in each ROI.
Disconnection was measured by computing Connectivity Bias as the normalized
difference between DTI tracks (T) connecting each pair of ROIs in the left and right
hemispheres, where:
3.4. Robotic Assessment
3.4.1. Apparatus
A KINARM Endpoint Lab robotic device was used to assess motor performance (Fig.
2A). Participants grasped two handles, which allowed them to make hand movements in the
horizontal plane to interact with visual stimuli projected into the same plane as their hands.
A B
Figure 3.1 Robotic apparatus and task. Images of the KINARM robot (A) and Object Hit task (B).
3.4.2. Task
Participants performed a bimanual object hitting task, Object Hit, in which they used
5m wide virtual paddles attached to each hand to hit away 2 cm diameter red circles (n=300)
that moved towards them from the top of the workspace (Fig. 2B). The goal of the task was to
hit away as many red circles as possible. The task started with a single slow-moving circle and
the number of circles and their movement speed increased over time. The task lasted a little
3.4.3. Robotic measures
Task performance was measured by computing Target Hits as the percent of targets
that were successfully hit during the entire task.
Motor impairment was measured by computing Hand Speed Bias as the normalized
difference in the average speed (S) of right- and left- hand movements, where:
Hand Speed Bias = (SR − SL) / (SR + SL)
Visuospatial impairment was measured by computing Miss Bias as the normalized
difference in the number of targets missed (M) on the left and right sides of the workspace.
Miss Bias = (MR − ML) / (MR + ML)
3.5. Analysis
3.5.1. Sensorimotor Network
We examined a sensorimotor network comprised of eight cortical subnetworks and 30
ROIs from the AICHA atlas (Table 1). Brain areas of the eight cortical regions are displayed
in Figure 3.
3.5.2. Independence of behavioral measurements
Relationships between behavioral measurements (Hypothesis 1) was examined between task performance, motor impairment and visuospatial impairment. Correlations was
Table 3.1 List of motor network of 30 ROIs within eight cortical regions
Figure 3.2 Sensorimotor network comprised of eight distinct subnetworks.PM: Premotor, M: Motor, SS: Somatosensory, SPL: Superior Parietal, IPS: Intraparietal Sulcus, SMA: Supplementary Motor Area, PCu: Precuneus, Po: Superior parieto-occipital cortex.
Subnetwork Subnetwork
15 Superior Frontal Sulcus-5-L 109 Intraparietal Sulcus-1-L 17 Superior Frontal Sulcus-6-L 111 Intraparietal Sulcus-2-L 25 Middle Frontal Gyrus-4-L 113 Intraparietal Sulcus-3-L 27 Middle Frontal Gyrus-5-L 115 Intraoccipital Sulcus-1-L
53 Precentral Sulcus-2-L 223 Supplementary Motor Area Gyrus-2-L 57 Precentral Sulcus-4-L 225 Supplementary Motor Area Gyrus-3-L 61 Precentral Sulcus-6-L 273 Precuneus Gyrus-5-L
65 Rolando Sulcus-2-L 275 Precuneus Gyrus-6-L 67 Rolando Sulcus-3-L 277 Precuneus Gyrus-7-L 73 Postcentral Sulcus-2-L 279 Precuneus Gyrus-8-L 75 Postcentral Sulcus-3-L 287 Parietooccipital Sulcus-3-L 79 Superior Parietal Gyrus-2-L 291 Parietooccipital Sulcus-5-L 81 Superior Parietal Gyrus-3-L 293 Parietooccipital Sulcus-6-L
83 Superior Parietal Gyrus-4-L 295 Cuneus Gyrus-1-L
85 Superior Parietal Gyrus-5-L 297 Cuneus Gyrus-2-L
Superior parieto-occipital cortex Po Intraparietal sulcus IPS Supplementary motor area SMA
Superior Parital
SPL
Precuneus PCu
ROIs Name ROIs Name
3.5.3. Independence cortical damage and disconnection
Relationships between cortical damage and disconnection (Hypothesis 2) was examined on ROIs that have at least 5% damage in nine or more participants. Correlations was
performed on the average Lesion Volume and Connectivity Bias of theROIs in each of the
eight subnetworks. In order to compute the Connectivity Bias for each subnetwork, the
Connectivity Bias of each ROI in each subnetwork with all other ROIs was averaged (29).
3.5.4. Lesion-symptom mapping
To address Hypotheses 3-5, we examined relationships between cortical damage and
robotic measures of motor impairment (Hypothesis 3), visuospatial impairment (Hypothesis 4) and task performance (Hypothesis 5) using ROI-based lesion symptom mapping (RLSM) on each of the 30 ROIs that has at least 5% damage in nine or more participants. Correlations
was computed between: 1) Lesion Volume and Hand Speed Bias, 2) Lesion Volume and Miss
Bias, and 3) Lesion Volume and Target Hits. Correlation coefficients was converted to z-scores
using Fisher’s r-to-z transform and correlations was considered significant at a threshold z
-score of 2.144, which corresponds to an r2 = 0.10 (r = 0.32).
We also examined relationships between cortical disconnection and robotic measures of motor impairment (Hypothesis 3), visuospatial impairment (Hypothesis 4) and task performance (Hypothesis 5) using connectome-based lesion-symptom mapping (CLSM) on all 435 ROI-pairs in the sensorimotor network. Correlations was computed between: 1)
Connectivity Bias and Hand Speed Bias, 2) Connectivity Bias and Miss Bias, and 3)
significant at a threshold z-score of 2.144, which corresponds to an r2 = 0.10 (r = 0.32). Data
visualization was carried out using SurfIce and Circro.
Learning from previous studies, for both lesion-based and connectome-based analyses
we used a conservative threshold of about 20% (5% damage in nine or more participants across
the sample size) to assure we only keep regions that are informative. (Yourganov and Rorden,
CHAPTER 4
RESULTS
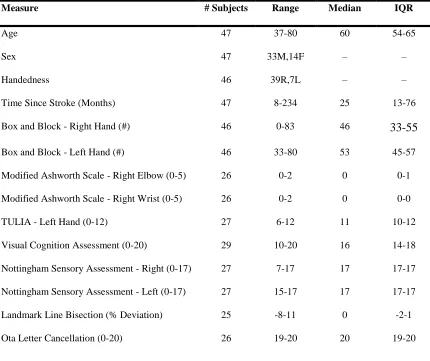
4.1. Participant characteristics
Behavioral assessment was performed on 57 stroke survivors. Ten stroke survivors
were excluded because they failed to meet our inclusion and exclusion criteria. A summary
of demographic and clinical data for the remaining 47 participants is provided in Table 4.1
Table 4.1 Summary of Demographic and clinical Data.
Measure # Subjects Range Median IQR
Age 47 37-80 60 54-65
Sex 47 33M,14F – –
Handedness 46 39R,7L – –
Time Since Stroke (Months) 47 8-234 25 13-76
Box and Block - Right Hand (#) 46 0-83 46 33-55
Box and Block - Left Hand (#) 46 33-80 53 45-57
Modified Ashworth Scale - Right Elbow (0-5) 26 0-2 0 0-1
Modified Ashworth Scale - Right Wrist (0-5) 26 0-2 0 0-0
TULIA - Left Hand (0-12) 27 6-12 11 10-12
Visual Cognition Assessment (0-20) 29 10-20 16 14-18
Nottingham Sensory Assessment - Right (0-17) 27 7-17 17 17-17
Nottingham Sensory Assessment - Left (0-17) 27 15-17 17 17-17
Landmark Line Bisection (% Deviation) 25 -8-11 0 -2-1
Stroke Impact Scale - Strength (0-20) 45 7-20 14 13-16
Stroke Impact Scale – Hand Function (0-25) 45 5-25 21 17-25
Stroke Impact Scale - Mobility (0-45) 45 25-80 41 35-44
4.2. Lesion volume of participants
Figure 4.1 shows an overlay of the average mean lesion volume of the 47 participants. The lesion overlay shows that Postcentral Sulcus-3-L, Intraparietal
Sulcus-1-L, Intraparietal Sulcus-2-Sulcus-1-L, Superior Parietal Gyrus-4-L had the highest lesion volumes
with close to 20% damage, on average.
Figure 4.1.Lesion overlay in standard space from all participants. The colored regions exhibit the percent of lesion among the 47 participants.as yellow color represented the highest lesion volume % across all sample and dark red represented the lowest Lesion volumes %.
4.3. Relationships between behavioral measurements
To examine relationships between task performance, motor impairment and
but we did observe a significant correlation between Target Hits and Hand Speed Bias
(Figure 4.2C).
4.4. Relationships between cortical damage and disconnection
To examine the relationship between cortical damage and disconnection (Hypothesis 2), we computed correlations between mean Lesion Volume and mean Connectivity Bias in the eight sensorimotor subnetworks. We observed moderate to strong correlations in the premotor,
motor, somatosensory, superior parietal, intraparietal sulcus, precuneus subnetworks (Figure 4.3). However, we did not observe correlations in supplementary motor area and superior parietooccipital cortex.
4.5. Relationships between cortical damage and motor impairment
To examine the relationships between cortical damage and motor impairment
(Hypothesis 3), we computed correlations between Lesion Volume and Hand Speed Bias. We
observed weak negative correlations between Lesion Volume and Hand Speed Bias in the motor subnetwork (Rolando Sulcus 2L, Rolando Sulcus 3L) and somatosensory subnetworks
(Postcentral Sulcus 2L, Postcentral Sulcus 3L) (Figure 4.4), but none of the 30 ROIs surpassed
the threshold z-score of 2.144.
4.6. Relationships between cortical disconnection and motor impairment
To examine the relationships between cortical disconnection and motor impairment
(Hypothesis 3), we computed correlations between Connectivity Bias and Hand Speed Bias
significant connections involved the premotor, motor, supplementary motor, somatosensory,
and intraparietal subnetworks (Figure 4.6).
4.7. Relationships between cortical damage and visuospatial impairment
To examine the relationships between cortical damage and visuospatial impairment
(Hypothesis 4), we computed correlations between Lesion Volume and Miss Bias. Two ROIs
within the intraparietal network (Intraparietal Sulcus 2L, Intraoccipital Sulcus 1L) had
correlations that surpassed the threshold z-score of 2.144 (Figure 4.7).
4.8. Relationships between cortical disconnection and visuospatial impairment
To examine the relationships between cortical disconnection and visuospatial
impairment (Hypothesis 4), we computed correlations between Connectivity Bias and Miss
Bias (Figure 4.8). We observed 19 different connections that surpassed the threshold z-score
of 2.144. Each of the eight subnetworks had at least one significant connection and all of the
subnetworks except for the motor and somatosensory subnetworks had at least three significant
connections (Figure 4.8C,D).
4.9. Relationships between cortical damage and task performance
To examine the relationships between cortical damage and task performance
(Hypothesis 5), we computed correlations between Lesion Volume and Target Hits. Six ROIs
within the motor, somatosensory, superior parietal and precuneus subnetworks had correlations
A B C
Figure 4.2Relationships between behavioral measures
4.10. Relationships between cortical disconnection and task performance
To examine the relationships between cortical disconnection and task performance
(Hypothesis 5), we computed correlations between Connectivity Bias and Target Hits (Figure
4.10). We observed 43 different connections that surpassed the threshold z-score of 2.144.
Each of the eight subnetworks had at least one significant connection and all of the subnetworks
except for the precuneus and superior parietooccipital subjects had at least five significant
connections (Figure 4.10C,D). Together with the preceding relationships between cortical
damage and task performance (see 4.7), our results show that global task performance was
A B
C D
E F
A B
Figure 4.4 Relationships between cortical damage and motor impairment.Scatter plots showing
A B
C
Figure 4.5 Relationships between cortical disconnection and motor impairment. Scatter plots
A
B
Figure 4.6 Connectome of correlations between cortical damage and motor impairment. A, Whole-brain connectome showing all connections with significant correlations between
A B
C
Figure 4.7 Relationships between cortical damage and visuospatial impairment. A,B, Scatter plots
A B
C
D
A B C
D
Figure 4.9 Relationships between cortical damage and task performance. A-C, Scatter plots
showing correlations between Lesion Volume and Target Hits for Rolando Sulcus 2L (A), Rolando Sulcus 3L (B), and Postcentral Sulcus 2L (C). Lines show corresponding linear regression lines. D,
A
B
C
D
E
Figure 4.10 Relationships between cortical disconnection and task performance. A-C, Scatter plots showing correlations between Connectivity Bias and Target Hits for frontoparietal connections.
CHAPTER 5
DISCUSSION
5.1. Prediction of motor outcomes from cortical damage and disconnection
Integrating ROI-based and connectivity-based lesion-symptom mapping methods has
the unique potential to answer questions about brain and behavior relationships. Coupling
neuroimaging with robotic technology has further helped us to understand neurobiology of
motor system. The aim of this study was to investigate the relationships between sensorimotor
function and brain lesion and structural connectivity within sensorimotor cortex of individuals
with stroke. Our results confirm that cortical damage and disconnection are complementary
factors that can be used to predict sensorimotor deficits after stroke.
As expected, our results showed that deficits in task performance were associated with
damage to several sensorimotor, cortical regions, including regions within our Motor (Rolando
2-L, Rolando 3-L), Somatosensory (Postcentral 2-L, Postcentral
Sulcus-3-L), Superior Parietal (Superior Parietal Gyrus-4-L), and Precuneus (Precuneus Gyrus-5-L)
subnetworks. These findings complement previous studies linking superior parietooccipital
cortex and anterior precuneus with reaching movements. (Kertzman et al., 1997; Gallivan et
al., 2015) We also found that visuospatial impairments were associated with damage to our
Intraparietal subnetwork (Intraparietal Sulcus-2-L, Intraoccipital Sulcus-1-L). Previous studies
have highlighted that Intraparietal Sulcus plays an important role in processing visual
Our study revealed that motor impairment, visuospatial impairment and task
performance were strongly associated with cortical disconnection of several regions. Cortical
disconnection between Supplementary Motor Area and Somatosensory Cortex was
significantly associated with both motor impairment and task performance. Previous studies
have found that Supplementary Motor Area plays a crucial role in coordination and
synchronization of bimanual movements and exerting control over voluntary actions involving
response selection (Walsh et al., 2008; Nachev et al., 2007). Moreover, other studies have
found that connectivity and integrity of Supplementary Motor Area can affect motor function
of the upper extremities (Peters et al., 2018). Effective connectivity between Supplementary
Motor Area and Primary Motor Cortex may play a crucial role in performing motor tasks
(Bajaja et al., 2015). In addition, Hand Speed Bias has been shown to be an excellent for
quantifying asymmetries in reaching movement (Tyryshkin et al. 2014). Therefore, our results
support previous studies and confirm that Hand Speed Bias is an excellent measure of bimanual
coordination in the Object Hit task. Our findings also explain the association between
disconnection of Supplementary Motor Area and deficits in task performance. Since overall
task performance requires a distinct circuit of brain regions to execute and control the
movement, the role of retaining intact connectivity of Supplementary Motor Area with Motor
Cortex (Rolando Sulcus) and Somatosensory Cortex (Postcentral Sulcus) may be critical for
retaining high levels of motor performance.
We observed that disruption of structural connectivity of Superior Parietal Gyrus with
Motor Cortex (Rolando Sulcus), Somatosensory Cortex (Postcentral Sulcus) and Premotor
with Parietooccipital Sulcus was strongly associated with visuospatial impairments. These
findings provide support to the premise that the Superior Parietal Cortex and Intraparietal
Sulcus work together to support purposeful actions like reaching and grasping by processing
visual information about the position and motion of objects (Peters et al., 2015). Our findings
also are in agreement with previous studies which have observed lower functional connectivity
of visuospatial networks with decreased executive control in stroke patients compared to
healthy adults (Almeida et al., 2017).
We studied the relationship between cortical damage and disconnection in the motor
network. Although our processing controlled for direct effects of lesions on connectivity, we
observed that lesion volumes within the Premotor, Motor, Somatosensory, Superior Parietal,
Intraparietal subnetworks were significantly correlated with disconnection of corresponding
cortical regions. This confirms that damage to brain regions is linked to a reduction in structural
connectivity of the region. Although brain cortical damage is associated with disconnection,
dynamic alterations in structural connectivity of brain regions could exist in regions distant
from lesion location. These cortical regions which are intact but actually exhibit reduced
structural connectivity may contribute to functional impairments and clinical symptoms and
affect recovery after stroke (Bonilha et al., 2014). Our observation in the ROI-based and
connectome-based analyses support the findings that damage to Motor Cortex (Rolando
Sulcus) was strongly correlated with motor impairments (Figure 4.4B). However,
disconnection of Motor Cortex (Rolando Sulcus) and Supplementary Motor Area had
moderate correlation with motor impairments (Figure 4.5A). In addition, damage to Premotor
Cortex (Precentral Sulcus-4-L) was not correlated with motor impairments, although
Sulcus-2-L) Cortex was strongly correlated with motor impairments (Figure 4.5B) Furthermore, we
found that damage to Intraparietal Cortex (Intraoccipital Sulcus-1-L, Intraparietal Sulcus-1-L)
was strongly associated with visuospatial impairments (Figure 4.6A,B). Disconnection of
these two regions was also strongly correlated with visuospatial impairments. However,
disconnection of Intraoccipital Sulcus-1-L and Parietooccipital Sulcus-6-L had only a weak
correlation with Miss Bias (Figure 4.7A,B). These observations suggest that cortical
disconnection may be a better predictor of functional motor impairment and should be included
in lesion-symptom mapping studies. Several studies have indicated that post-stroke motor
impairment is associated with lesion size (Schiemanck et al., 2006; Page et al., 2013; Sterr et
al., 2014). However, recent studies have demonstrated that lesion volume alone is not a good
predictor of chronic motor impairment after the stroke, and that cortical disconnection can help
explain some of the variability in limb-motor function (Peters et al., 2018). These results are in
line with our findings, which showed that disconnection is stronger factor in identifying
functional impairments.
We found Miss Bias was not significantly correlated with either Hand Speed Bias or
Target Hits. However, Target Hits and Hand Speed Bias were highly correlated (Figure 4.2).
This supports the notion that Miss Bias and Hand Speed Bias and Target Hits are independent
measures (Tyryshkin et al. 2014). This may reflect that Target Hits is more dependent on Hand
Speed Bias than Miss Bias. However, this may also reflect a lack of variability in Miss Bias
scores due to the fact that we only included subjects with left-sided damage, whereas
5.2. Limitations
This study has several limitations that need to be considered. First, damage to ROIs
was widely dispersed within our sensorimotor network. There were few lesions to certain brain
regions such as Supplementary Motor Area and Superior Parietooccipital Cortex in our sample.
Therefore, we did not include several ROIs in our ROI-based lesion-symptom mapping
analysis. Second, we only included cortical regions because of difficulties performing
tractography due to challenges performing accurate normalization of subcortical regions.
Obviously, subcortical regions such as the basal ganglia, cerebellum, and thalamus are greatly
involved in motor control, but were not included in our study. Third, limitations of DTI
tractography, such as the possibility of regions with fiber complexity and crossing, may have
influenced the current results. Lastly, since this study was part of a larger study with sample of
individual with speech and language impairments, the majority of participants had minimal
motor impairment. Future studies with a boarder distribution of motor impairments will enable
better examination of the effects of structural damage and disconnection on motor
performance.
5.3. Future directions
The results of this study showed the importance of investigating brain damage and
cortical disconnection in motor network in chronic stroke. Cortical disconnection is a
complementary factor to brain lesion that contributes to the severity of motor impairments and
impacts the recovery after stroke. Understanding the mechanisms of brain reorganization and
structural alteration after stroke can provide more insight into post-stroke recovery and
post-stroke recovery. This will assist with the identification of patients with greater potential for
recovery and with selecting the best appropriate interventions for individual patient based on
their structural brain connectome and damage. Future research should also include the
application of innovative treatments such as transcranial magnetic stimulation to examine the
training-induced neural plasticity and potential changes in functional and structural
R
EFERENCESAchilles, E. I., Weiss, P. H., Fink, G. R., Binder, E., Price, C. J., & Hope, T. M. (2017). Using
multi-level Bayesian lesion-symptom mapping to probe the body-part-specificity of gesture
imitation skills. NeuroImage, 161, 94-103.
Almeida, S. R. M., Vicentini, J., Bonilha, L., Campos, B. M., Casseb, R. F., & Min, L. L. (2017).
Brain connectivity and functional recovery in patients with ischemic stroke. Journal of
Neuroimaging, 27(1), 65-70.
Asai, T., Sugimori, E., & Tanno, Y. (2010). Two agents in the brain: motor control of unimanual
and bimanual reaching movements. PloS One, 5(4), e10086.
Ashburner, J., & Friston, K. J. (2005). Unified segmentation. Neuroimage, 26(3), 839-851.
Bajaj, S., Butler, A. J., Drake, D., & Dhamala, M. (2015). Brain effective connectivity during
motor-imagery and execution following stroke and rehabilitation. NeuroImage: Clinical, 8,
572-582.
Bates, E., Wilson, S. M., Saygin, A. P., Dick, F., Sereno, M. I., Knight, R. T., & Dronkers, N.
F. (2003). Voxel-based lesion–symptom mapping. Nature neuroscience, 6(5), 448.
Behrens, T. E. J., Johansen-Berg, H., Woolrich, M. W., Smith, S. M., Wheeler-Kingshott, C. A.
M., Boulby, P. A., & Thompson, A. J. (2003). Non-invasive mapping of connections between
Behrens, T. E., Berg, H. J., Jbabdi, S., Rushworth, M. F., & Woolrich, M. W. (2007).
Probabilistic diffusion tractography with multiple fiber orientations: What can we gain?
Neuroimage, 34(1), 144-155.
Bohannon RW, Smith MB. (1987). Interrater reliability of a modified Ashworth scale of muscle
spasticity. Physical therapy, 67, 206-207.
Bonilha, L., Nesland, T., Rorden, C., Fillmore, P., Ratnayake, R. P., & Fridriksson, J. (2014).
Mapping remote subcortical ramifications of injury after ischemic strokes. Behavioural
neurology, 2014.
Chen, J. L., & Schlaug, G. (2013). Resting state interhemispheric motor connectivity and white
matter integrity correlate with motor impairment in chronic stroke. Frontiers in neurology, 4,
178.
Cisek, P., & Kalaska, J. F. (2010). Neural mechanisms for interacting with a world full of action
choices. Annual review of neuroscience, 33, 269-298.
Coderre, A. M., Zeid, A. A., Dukelow, S. P., Demmer, M. J., Moore, K. D., Demers, M. J., ...
& Bagg, S. D. (2010). Assessment of upper-limb sensorimotor function of subacute stroke
patients using visually guided reaching. Neurorehabilitation and neural repair, 24(6), 528-541.
Connell, L. A., Lincoln, N. B., & Radford, K. A. (2008). Somatosensory impairment after
stroke: frequency of different deficits and their recovery. Clinical rehabilitation, 22(8), 758-767.
Corbetta, M., Ramsey, L., Callejas, A., Baldassarre, A., Hacker, C. D., Siegel, J. S., et al. (2015).
Davare, M., Kraskov, A., Rothwell, J. C., & Lemon, R. N. (2011). Interactions between areas
of the cortical grasping network. Current opinion in neurobiology, 21(4), 565-570.
Duncan P, Wallace D, Lai S, Johnson D, Embretson S, Laster L. (1999). The stroke impact
scale version 2.0.: Evaluation of reliability, validity, and sensitivity to change. Stroke, 30,
2131-2140.
Einav, O., Geva, D., Yoeli, D., Kerzhner, M., & Mauritz, K. H. (2011). Development and
validation of the first robotic scale for the clinical assessment of upper extremity motor
impairments in stroke patients. Topics in stroke rehabilitation, 18, 587-598.
Findlater, S. E., Desai, J. A., Semrau, J. A., Kenzie, J. M., Rorden, C., Herter, T. M., et al.
(2016). Central perception of position sense involves a distributed neural network–Evidence
from lesion-behavior analyses. Cortex, 79, 42-56.
Frey, S. H., Fogassi, L., Grafton, S., Picard, N., Rothwell, J. C., Schweighofer, N., et al. (2011).
Neurological principles and rehabilitation of action disorders: computation, anatomy, and
physiology (CAP) model. Neurorehabilitation and neural repair, 25, 6S-20S.
Hagmann, P., Cammoun, L., Gigandet, X., Meuli, R., Honey, C. J., Wedeen, V. J., & Sporns,
O. (2008). Mapping the structural core of human cerebral cortex. PLoS biology, 6(7), e159.
Handy, T. C., Borg, J. S., Turk, D. J., Tipper, C. M., Grafton, S. T., & Gazzaniga, M. S. (2005).
Placing a tool in the spotlight: spatial attention modulates visuomotor responses in cortex.
Gallivan, J. P., & Culham, J. C. (2015). Neural coding within human brain areas involved in
actions. Current opinion in neurobiology, 33, 141-149.
Georgopoulos, A. P., Kalaska, J. F., & Massey, J. T. (1981). Spatial trajectories and reaction
times of aimed movements: effects of practice, uncertainty, and change in target location.
Journal of Neurophysiology, 46(4), 725-743.
Geyer, S., Matelli, M., Luppino, G., & Zilles, K. (2000). Functional neuroanatomy of the
primate isocortical motor system. Anatomy and Embryology, 202(6), 443-474.
Gleichgerrcht, E., Fridriksson, J., Rorden, C., & Bonilha, L. (2017). Connectome-based
lesion-symptom mapping (CLSM): a novel approach to map neurological function. NeuroImage:
Clinical, 16, 461-467.
Harvey M, Milner AD, Roberts RC. (1995). An investigation of hemispatial neglect using the
Landmark Task. Brain and Cognition, 27, 59-78.
Jaeger, L., Marchal-Crespo, L., Wolf, P., Riener, R., Michels, L., & Kollias, S. (2014). Brain
activation associated with active and passive lower limb stepping. Frontiers in human
neuroscience, 8, 828.
Joliot, M., Jobard, G., Naveau, M., Delcroix, N., Petit, L., Zago, L., et al. (2015). AICHA: an
atlas of intrinsic connectivity of homotopic areas. Journal of neuroscience methods, 254, 46-59.
Kantak, S., Jax, S., & Wittenberg, G. (2017). Bimanual coordination: A missing piece of arm
Kertzman, C., Schwarz, U., Zeffiro, T. A., & Hallett, M. (1997). The role of posterior parietal
cortex in visually guided reaching movements in humans. Experimental Brain Research, 114(1),
170-183.
La Fougere, C., Zwergal, A., Rominger, A., Förster, S., Fesl, G., Dieterich, M., et al. (2010).
Real versus imagined locomotion: a [18F]-FDG PET-fMRI comparison. Neuroimage, 50(4),
1589-1598.
Lee, M. H., Shin, Y. I., Lee, S. H., Cha, Y. J., Kim, D. Y., Han, B. S., & You, S. H. (2015).
Diffusion tensor imaging to determine the potential motor network connectivity between the
involved and non-involved hemispheres in stroke. Bio-medical materials and engineering, 26,
S1447-S1453.
Lim, J. S., & Kang, D. W. (2015). Stroke connectome and its implications for cognitive and
behavioral sequela of stroke. Journal of stroke, 17(3), 256.
Lincoln NB, Jackson JM, Adams SA. (1998). Reliability and revision of the Nottingham
sensory assessment for stroke patients. Physiotherapy, 84, 358-365.
Lindenberg, R., Renga, V., Zhu, L. L., Betzler, F., Alsop, D., & Schlaug, G. (2010). Structural
integrity of corticospinal motor fibers predicts motor impairment in chronic stroke. Neurology,
74(4), 280-287.
Makris, N., Kennedy, D. N., McInerney, S., Sorensen, A. G., Wang, R., Caviness Jr, V. S., &
Pandya, D. N. (2004). Segmentation of subcomponents within the superior longitudinal fascicle
Marteniuk, R. G. (1987). Constraints on human arm movement trajectories. Canadian Journal
of Psychology, 41, 365.
Martin, M., Dressing, A., Bormann, T., Schmidt, C. S., Kümmerer, D., Beume, L., et al. (2016).
Componential network for the recognition of tool-associated actions: evidence from
voxel-based lesion-symptom mapping in acute stroke patients. Cerebral Cortex, 27(8), 4139-4152.
Mathiowetz V, Volland G, Kashman N, Weber K. (1985). Adult norms for the Box and Block
Test of manual dexterity. Am J Occ Ther, 39, 386-91.
Nachev, P., Coulthard, E., Jäger, H. R., Kennard, C., & Husain, M. (2008). Enantiomorphic
normalization of focally lesioned brains. Neuroimage, 39(3), 1215-1226
Nasreddine, Z. S., Phillips, N. A., Bédirian, V., Charbonneau, S., Whitehead, V., Collin, I., et
al. (2005). The Montreal Cognitive Assessment, MoCA: a brief screening tool for mild
cognitive impairment. Journal of the American Geriatrics Society, 53(4), 695-699.
Oldfield, R. C. (1971). The assessment and analysis of handedness: the Edinburgh inventory.
Neuropsychologia, 9(1), 97-113.
Ota H, Fujii T, Suzuki K, (2001). Dissociation of body-centered and stimulus-centered
representations in unilateral neglect. Neurology.;57:2064-2069
Page, S. J., Gauthier, L. V., & White, S. (2013). Size doesn't matter: cortical stroke lesion
volume is not associated with upper extremity motor impairment and function in mild, chronic
Peters, D. M., Fridriksson, J., Stewart, J. C., Richardson, J. D., Rorden, C., Bonilha, L., & Fritz,
S. L. (2018). Cortical disconnection of the ipsilesional primary motor cortex is associated with
gait speed and upper extremity motor impairment in chronic left hemispheric stroke. Human
brain mapping, 39(1), 120-132.
Peters, S., Handy, T. C., Lakhani, B., Boyd, L. A., & Garland, S. J. (2015). Motor and
visuospatial attention and motor planning after stroke: considerations for the rehabilitation of
standing balance and gait. Physical therapy, 95(10), 1423-1432.
Proto, D., Pella, R. D., Hill, B. D., & Gouvier, W. (2009). Assessment and rehabilitation of
acquired visuospatial and proprioceptive deficits associated with visuospatial neglect.
NeuroRehabilitation, 24(2), 145-157.
Rehme, A. K., Eickhoff, S. B., Rottschy, C., Fink, G. R., & Grefkes, C. (2012). Activation
likelihood estimation meta-analysis of motor-related neural activity after stroke. Neuroimage,
59(3), 2771-2782.
Reinkensmeyer, D. J., Emken, J. L., & Cramer, S. C. (2004). Robotics, motor learning, and
neurologic recovery. Annu. Rev. Biomed. Eng., 6, 497-525.
Rorden, C., Bonilha, L., Fridriksson, J., Bender, B., & Karnath, H. O. (2012). Age-specific CT
and MRI templates for spatial normalization. Neuroimage, 61(4), 957-965
Rorden, C., Karnath, H. O., & Bonilha, L. (2007). Improving lesion-symptom mapping. Journal
Schiemanck, S. K., Post, M. W. M., Witkamp, T. D., Kappelle, L. J., & Prevo, A. J. H. (2005).
Relationship between ischemic lesion volume and functional status in the 2nd week after middle
cerebral artery stroke. Neurorehabilitation and neural repair, 19(2), 133-138.
Schulz, R., Koch, P., Zimerman, M., Wessel, M., Bönstrup, M., Thomalla, G., ... & Hummel,
F. C. (2015). Parietofrontal motor pathways and their association with motor function after
stroke. Brain, 138(7), 1949-1960. doi: 10.1093/brain/awv100
Scott, S. H. (2004). Optimal feedback control and the neural basis of volitional motor control.
Nature Reviews Neuroscience, 5(7), 532.
Scott, S. H., Dukelow, S. P. (2011). Potential of robots as next-generation technology for clinical
assessment of neurological disorders and upper-limb therapy. Journal of rehabilitation research
and development, 48(4), 335.
Schulz, R., Braass, H., Liuzzi, G., Hoerniss, V., Lechner, P., Gerloff, C., & Hummel, F. C.
(2015). White matter integrity of premotor–motor connections is associated with motor output
in chronic stroke patients. Neuroimage: Clinical, 7, 82-86. doi: 10.1016/j.nicl.2014.11.006
Shadmehr, R., & Mussa-Ivaldi, F. A. (1994). Adaptive representation of dynamics during
learning of a motor task. Journal of Neuroscience, 14(5), 3208-3224
Singh T, Fridriksson J, Perry C, Tryon SC, Ross A, Fritz S, Herter TM. A novel computational
model to probe visual search deficits during motor performance. J Neurophysiol, 117, 79-92,
Sterr, A., Dean, P. J., Szameitat, A. J., Conforto, A. B., & Shen, S. (2014). Corticospinal tract
integrity and lesion volume play different roles in chronic hemiparesis and its improvement
through motor practice. Neurorehabilitation and neural repair, 28(4), 335-343.
Stinear, C. M., Barber, P. A., Smale, P. R., Coxon, J. P., Fleming, M. K., & Byblow, W. D.
(2006). Functional potential in chronic stroke patients depends on corticospinal tract integrity.
Brain, 130(1), 170-180.
Takakusaki, K. (2017). Functional neuroanatomy for posture and gait control. Journal of
movement disorders, 10(1), 1.
Tyryshkin, K., Coderre, A. M., Glasgow, J. I., Herter, T. M., Bagg, S. D., Dukelow, S. P., &
Scott, S. H. (2014). A robotic object hitting task to quantify sensorimotor impairments in
participants with stroke. Journal of neuroengineering and rehabilitation, 11(1), 47.
Wahl, M., Lauterbach-Soon, B., Hattingen, E., Jung, P., Singer, O., Volz, S., et al. (2007).
Human motor corpus callosum: topography, somatotopy, and link between microstructure and
function. Journal of Neuroscience, 27(45), 12132-12138.
Walsh, R. R., Small, S. L., Chen, E. E., & Solodkin, A. (2008). Network activation during
49
APPENDIX
A-TABLES
OF
LESION
SYMPTOM
MAPPING
RESULTS
Significant results of correlational analysis of cortical damage and behavioral measurements are showed in these two tables. Numbers in the tables represent the Fisher z-scores. Threshold z-score of 2.144 was considered as significant.
Table A.1 Lesion symptom mapping results of behavioral measurements
Behavioral Measurements ROI 15 ROI 17 ROI 25 ROI 27 ROI 53 ROI 57 ROI 61 ROI 65 ROI 67 ROI 73 ROI 75 ROI 79 ROI 81 ROI 83 ROI 85
Target Hits 0.00 0.59 0.00 0.00 1.13 1.75 0.00 2.281* 2.745* 2.463* 2.328* 1.62 1.61 2.277* 2.11
Hand Bias
Speed 0.00 0.45 0.10 0.23 1.22 0.34 0.00 1.80 1.89 1.66 1.71 0.06 0.59 0.57 0.28
Miss Bias 0.00 0.00 0.87 0.31 0.00 0.00 0.00 0.13 0.62 0.86 0.72 1.53 1.22 1.15 1.12
Behavioral Measurements ROI 109 ROI 111 ROI 113 ROI 115 ROI 223 ROI 225 ROI 273 ROI 275 ROI 277 ROI 279 ROI 287 ROI 291 ROI 293 ROI 295 ROI 297
Target Hits 1.57 1.48 2.07 1.26 0.00 0.00 2.205 0.00 0.00 0.00 0.00 0.00 0.00 0.00 0.00
Hand Bias
Speed 1.09 0.77 1.10 1.10 0.00 0.00 0.00 0.00 0.00 0.00 0.00 0.00 0.00 0.00 0.00