University of South Carolina
Scholar Commons
Theses and Dissertations
5-2017
Cost and Fuel Usage Optimization of Activating
Solution Based Silica Fume Geopolymer Concrete
Lateef Najeh AssiUniversity of South Carolina
Follow this and additional works at:https://scholarcommons.sc.edu/etd
Part of theEngineering Education Commons
This Open Access Thesis is brought to you by Scholar Commons. It has been accepted for inclusion in Theses and Dissertations by an authorized administrator of Scholar Commons. For more information, please [email protected].
Recommended Citation
Cost and fuel usage
optimization of activating solution based silica fume geopolymer concrete
by
Lateef Najeh Assi
Bachelor of Science Basrah University, 2008
Master of Science Basrah University, 2011
________________________________________________
Submitted in Partial Fulfillment of the Requirements
For the Degree of Master of Science in
Engineering Management
College of Engineering and Computing
University of South Carolina
2017
Accepted by:
Paul Ziehl, Director of Thesis
Charles Pierce, Reader
Edward Deaver, Reader
Kealy Carter, Reader
© Copyright by Lateef Najeh Assi, 2017 All Rights Reserved.
DEDICATION
To my parents, for their endless love, support, and encouragement, to my uncle
Saad Shiaa for his invaluable advice and support, to Dr. Kealy Carter for her invaluable
support and encouragement, and to my professor at the University of South Carolina and
ACKNOWLEDGMENTS
I would like to express my deepest appreciation to my advisor Dr. Paul Ziehl for
his guidance, patience, and support. Your support was essential to my success here. I
would like to thank my reader members, Dr. Charles Pierce, and Mr. Edward Deaver, and
Dr. Kealy Carter for their invaluable advice and help throughout my research. My
gratitude also extends to my friends and coworkers. Much of my experimental work
would not have been completed without your assistance.
I owe my deepest gratitude to my parents, for their endless love, support, and
encouragement. No words can describe my love to you both.
I would like to express my tremendous gratitude to my uncle and godfather Saad
Shiaa. You inspired me when I was a child, and guide, encourage me whole my life.
Without you, I would not have done anything throughout my life. The words are not
enough to describe how much grateful for you I am.
I would also like to thank Mr. Deaver for all his support throughout my research.
Without you, I cannot achieve my thesis. I am looking to extend my work in future with
you.
I would like to thank my dearest friend Kim Ngan Tran for her invaluable
friendship and support in difficult times and my fellow graduate students for their
At last, I would like to thank the members of my department, Civil and
Environmental Engineering Department, and the faculty, staff, and students that made my
ABSTRACT
Development of sustainable construction materials has been the focus of research
efforts worldwide in recent years. Concrete is a major construction material; hence,
finding alternatives to ordinary Portland cement is of extreme importance due to high
levels of carbon dioxide emissions associated with its manufacturing process.
Geopolymer concrete is a potential solution; however, concerns about the high cost and
the low real fuel energy efficiency are obstacles against its increase in the market share.
In this thesis, the current cost and fuel (thermal energy) usage are calculated. In
addition, the cost and fuel usage were optimized based on previous experimental results.
The results show that geopolymer concrete cost can be reduced using Portland cement in
low percentage replacement (5-35%). The required fuel usage (thermal energy) for
producing geopolymer concrete was lower than Portland cement. Using Portland cement
and reducing sodium hydroxide concentration not only reduce the cost of geopolymer
concrete but also reduce the fuel usage. Based on the results of the study, the sodium
hydroxide and silica fume have a significant role in the fuel usage and the cost. Three
new mixtures were proposed to reduce the cost. Additionally, the fuel usage was 30%
lower than Portland cement. Marketing and communication plans showed that
geopolymer concrete industries could be profitable because geopolymer concrete can be
The best locations to start the business were proposed, including some cities in the
north east or east of the United States such as Cleveland, Milwaukee, and Charlotte.
Internationally, China was considered the best place to start the business due to the
TABLE OF CONTENTS
Dedication ...iii
Acknowledgments...iv
Abstract...vi
List of tables...x
List of figures...xii
Chapter 1: Introduction...1
Chapter 2: Background of coal combustion products...6
Chapter 3: Materials availability and energy costs...14
3.1. Fly ash...15
3.2. Sodium hydroxide...17
3.3. Silica fume...18
Chapter 4: Materials and methods...25
4.1. Activating solution...26
4.2. Casting and curing ...27
Chapter 5: Results and discussion...30
5.1. Calculation of energy requirements and predicted cost for the standard mix and corresponding Portland cement compressive strength...32
Chapter 6: Marketing and communication plans...55
6.1. Brief introduction ...56
6.2. Situation analysis...57
6.3. Strategic insights...61
6.4. Marketing research...71
6.5. Financials and forecasts...74
Chapter 7: Conclusions and future work...80
7.1. Conclusions...81
7.2. Future work...82
References...83
LIST OF TABLES
Table 2.1 - Coal combustion and its materials descriptions [60-63] ...…...11
Table 3.1 - Mixture proportions...21
Table 3.2 - Sodium hydroxide properties [78]...22
Table 3.3 - Physical properties of silica fume [79]...22
Table 4.1 - Required energy for 100 and 106 MPa (Standard mix) compressive strength of Portland and geopolymer concrete...29
Table 5.1 - Mix design for 100 MPa compressive strength of concrete [71] ...42
Table 5.2 - Required energy for 100 and 106 MPa compressive strength of Portland and geopolymer concrete (Standard mix)...42
Table 5.3 - Raw materials price...43
Table 5.4 – Seven-days compressive strength, cost and fuel usage of geopolymer concrete due to changing sodium hydroxide concentration ...43
Table 5.5 – Seven-days compressive strength, cost and fuel usage of geopolymer concrete due to changing the external heat ...43
Table 5.6 – Seven-days compressive strength, cost, and fuel usage of partially replaced geopolymer concrete...44
Table 5.7 - Required energy for 70 MPa compressive strength of Portland ...44
Table 5.8 - Required energy for 69 MPa compressive strength of geopolymer concrete ...44
Table 5.9 - Mixture proportions for mix 6-8 ...45
Table 6.1 - Green and Portland cement companies…………...76
LIST OF FIGURES
Figure 2.1 - Coal combustion productions and utilizations [65] ….….……...12
Figure 2.2 - Coal reserves worldwide [65] ...12
Figure 2.3 - Coal – fired power plants in the United States [58] ...13
Figure 2.4 - Map of most coal plants in the United States [59] ...13
Figure 3.1 - Fly ash production process...23
Figure 3.2 - Fly ash producer price index (PPI) [84] ...23
Figure 3.3 - Sodium hydroxide production process ...23
Figure 3.4 – Sodium hydroxide producer price index (PPI) [84] ...24
Figure 3.5 - Silica fume production process ...24
Figure 5.1 - Fuel (Thermal energy) usage...47
Figure 5.2 - Cost of geopolymer and Portland cement concrete...47
Figure 5.3 - Optimizing fuel (Thermal energy) usage by sodium hydroxide concentration...48
Figure 5.4 - Optimizing the cost of geopolymer sodium hydroxide concentration...48
Figure 5.5 - Optimizing thermal usage of geopolymer by changing external heat …...49
Figure 5.6 - Optimizing cost of geopolymer by changing external heat ………...49
Figure 5.7 - Effect of Portland cement replacement on fuel usage of geopolymer concrete...50
Figure 5.8 - Effect of Portland cement replacement on cost of geopolymer concrete...50
Figure 5.10 - Cost of 15 % replaced Portland cement geopolymer concrete
versus Portland cement concrete...51
Figure 5.11 - Thermal energy for mix 6-8 and their corresponding Portland cement...52
Figure 5.12 - Cost of mix 6-8 and their corresponding Portland cement mixes...53
Figure 5.13 - Compressive strength versus cost for mix 6-8 and their corresponding Portland cement mixes...54
Figure 6.1 - Points of parity and differences (green and conventional concrete companies) ...77
Figure 6.2 - Pricing strategy...77
Figure 6.3 - Green Cement Company logo ...78
Figure 6.4 - Global Portland cement market from year 1998 to 2020 ...79
CHAPTER 1
Numerous amounts of Portland cement concrete are produced annually. For
instance, around ten billion metric tons of concrete are produced worldwide and over 500
million tons in the United States alone [1]. In other words, two tons of conventional
concrete were produced in the United States, for each family consisting of a man,
woman, and child. The Portland cement production is predicted to be around two billion
tons by 2050, in the United States alone, which means it is four times higher than the
level in 1990 [2]. Nowadays, Portland cement factories are responsible for 7% of total
worldwide CO2 emissions [3]. It has been stated that each ton of Portland cement
produces approximately one ton of CO2 [4]. This extraordinary amount of cement and
CO2 emissions has elevated global awareness and prompted scientists to think about
alternative, sustainable concrete and cement options.
Geopolymer concrete and cement is a sustainable product. It is a mixture of
aluminate silicate source materials such as fly ash, blast furnace slag or metakaolin, and
an activating solution including either sodium silicate, sodium hydroxide [5-8], or silica
fume, sodium hydroxide and water [9]. Geopolymer concrete has been shown to have
good resistance against sulfate attack and acid, high early and final compressive strength,
and high resistance to fire, in the presence of external heat [10-18]. Recently, good
Geopolymer concrete can be considered as an alternative concrete product to
conventional concrete because it not only reduces CO2 emissions [20], but it also utilizes
waste materials such as fly ash.
Several research projects have been conducted to investigate the effect of
sodium hydroxide concentration on the mechanical and chemical properties of
geopolymer concrete. Chindaprasirt and Chalee studied the effect of sodium hydroxide
concentration on chloride penetration and steel corrosion of fly ash based geopolymer
concrete. Both chloride penetration and corrosion were decreased when sodium
hydroxide increased [21]. The compressive strength and reaction products were found to
be strongly related to sodium hydroxide concentration [22-25]. Other researchers found
the setting time, conductivity, porosity, slump, flexural strength, and tensile strength were
improved when sodium hydroxide concentration increased. As described above, several
tests have been conducted to investigate the effect of sodium hydroxide on varied
chemical and mechanical properties [26-28], while its effect on the cost and fuel (thermal
energy) usage has not been investigated with different sodium hydroxide concentrations.
Although much research has been dedicated to omitting the use of external
heat in the geopolymer concrete curing and aging periods, external heat still plays a
dominant role in geopolymer concrete production. For instance, many researchers have
investigated geopolymer concrete performance at ambient conditions [29-32]. It has been
discovered that early compressive strength, elastic modulus, and flexural strength
properties were reduced when the elevated external heat was removed [29]. The ambient
curing conditions accompanied with moisture curing showed early compressive strength
strength and initial setting time were improved when a small proportion of ordinary
Portland cement was used [31]. The bond strength of geopolymer concrete at ambient and
elevated temperatures was investigated, and the result showed bonding strength was
decreased at an ambient curing temperature [32]. Mechanical and structural properties,
fracture behavior, the role of microwave radiation, thermal behavior, compressive
strength and transport properties of geopolymer concrete, mortar or paste were
investigated. The results showed that the geopolymer concrete behaved better when the
external heat was applied [33-45]. On the other hand, there is no specific research
investigating the effect of elevated heat on the cost of geopolymer concrete and fuel
(thermal usage) energy in the United States.
The cost and CO2 emissions, the latter of which are related to the energy
consumption of the raw materials and geopolymer production, have been investigated
worldwide by few researchers. McLellan et al. have investigated cost and carbon
emissions, in Australia, for geopolymer paste in comparison with Portland cement; the
cost was 93-139%, while a 44-64% reduction in greenhouse gas emissions was achieved
in comparison with Portland cement [46]. Compared to Portland cement, some
researchers have claimed that there is slightly less carbon emissions, but others have
claimed it is higher in the case of geopolymer where concrete was used [47, 48].
However, their assumptions are suspicious because the external heat was assumed to be
primary, and the CO2 emissions of sodium silicate was not calculated correctly [49]. It
was shown that 80% of the total cost of geopolymer was contributed by the activating
55-designs have been proposed to reduce the cost of geopolymer concrete, and the marketing
and communication plans have not been discussed.
In this thesis, fly ash-based geopolymer concrete, specifically with an
activating solution that is a combination of silica fume, sodium hydroxide, and water, will
be the main focus. Cost and fuel (thermal energy) usage will be calculated based on the
current data. The case studies will be held mainly in the United States. The effect of
sodium hydroxide, external heat on the cost and fuel (thermal energy) usage of fly
ash-based geopolymer concrete will be assessed. Based on the observed results, new mix
designs will be introduced for reducing the cost and fuel usage of geopolymer concrete.
Eliminating the need for external heat will be tackled. In addition, marketing and
communication plans will be set depending on the estimated price and availability of raw
CHAPTER 2
The primary use of coal is to fuel electric power stations. It is considered the
primary energy source in many large countries. For example, the percentage of energy
which comes from coal is 79% in China, 69% in India, and 49% in the United States [52].
As a result, the total coal combustions worldwide are 780 million metric tons per year.
Only 53% of the total coal combustion products are utilized globally, and the rest will go
to the disposal sites, which are usually at an electric power station. Figure 2.1 shows the
coal combustion products and their utilization per year worldwide. From Figure 2.1, in
China, which is the top coal producer, the coal ash combustion production is around 400
million tons per year, and the utilization is around 270 million tons, which means 130
million tons are not utilized. The annual United States coal combustion production is
around 120 million tons, and the utilization is around 55 million tons [65].
Some studies have shown that coal usage for producing energy will be
increased due to two reasons: cost and widely distributed coal reserves. The cost of coal
is estimated to be the lowest cost among energy sources including wind, natural gas, and
nuclear energy. Peabody Energy incorporation states that the energy produced by coal is
estimated to be 15-50% less costly than wind energy, 25%-45% less than natural gas, and
15% less than nuclear energy [53]. Coal reserves are widely distributed in developed
countries unlike other energy resources such as natural gas and oil, which are
Figure 2.2 shows coal reserves for the Unites States and other countries [55].
With more than 220 billion metric tons, the United States has numerous amount of coal
reserves. This vast amount of coal reserves leads to the fact that coal will be one of the
main energy sources for more than the next hundred years into the future. Unfortunately,
fly ash production in the United States has had some shortages in recent years due to the
federal government’s regulations for reducing CO2 emissions. However, based on the
most recent interview with Dr. Adams Thomas, who is executive director of the
American Coal Ash Association (ACAA), the future of fly ash is secure and its
production will increase [76]. The price of natural gas will increase; hence, coal will be
dispatched at a higher rate. In addition, most of the coal plants are well-equipped to meet
government regulations, which will increase the fly ash productions again [76].
In the United States, coal combustion products’ rate of utilization to
production is roughly around 40% [56]. The American Coal Ash Association (ACAA)
reported in 2012 that only 44.5% of the fly ash and 38.8% of the bottom ash production
were utilized [56]. In addition, the Electric Power Research Institute (EPRI) showed that
60% of the coal ash products are kept in disposal sites in the United States [57]. Disposal
sites have a potential impact on humans, animals, and the environment.
By assuming the yearly production rate of 110 million metric tons, and a
disposal rate of 60%, a rough, simple calculation shows the amount of disposal coal
combustion products that have been stored since 1971 until the current time. Therefore,
the stored fly ash would be at least 2970 metric tons. As shown in Figure 2.2, the United
amount of discarded coal combustion products should raise awareness about finding an
objective way, such as geopolymer concrete, to utilize these products. Figure 2.3 and
Figure 2.4 show the United States map of coal power plants [58, 59]. These maps can
help to predict where most of these products will be deposited, and they are helpful to
predict the best location for constructing geopolymer concrete industries. As shown in
Figures 2.3 and 2.4, most of the coal combustion products are concentrated in the
Northeast and Midwest (East North Central) areas of the United States including
Wisconsin, Michigan, Illinois, Indiana, and Ohio.
The coal combustion products are a combination of fly ash, bottom ash, flue
gas, and boiler slag. Table 1.1 explains each product briefly, and shows their percentage
as well [60-63]. With 57% of fly ash and 17% of bottom ash, it seems the majority of the
coal combustion products is fly ash, with bottom ash coming in second [62]. Therefore,
focusing on the fly ash and bottom ash will help to reduce coal combustion disposal.
The coal combustion products are usually deposited in a landfill or an
impoundment close to electric power station sites. There are more than six hundred
electric power station sites around the United States. There are some environmental
issues related to coal combustion disposals such as leaching of mercury into the soil,
windblown ash, and radioactivity. For example, according to the problem related to coal
combustion waste in Tennessee in December 2008. Tennessee Valley Authority’s
(TVA’s) Kingston plant released 1.1 billion gallons of coal fly ash slurry (toxic waste)
into the soil [63]. More than 300 acres was damaged and there were negative effects on
homes and prosperity. In addition, the toxic waste was released to the neighboring river
In conclusion, there is a huge amount of coal combustion products, are stored
and disposed of in the United States. These products have a potential risk on humans,
animals, and plants because the toxic materials and fly ash will effect them if it was
stored in underground or it stored outside (on the ground). Because coal ash combustion
products are continuously increasing and there are already massive amounts disposed
amounts, geopolymer concrete becomes one of the potential solutions. It not only utilizes
such waste materials, it also converts them to useful products. The only concern for the
geopolymer concrete is the cost and required thermal energy in comparison with Portland
cement. The issue of the cost and thermal energy will be addressed in this thesis, as well
as finding the dominant material’s effect on the of cost fuel usage; hence, finding and
Tables:
Table 2.1 Coal combustion and its materials descriptions [60-63]
Waste Type Description
Percentage of Total Generated
Fly Ash
A product of burning finely ground coal in a boiler to produce electricity. It is generally captured in the plant’s chimney or stack through a particulate control device (e.g., electrostatic precipitators or fabric filters). It consists mostly of silt-sized and clay-sized glassy spheres, giving it a consistency somewhat like talcum powder. 57% Flue Gas Desulfurization (FGD) Material
Flue gas desulfurization (FGD) is a chemical process implemented in order to meet emission requirements in the Clean Air Act applicable to sulfur dioxide (an emission associated with acid rain). The goal of the process is to chemically combine the sulfur gases released in coal combustion by reacting them with a sorbent, such as limestone (calcium carbonate), lime (calcium oxide), or ammonia. Depending on the FGD process used at the plant, the material may be a wet sludge or a dry powder. The wet sludge is likely predominantly calcium sulfite or calcium sulfate. The dry material generally consists of a mixture of sulfites and sulfates.
24%
Bottom Ash
A coarse, gritty material, these agglomerated ash particles are those that are too large to be carried in flue gases. They impinge on the furnace walls or fall through open grates to an ash hopper at the bottom of the furnace. The material is taken from the bottom of the boiler furnace either in its dry form or as a slurry (via the addition of water). It has a porous surface structure and is coarse, with grain sizes spanning from fine sand to fine gravel.
17%
Boiler Slag
This type of ash collects at the base of certain furnaces that are quenched with water. When molten slag comes in contact with quenching water, it fractures, crystallizes, and forms pellets. This boiler slag material is made up of hard, black, angular particles that have a smooth, glassy appearance. The particles are uniform in size, hard, and durable, with a resistance to surface wear.
Figures:
Figure 2.1 Coal combustion productions and utilizations [65]
Figure 2.2 Coal reserves worldwide [65]
0 100 200 300 400 500 600 700 800 900
Australia Cananda China Europe India Japan United
States Of America Russian Federation Worldwide M il li o n m e tr ic t o n s/ y e a r
Coal combustion production & utilization
Production Utilization
0 50 100 150 200 250 300 United States
Russia China India Australia &
Figure 2.3 Coal – fired power plants in the United States [58]
CHAPTER 3
In this section, we will see how the raw material sources including fly ash type F,
silica fume, sodium hydroxide, coarse and fine aggregate, are used to produce the fly
ash-based geopolymer concrete. My research shows that the materials used for fabrication of
the fly ash-based geopolymer concrete (FGC) products include fly ash type F (ASTM
C618) [64], silica fume, and sodium hydroxide will be introduced in this section. The
activating solution (sodium hydroxide mixed with silica fume) preparation, casting and
curing process will be explained in the next section.
3.1. Fly ash
The major coal combustion products include about 85% fly ash, less than 15%
bottom ash, and between 1-2% cenospheres. The annual coal combustion product
production in the United States is around 118 million metric tons. Only 49.7 million
metric tons are utilized, which is only 42.1% of produced materials [65]. Therefore, 51.9
% of fly ash is either dumped in the ground or stored outside. The stored fly ash has
potential effects on the health of humans, animals, and plants. In addition, some of the
stored underground fly ash may mingle with the groundwater, which may cause other
negative effects. Therefore, it benefits everyone to make use of the coal combustion
products. Due to high demand and production, high fly ash volume concrete is one of the
potential solutions. In Table 3.1, it is clear that fly ash-based geopolymer concrete usually
consists of 21% fly ash based geopolymer concrete weight. Figure 3.1 describes the fly
Fly ash-based geopolymer concrete is a 100 percent fly ash replacement. It can be
considered the fly ash utilization solution. It is recommended that fly ash-based
geopolymer concrete industries are to be close to the fly ash sources because it will not
only reduce the necessary cost for transportation, but it also reduces CO2 due to
transportation itself. On the East coast, the fly ash suppliers are distributed in North
Carolina, Georgia, West Virginia, Massachusetts, Ohio, Tennessee, South Carolina, and
Maryland [66]. All of them are producing Class F fly ash. Consequently, it is highly
recommended to be the home of the fly ash concrete product industries. No process
energy and non-energy emissions are attributed to the fly ash production because it is the
byproduct of coal combustion for electrical power stations [67]. As a result, the process
of fuel (thermal energy) usage and CO2 emissions are assumed to be zero. The current
cost of fly ash (Type F) is around $35.0/ton, and it will be used throughout the research.
The producer price index (PPI) is shown in Figure 3.2 [84]. It demonstrates that
fly ash price has decreased since 2012; however, the fly ash price gets higher by the end
of 2015. The reason for this increase will be explained in the upcoming pages because the
fly ash production in the United States has experienced shortages in recent years due to
the federal government’s regulations for reducing CO2 emissions. However, based on the
most recent interview with Dr. Adams Thomas, who is executive director of the
American Coal Ash Association (ACAA), there are two reasons the future of fly ash is
secure [76]. First, the price of natural gas will increase; hence, coal will be dispatched at
a higher rate. The second reason is that most of the coal plants are well-equipped to meet
3.2. Sodium hydroxide
Sodium hydroxide (commonly known as caustic soda) is an inorganic material,
which is white, solid, and highly caustic. It is produced in 50% (by mass) approximately
saturated solution with water. The primary usage of sodium hydroxide is in pulp, paper,
drinking water, soap, and drain cleaner. It was reported that the production of sodium
hydroxide is around 60 million tons every year; however, the demand is around 51
million tons per year [77]. Physical properties are shown in Table 2.3. Sodium hydroxide
is produced as white flakes, pellets, and as a solution. The reaction of sodium hydroxide
with water is exothermic, and produces a large amount of heat [78].
Sodium hydroxide flakes are used to enhance the chemical reaction of fly ash. By
looking at Table 3.1, mix 1, the maximum sodium hydroxide weight ratio to the binder
including fly ash based silica fume concrete materials is 2.6%. The average compressive
strength of this mix, when Wateree fly ash is used, is 106 MPa (15,400 psi) [9]. There are
three methods to produce sodium hydroxide, including membrane cells, mercury cells,
and diaphragm cells. Most of the United States production uses membrane and
diaphragm cells. The most efficient method is membrane cells. Its energy efficiency is
around 63% less than the theoretical minimum. Around three-quarters of the United
States sodium hydroxide production comes by the diaphragm process. The rest comes
mostly from the membrane method [67]. The United States’ average production of
sodium hydroxide is 11.2 million tons/year, while the total worldwide production is 44.0
million tons/year in 2004, (now the sodium hydroxide production is around 60.0 million
for the production of sodium hydroxide is around 20.5 MJ/kg [69]. Figure 3.3 shows the
sodium hydroxide production process.
Sodium hydroxide is usually produced in 50% concentration with water. The
main method that is used for its production is the chloralkali process. The top worldwide
producers are the United States, Europe, and Japan, respectively. The main producing
companies in the United States are Dow Chemical Company in Texas and Louisiana,
Oxychem, Pioneer Companies, and PPG [78]. The average current price of sodium
hydroxide with 50% concentration is around $580/ton in the United States, while in
China it can be found for around ($250-$300)/ton with 25 tons as a minimum shipment.
In this thesis, the price used in the calculation of geopolymer concrete cost is based on
the price in the United States, which is considered the most expensive compared to other
international producers. The producer price index (PPI) for sodium hydroxide is shown in
Figure 3.4 [84]. It shows that the price of sodium hydroxide had a jump in 2009;
however, it became steady after 2011. The reason attributed to the price jump is the
economic crises in 2008.
3.3. Silica fume
The American Concrete Institute (ACI) defines the silica fume by “very fine non-
crystalline silica produced in electric arc furnaces as a by-product of the production of
elemental silicon or alloys containing silicon.” [79]. Silica fume is a byproduct which
comes from the manufacture of ferrosilicon alloys or silicon. The collection procedure,
which is used in the United States, is the dependent procedure. Silica fume, commonly
Therefore, it is a highly effective material due to the large surface area. The primary
utilization of silica fume is in concrete. it can reduce durability, bleeding, and segregation
of Portland cement concrete. Including silica fume in the Portland cement mixture
improves the compressive and bonding strength as well as abrasion resistance [79]. Silica
fume consists of 80-97% of silicon dioxide (SiO2), and less than 1% of calcium oxide
(CaO). Table 2.3 shows the physical properties of silica fume.
There are three other names of silica fume that are used in some scientific
societies as follows:
• Condensed silica fume
• Microsilica
• Volatilized silica
The silica fume production is around 300,000 metric tons [80]. The main source
of the silica fume comes from ferrosilicon. The silica fumes come as a byproduct due to
capturing furnace off-gases. Ferrosilicon is generally used in the production of steel, as
an alloying agent. The secondary production of silica fume is in the aluminum and
chemical industries [80]. The Environmental Protection Agency (EPA) regulations have
been enforced in the ferrosilicon industries requiring the collection of silica fume instead
of pumping it in the air due to potential risks to living organisms. The production of these
materials is expected to increase due to high demands of steel, iron, and alloys; hence, the
silica fume productions will increase as well. The utilization of silica fumes in concrete
applications has been encouraged for not only improving the quality of concrete
Due to the fact that silica fume is a byproduct and cannot be produced without
production of correlated products such as silicon in the case of silica fume, the silica
fume’s carbon dioxide emissions and the required production energy will not be
considered in the calculations in this research. Therefore, the required energy will be
zero. Figure 3.5 describes the silica fume production process. The current average price
of silica fumes in the United States markets is around $640/metric ton, while it is around
$182/metric ton in China. In this research, the price of silica fume was based on the
Tables:
Table 3.1 Mixture proportions
Concrete type Fly ash (type F), kg/m3 (lb/ft3)
Portland cement replacement, % Water, kg/m3 (lb/ft3)
w/b ratio
Sodium hydroxide,
kg/m3
(lb/ft3)
Silica fume, kg/m3 (lb/ft3)
Compressive strength, MPa (psi) SD Mix 1: silica fume based activating solution 474
(29.6) 0.00
163
(10.2) 0.28
61.6 (3.81) 46.2 (2.91) 106 (15,400) 4.96 (720) Mix 2: silica fume based activating solution 474
(29.6) 0.00
163
(10.2) 0.28
61.6 (3.81) 46.2 (2.91) 27.2 (3,940) 2.14 (310) Mix 3: Silica fume based activating solution 450
(29.6) 5.00
163
(10.2) 0.28
61.6 (3.81) 46.2 (2.91) 53.3 (7,730) 1.72 (250) Mix 4: silica fume based activating solution 427
(29.6) 10.0
163
(10.2) 0.28
61.6 (3.81) 46.2 (2.91) 57.4 (8,320) 2.07 (300) Mix 5: silica fume based activating solution
403 15.0 163
(10.2) 0.28
61.6 (3.81) 46.2 (2.91) 68.5 (9,930) 1.65 (240)
Table 3.2 Sodium hydroxide properties [78]
Physical properties
Chemical formula NaOH
Molar mass 40.0 g mol−1
Appearance White, waxy, opaque crystals
Density 2.13 g/cm3
Melting point 318 °C (604 °F; 591 K) Boiling point 1,390 °C (2,530 °F; 1,661 K)
Table 3.3 Physical properties of silica fume [79]
Physical properties of silica fume
Particle size (typical) < 1 μm
Bulk density (as-produced) (densified)
130 to 430 kg/m3 480 to 720 kg/m3
Specific gravity 2.2
Figures:
Figure 3.1 Fly ash production process
Figure 3.2 Fly ash producer price index (PPI) [84]
Figure 3.3 Sodium hydroxide production process
Fly Ash Collection
Power Station
Time (year)
P
ro
d
u
ce
r
p
ri
ce
i
n
d
ex
(
P
P
I)
Sodium Hydroxide Collection
Figure 3.4 Sodium hydroxide producer price index (PPI) [84]
Figure 3.5 Silica fume production process
P
ro
d
u
ce
r
p
ri
ce
i
n
d
ex
(
P
P
I)
Time (year)
CHAPTER 4
In this section, the alternative activating solution which is a mixture of sodium
hydroxide, silica fume, and water, will be the main focus. The required energy and cost
will be calculated based on the available data in the United States of America. In
addition, the cost and fuel (thermal energy) usage will be optimized and assessed based
on some previous studies such as Assi, et al. [70], and some of the new mix designs will
be introduced. Because the Portland and geopolymer concretes have approximately the
same amount and type of coarse and fine aggregate, the course and fine aggregate cost
and their associated thermal energy will not be considered.
A number of materials are required to produce one cubic meter (m3) of
geopolymer or Portland cement concrete and, will be considered the base values in the
comparison. The reference compression strength for geopolymer concrete for heated and
unheated cured samples is 106 MPa (15,400 psi) and 64.3 MPa (9,330 psi), respectively
[9, 70]. For the Portland cement, the compressive strength reference will be chosen
according to the compressive strength of geopolymer concrete samples mentioned above.
The assumed ambient condition in the lab will be 21.0 0C [69.8 0F].
4.1. Activating solution
Sodium hydroxide flakes were dissolved in water and stirred manually. The silica
fume powder was then added and stirred for two minutes. The mixing of silica fume with
The activating solution was kept in an enclosed container in an oven at 75 ⁰C (167
⁰F) for 12 hours to assure that the sodium hydroxide flakes and silica fume powder were
completely dissolved. Providing a well-isolated container will reduce the required energy
for keeping the temperature around 75 ⁰C [176 ⁰F], as well as reducing the corresponding
CO2 emissions. Due to the fact that the reaction of sodium hydroxide and water and the
addition of silica fume is an exothermic reaction with more than 75 ⁰C [176 ⁰F], the
required energy to elevate the activating solution from 21 0C [70 0F] to the 75 ⁰C [176 ⁰F]
will be disregarded. The required amount of activating solution is around 100L,
Assuming the height equals double the diameter, its surface area is 1.25 m2. As a
result, the required energy for maintaining the isolated tank under 75.0 0C [176 ⁰F] for 24
hours in 21.0 0C [69.8 0F], with a height equals two times of diameter, is 5.80 MJ/100L
[81].
4.2. Casting and curing
The dry ingredients (fly ash, fine aggregates, and coarse aggregates) were mixed
for three minutes. The activating solution, which includes the water, was then added to
the dry mixture and mixed for five minutes. For the silica fume based activating solution
geopolymer cement, the specimens were left in ambient condition for two days and then
heated for two days in an oven at 75.0 ⁰C (167 ⁰F) [17] in the case of heat cured samples.
According to Tempest, et al., the required heat for raising the sample with one cubic
meter size from 21.00C [70 0F] to 75.0 0C [167 0F], is 103 MJ/m3 [81]. By assuming the
are 2.60 MJ/ h. Therefore, the required energy for maintaining the sample under 75.0 ⁰C
(167 ⁰F) for 48 hours is 126 MJ/m3. Table 4.1 shows the required energy values.
Due to the similarity between the geopolymer and Portland cement mixing
procedure, the required energy (labor and mixing machine) for mixing is disregarded for
Tables:
Table 4.1 The required energy for 100 and 106 MPa (Standard mix) compressive strength of Portland and geopolymer concrete
Raw materials Amount, kg/m3 (lb/ft3) Required energy, GJ
Cement Type I, 475 (29.8) 2.35
Silica fume 46.2 (2.91) 0.00
Fly ash (type F) 474 (29.6) 0.00
Sodium hydroxide 61.6 (3.81) 1.26
Curing under
75.00C for 48 hrs ---- 0.13
Heat of activating solution (1670F)
---- 0.05
Heat the concrete to 750C
(1670F)
---- 0.10
Total required energy, Portland cement
---- 2.35
Total required energy, Portland cement, Geopolymer
CHAPTER 5
The source of energy consumption which is required to produce geopolymer
concrete will be due to sodium hydroxide production, the activating solution preparation,
and external heat for curing if it is presented. The required energy for fly ash and silica
fume as explained earlier will not be taken into consideration because they are byproduct
materials. The required energy for transportation will be considered and evaluated in
future work according to the available data of the product source and assumed
geopolymer industry sites. The cost of geopolymer concrete will be calculated depending
on the local price of raw materials. The material costs are most likely to vary with the
offer and the request. The cost of transportations will vary as well due to the amount
ordered and gas price variation. Therefore, the cost will be calculated depending on the
average and most expected value.
Because the cost and amount of both the fine and coarse aggregates in
geopolymer concrete and Portland concrete are the same, they will not be calculated into
the cost of geopolymer and Portland cement concrete. CO2 emissions of Portland and
geopolymer concrete will be evaluated in future work. However; required energy (fuel
usage) will give a reasonable indication of CO2 emissions due to the geopolymer concrete
production. The superplasticizer cost will be left out due to relatively low cost compared
with other materials. The compared functional unit will be one m3 of concrete with 106
MPa (15,400 psi) [9] in the case of using elevated heat, and 1 m3 of 57.4 MPa (8,320 psi),
The cost and fuel (thermal energy) usage of the required paste to make one m3 of
geopolymer or Portland cement concrete will be calculated and compared in this section.
5.1. Calculation of energy requirements and predicted cost for the standard
mix and corresponding Portland cement compressive strength
In this section, the energy requirements are calculated. The compressive strength
will be based on the experimental results of Assi, et al. [9]. The seven-day compressive
strength as shown in Table 3.1 is 106 MPa (15,400 psi) in the presence of external heat
for two days. The 90% compressive strength was achieved in less than seven days.
Accordingly, a similar compressive strength is chosen for Portland cement concrete based
on the Portland Cement Association (PCA) book [71]. The mix design is shown in Table
5.1. The CO2 emissions, fuel usage requirements for transportation, fuel usage for fly ash,
and fuel usage for silica fume were considered. The coarse and fine aggregate cost and
energy canceled due to the similarities between geopolymer and Portland cement
concrete.
As shown in Table 5.2, the required amount of Portland cement to make one m3 is
475 kg. The necessary energy for producing 475 kg of Portland cement with 100 MPa
(14,500 psi) compressive strength, calculated according to the Energy Consumption
Benchmark Guide: Cement Clinker Production [72], was 2.35/m3 GJ. On the other hand,
according to the standard mix in Table 3.1, the energy consumption required for
producing one m3 of geopolymer concrete with 106 MPa (15,400 psi) was around 1.5
GJ/m3. The necessary fuel energy for producing geopolymer concrete is 36 % less than
preferred sign from the CO2 emissions standpoint when geopolymer concrete is
compared with Portland cement. Figure 5.1 shows the comparison between geopolymer
and Portland cement from the fuel (thermal energy) usage standpoint.
On the other hand, the costs of silica-based activating geopolymer and Portland
cement were calculated based on the current price of raw materials. The costs may
fluctuate depending on the demanded and provided amounts in the marketplace. Because
the amount and type of aggregates are the same for both geopolymer and Portland cement
concrete, the cost will be left. In addition, the labor costs will be eliminated due to the
slightly smaller difference between geopolymer and Portland cement concrete, and they
have little effect on the final cost. The estimated current price of raw materials is shown
in Table 5.3. As shown in the equations below, the estimated standard mix cost of
geopolymer concrete was $118, while the estimated cost of Portland cement was $98.1.
The difference in the cost is 17%. As shown in Figure 5.1 and 5.2, the sodium hydroxide
cost and fuel usage play dominant roles in the cost and fuel energy of geopolymer
concrete.
Geopolymer concrete helps in reduction of required energy by 36% in comparison
with Portland cement. The fuel (thermal energy) usage will reflect on the CO2 emissions
reduction. Furthermore, geopolymer concrete utilizes waste materials such as fly ash and
slag. All of the desired properties make geopolymer concrete more desirable than other
concrete types from an environmental standpoint even though it is costly. The
performance of geopolymer concrete against sulfate attack, fire resistance, and harsh
weather conditions is superior in comparison with Portland cement concrete. These facts
The following equations are for calculating the cost of geopolymer and Portland
cement:
Cost of Portland = wt. PC*cost PC +wt. of SF*cost SF……..………..………..1
Cost of Portland = 0.475*105.5 + 0.075*640 = $ 98.11 / ton
Cost of geopolymer = wt. fly ash*cost FA+wt. SH *2*(50%)*cost SH+wt. SF*cost
SF………...………..2
Cost of geopolymer = 0.474*35 + 0.0616*2*580 + 0.0462*640 = $ 117.6 / ton
Where,
wt. = weight of FA = fly ash SF = silica fume SH = sodium hydroxide PC = Portland cement
5.2. Optimization of the cost and fuel usage of geopolymer concrete
In this section, optimizing the cost and fuel energy of geopolymer concrete will be
the main focus. Based on the previous section, the cost of sodium hydroxide and fuel
usage has the main determining factor of the total cost of geopolymer concrete. In
addition, the major fuel usage of geopolymer concrete comes from sodium hydroxide.
The dominant factors on the cost and energy requirements will be based on the
experimental results published recently by Assi et al. in 2016 [70] due to the similarities
in the activating solution which is a mixture of silica fume, sodium hydroxide, and water.
The effect of eliminating the practical barriers, such as external heat, on the cost, thermal
energy usage, and customer needs will be examined. As shown in Figures 5.1 and 5.2,
sodium hydroxide plays a dominant part in the fuel usage and cost as well. For instance,
sodium hydroxide concentration while keeping the same or an acceptable level of
performance from an engineering standpoint.
In addition, external heat has a lower effect on the cost and thermal energy usage
of geopolymer cement, in comparison with sodium hydroxide. For example, the fuel
energy effect is 8.6 % of the total fuel energy of geopolymer cement. However, the
absence of external heat is essential from an engineering applications standpoint.
Geopolymer cement, which needs external heat to be cured, cannot be used in civil
engineering applications such as sidewalks, highways, and dam masonry. Therefore, in
these applications eliminating external heat is significant.
5.2.1. Effect of sodium hydroxide concentration on cost and fuel usage
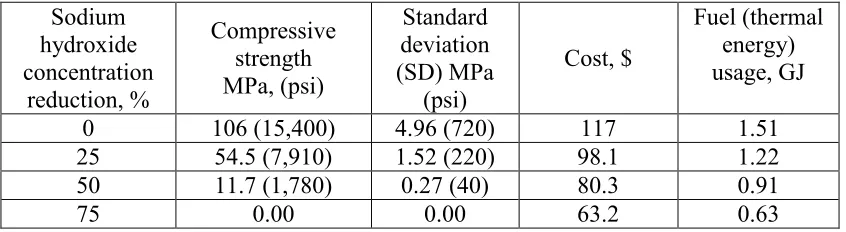
In Assi et al. [70]’s experimental work, sodium hydroxide concentration was
reduced by 25, 50 and 75 % respectively in comparison with the mixture proportion in
Table 3.1, in the presence of external heat. The compressive strength, as shown in Table
5.4, was 106 MPa (15,3800 psi), 54.5 MPa (7900 psi), 11.7 MPa (1,700 psi), and 0 for 0,
25, 50 and 75% sodium hydroxide reduction. The cost and thermal fuel energy usage are
shown in Figure 5.3 and 5.4. By considering the zero-sodium hydroxide reduction as a
reference, the cost was reduced by 16%, 33% and 47% when sodium hydroxide was
reduced by 25%, 50%, and 75%.
Additionally, the energy usage was reduced by 20%, 40%, and 60% when sodium
hydroxide was reduced by 25%, 50%, and 75% respectively. Table 5.4 shows the
estimated cost and fuel usage for the sodium hydroxide concentration reductions. The
results prove that sodium hydroxide should be the main target to reduce the price and fuel
5.4. The partial Portland cement replacement may solve this problem due to the extra
calcium hydroxide which will be presented when the hydration process takes place as
explained by the literature [70].
5.2.2. Effect of external heat on the cost and thermal energy
In this section, the effect of external heat on the cost and fuel (thermal energy)
usage will be investigated. As shown in Table 5.5 and Figure 5.5, the cost was not
affected due to eliminating the external heat cost. The percentage of external heat to the
total fuel usage is 8.4%. As shown in Figure 5.6, the effect of external heat on the curing
process seems low. When the external heat is eliminated, the total energy usage was 8.5%
less in comparison with the case of external heat. Therefore, the effect of external heat
plays a low role in cost and fuel usage.
However, in several engineering applications, eliminating the use of external heat
plays a critical role in an engineer’s decision to use the geopolymer concrete. For
example, external heat cannot be provided for some engineering applications such as
sidewalks, shoulders, and highway construction. In the presence of external heat,
geopolymer usage will be dedicated to precast and prestressed applications including
5.2.3. Effect of Portland cement replacement on the cost and fuel thermal
energy
In this section, the effect of Portland cement replacement on the fuel (thermal
energy) usage, cost, and compressive strength of geopolymer concrete is investigated. A
comparison is made between geopolymer concrete and Portland cement concrete based
on the corresponding compressive strength. The experimental results are lent from a
previous experimental work conducted by Assi, et al. [70]. In this research, four different
Portland cement replacements were investigated including 0, 5, 10 and 15%. The
geopolymer concrete samples were cured at an ambient condition. The compressive
strength was measured at 1, 3, 7, and 28 days. In this current work, the cost and fuel
usage for 28-day compressive strength will be calculated. The mixing proportions and
compressive strength are shown in Table 3.1 and Table 5.6 respectively. The absence of
the external heat usually reduces the compressive strength; however, replacing fly ash
with Portland cement partially improves the compressive strength and other properties
such as absorption and microstructure.
Due to the absence of the external heat for the curing process, the fuel usage
required for raising the concrete samples from ambient condition to the oven temperature
and for maintaining the concrete samples in the oven temperature for 48 hours was
eliminated. The fuel (thermal energy) usage for the geopolymer concrete is shown in
Figure 5.7. The fuel usage was increased from 1.31 to 1.68 GJ/m3 when Portland cement
replacement increased from 0 to 15 %. However, the maximum of the total fuel usage of
15% Portland cement replacement is lower than Portland cement by 28.5%. Table 5.6
concrete at 28 days. By comparing the 15% Portland cement replacement, the Portland
cement is 29% higher than 15 % Portland cement replacement.
The cost of geopolymer concrete increased when Portland cement replacement
was used instead of fly ash. As shown in Figure 5.8, the cost was $118, $120, $123, and
$125 per cubic meter. The percent difference between 0 and 15% was 6 percent.
However, the compressive strength improvement was 57.7% in comparison with the zero
Portland cement replacement. Therefore, for each dollar increase in the cost, the
compressive strength increases by 5.0 MPa in the case of using Portland cement as a
replacement in the geopolymer concrete. The need for external heat for curing is not
required.
In conclusion, the effect of using Portland cement as the replacement has little
effect on the fuel usage and cost of geopolymer concrete. However, it eliminates using
external heat, and also improves the compressive strength. The effect of using Portland
cement replacement on the total fuel usage and cost of geopolymer concrete was
minimal; while the effect of sodium hydroxide and silica fume on the cost and fuel usage
was high. Therefore, a combination of reducing sodium hydroxide concentration, and
increasing Portland cement replacement on the mechanical, and microstructural
properties, as well as cost, CO2 emissions, and fuel (thermal energy) usage, will be
investigated.
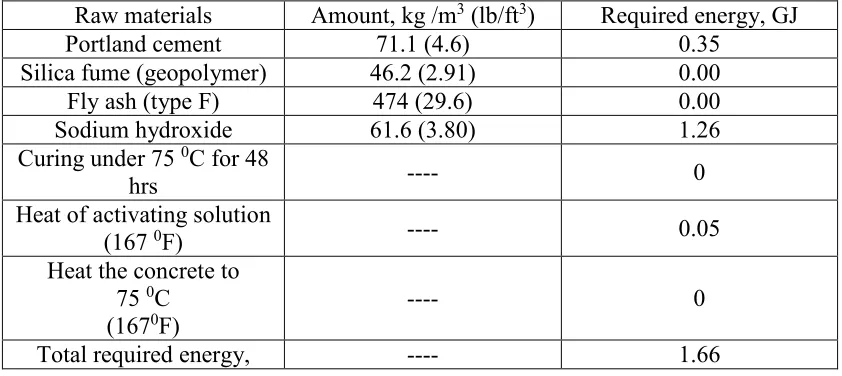
5.2.4. Calculation energy requirements and predicted cost for mix 5 and
corresponding Portland cement compressive strength
Portland cement compressive strength, which is 70 MPa, is shown in Table 5.7. The mix
design shown in Table 5.7 was based on information the Portland Cement Association
(PCA) book [71]. As shown in Table 5.7, Table 5.8, and Figure 5.9, the fuel (thermal
energy) usage of one cubic meter for the geopolymer concrete with 15% Portland cement
is 1.66 GJ, while for the Portland cement concrete it is 2.20 GJ. The difference in fuel
(thermal energy) usage is 33% less for 15% Portland cement replacement geopolymer
concrete in comparison with the conventional concrete.
Figure 5.10 shows the cost of the 15% Portland cement replacement geopolymer
paste, which is required to make one cubic meter of concrete, and the amount of Portland
cement paste required to make one cubic meter of concrete. The cost of geopolymer
concrete with 15% replaced Portland cement concrete is 34% higher than Portland
cement concrete. The cost difference may discourage from using customers to use the
geopolymer concrete; however, by reducing the sodium hydroxide concentration and
silica fume will help to reduce the total cost of geopolymer concrete because the cost of
sodium hydroxide is about 80% of the total of the geopolymer cost.
5.2.5. Calculation of energy requirements and predicted cost for mix 6-8 and
corresponding Portland cement compressive strength
Based on the findings from the previous section, sodium hydroxide and silica
fume have the dominant role in the cost of geopolymer concrete; and the external heat
may limit geopolymer concrete applications. The sodium hydroxide concentration not
only has an impact on the cost, but also on the fuel usage. It consists of 96% of the total
required fuel usage. In addition, partial Portland cement replacement was found to have
Those same findings show conclusively that sodium hydroxide and silica fume
have the dominant role in the cost of geopolymer concrete; and the external heat may
limit geopolymer concrete applications. The sodium hydroxide concentration not only
has an impact on the cost, but also on the fuel usage. It consists of 96% of the total of the
required fuel usage. In addition, the partial Portland cement replacement was found
neither to have a significant impact on the cost nor the fuel usage.
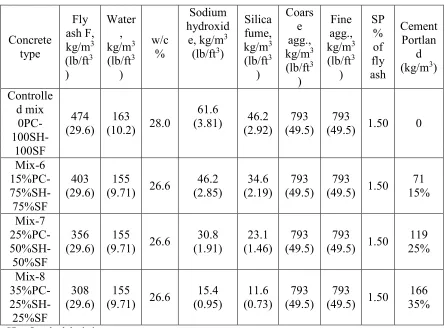
In this section, three new geopolymer mixes are proposed to reduce the cost and
fuel usage, in the absence of external heat for curing requirements. As shown in Table
5.9, the controlled mix was considered to have 100% sodium hydroxide and 100% silica
fume concentration in comparison with the new mixes. Mixes 6, 7, and 8 have 75%,
75%, 50%, 50%, and 25%, 25% of sodium hydroxide and silica fume weight ratio
respectively in comparison with the controlled mixture. Portland cement was used as
weight replacement in place of fly ash. Based on the findings in Assi et al [70], Portland
cement enhances the geopolymerization process because it contributes an additional
caustic, which is calcium hydroxide, and reduces the free water. Therefore, in these
mixes, as sodium hydroxide concentrations were decreased Portland cement replacement
was increased by 15%, 25%, 35% for mix 6, 7, and 8, respectively. Table 5.10 shows the
28-day compressive strength in the absence of external heat, cost, and fuel usage results.
The cost was $118, $97.5, $75.6, and $53.6 for the controlled mix, mix 6, 7, and 8
respectively. By considering the controlled mix as a reference for cost and fuel usage, the
cost reduction was 17%, 35%, and 55% for mix 6, 7, and 8 respectively. The fuel usage
Figure 5.12, respectively. As shown in Figure 5.11, fuel usage has a slight reduction in
comparison with the controlled mix; however, it is lower than the corresponding Portland
cement mixes by at least 50%. The corresponding Portland cement mixes were chosen
based on the compressive strength [82, 83]. Table 5.11 shows the two chosen Portland
cement mixes, in which mix-9 has zero fly ash, while mix-10 has 15% fly ash and 7.5%
silica fume. As shown in Figure 5.13, the 28-day compressive strength was 27.0 MPa
(3,920 psi), 29.2 MPa (3,920 psi), 29.1 MPa (3,920 psi), 15.2 MPa (2,180 psi) for the
controlled mix, and mix 6, 7, and 8, respectively. It seems that mix 6 and 7 are promising
because they have a competitive cost as well as lower fuel usage in comparison with the
Portland cement mix cost and fuel usage.
The new proposed mixes, in the absence of external heat, reduced the cost of
geopolymer concrete by 55%; however, some Portland cement mixes have a lower cost.
The geopolymer concrete has a unique advantage, which is 90% of the final compressive
strength can be achieved within 24 hours. The durability, fire resistance, and performance
may also be improved in comparison with Portland cement. Such advantages may
Tables:
Table 5.1 Mix design for 100 MPa compressive strength of Portland cement concrete [71]
Raw materials kg/m3c(lb/ft3)
Cement Type I 475 (29.8)
Silica fume 74.1 (4.65)
Fly ash (type F) 104 (6.53)
Coarse aggregate SSD (12.5 mm
crushed limestone), kg 1,070 (67.2)
Fine aggregate SSD, kg 593 (37.2)
HRWR Type F, liters 16.4 (4.33)
Retarder, Type D, liters 1.50 (0.40)
w/c 0.23
Table 5.2 Required energy for 100 and 106 MPa compressive strength of Portland and geopolymer concrete (Standard mix)
Raw materials Amount, kg/m3 (lb/ft3) Required energy, GJ
Cement Type I 475 (29.8) 2.35
Silica fume 46.2 (2.90) 0.00
Fly ash (type F) 474 (29.6) 0.00
Sodium hydroxide 61.6 (3.80) 1.26
Curing under 75.0 0C
(167 0F) for 48 hrs ---- 0.13
Heat of activating to75.0
0C (167 0F) solution
(167 0F)
---- 0.05
Heat the concrete to75.0
0C
(167 0F)
---- 0.10
Total required energy,
Portland cement ---- 2.35
Total required energy, Portland cement,
Geopolymer
Table 5.3 Raw materials price
Raw materials $/metric ton
Cement Type I, 106
Silica fume 640
Fly ash (type F) 35.0
Sodium hydroxide (50%) 580
Table 5.4 Seven-day compressive strength, cost and fuel usage of geopolymer concrete due to changing sodium hydroxide concentration
Sodium hydroxide concentration reduction, % Compressive strength MPa, (psi) Standard deviation (SD) MPa (psi) Cost, $ Fuel (thermal energy) usage, GJ
0 106 (15,400) 4.96 (720) 117 1.51
25 54.5 (7,910) 1.52 (220) 98.1 1.22
50 11.7 (1,780) 0.27 (40) 80.3 0.91
75 0.00 0.00 63.2 0.63
Table 5.5 Seven-day compressive strength, cost and fuel usage of geopolymer concrete due to changing the external heat
External heat,
o C (o F)
Compressive strength MPa, (psi) Standard deviation (SD) MPa (psi) Cost, $ Fuel (thermal energy) usage, GJ
25 (67.0) 30.3 (4,400) 2.55 (370) 117 1.45
35 (95.0) 33.1 (4,800) 3.72 (540) 117 1.47
45 (113) 68.5 (9,930) 1.17 (170) 117 1.49
Table 5.6 Seven-day compressive strength, cost, and fuel usage of partially replaced geopolymer concrete Fly ash (type F) weight replacement, % Portland cement weight replacement, % Compressive strength MPa, (psi) Standard deviation (SD) MPa (psi) Cost, $ Fuel (thermal energy) usage, GJ
0 0 27.2 (3,940) 2.14
(310) 118 1.31
5 5 53.3 (7,730) 1.72
(250) 120 1.42
10 10 57.4 (8,320) 2.07
(300) 123 1.61
15 15 64.3 (9,330) 1.65
(240) 125 1.70
Table 5.7 The required energy for 70 MPa compressive strength of Portland
Raw materials Amount, kg/m3 (lb/ft3) Required energy, GJ
Cement Type I 445 (29.8) 2.23
Silica fume (Portland
cement) 56 (3.50) 0
Water 474 (29.6) 0
Coarse aggregate 1,110 (69.4) ---
Fine aggregate 611 (38.2) ---
Total required energy 2.23
Table 5.8 Required energy for 69 MPa compressive strength of geopolymer concrete
Raw materials Amount, kg /m3 (lb/ft3) Required energy, GJ
Portland cement 71.1 (4.6) 0.35
Silica fume (geopolymer) 46.2 (2.91) 0.00
Fly ash (type F) 474 (29.6) 0.00
Sodium hydroxide 61.6 (3.80) 1.26
Curing under 75 0C for 48
hrs ---- 0
Heat of activating solution
(167 0F) ---- 0.05
Heat the concrete to
Table 5.9 Mixture proportions for mix 6-8 Concrete type Fly ash F, kg/m3 (lb/ft3 ) Water , kg/m3 (lb/ft3 ) w/c % Sodium hydroxid e, kg/m3
(lb/ft3)
Silica fume, kg/m3 (lb/ft3 ) Coars e agg., kg/m3 (lb/ft3 ) Fine agg., kg/m3 (lb/ft3 ) SP % of fly ash Cement Portlan d (kg/m3)
Controlle d mix 0PC- 100SH-100SF 474 (29.6) 163
(10.2) 28.0
61.6
(3.81) 46.2
(2.92)
793 (49.5)
793
(49.5) 1.50 0
Mix-6 15%PC- 75%SH-75%SF 403 (29.6) 155
(9.71) 26.6
46.2 (2.85) 34.6 (2.19) 793 (49.5) 793
(49.5) 1.50
71 15% Mix-7 25%PC- 50%SH-50%SF 356 (29.6) 155
(9.71) 26.6
30.8 (1.91) 23.1 (1.46) 793 (49.5) 793
(49.5) 1.50
119 25% Mix-8 35%PC- 25%SH-25%SF 308 (29.6) 155
(9.71) 26.6
15.4 (0.95) 11.6 (0.73) 793 (49.5) 793
(49.5) 1.50
166 35%
Table 5.10 Results of 28-day compressive strength, cost, and fuel usage for the new mixes
Concrete type
Average compressive strength, MPa (psi) Standard deviation (SD) MPa (psi) Fuel energy (GJ/m3)
Cost ($/m3)
Controlled mix 0PC- 100SH-100SF 27.2 (3,940) 2.14
(310) 1.31 118
Mix-6 15%PC- 75%SH-75%SF 29.2 (4,230) 1.95
(283) 1.37 97.5
Mix-7 25%PC- 50%SH-50%SF 29.2 (4,240) 7.24
(1050) 1.29 75.6
Mix-8 35%PC- 25%SH-25%SF 15.6 (2,270) 0.16
(24.3) 1.22 53.6
Table 5.11 Corresponding Portland cement mixture proportions
Materials Mix-9 :100PC-OFA-0SF
kg/m3 (lb/ft3) [1]
Mix-10: 100PC-15FA-7SF kg/m3 (lb/ft3) [2]
Portland cement I 335 (20.9) 392 (24.5)
Fly ash (type F) 0.00 80.1 (5.01)
Silica fume 0.00 38.6 (2.41)
Compressive strength
MPa (psi) 35.1 (5,070) 33.2 (4820)
Fuel energy
Figures:
Figure 5.1 Fuel (Thermal energy) usage
Figure 5.2 Cost of geopolymer and Portland cement concrete 2.35 1.26 0.13 0.05 0.1 0 0.5 1 1.5 2 2.5
Porland cement Geopolymer cement
R e q u ir ed e n er g y ( G J/ m 3 )
Portland cement Sodium hydroxide
Curing Heat of activating solution
50.1 48 29.7 71.5 16.6 0 20 40 60 80 100 120 140
Portlnad cement Geopolymer cement
C o st ( $ /m 3 )
Figure 5.3 Optimizing fuel (Thermal energy) usage by sodium hydroxide concentration
Figure 5.4 Optimizing cost of geopolymer by sodium hydroxide concentration 1.26 0.95 0.63 0.32 0.13 0.13 0.13 0.13 0.05 0.05 0.05 0.05 0.1 0.1 0.1 0.1 0 0.2 0.4 0.6 0.8 1 1.2 1.4 1.6 1.8
0% sodium hydroxide 25% sodium
hydroxide 50% sodium hydroxide 75% sodium hydroxide T h er m al e n er g y ( G J/ m 3)
Sodium hydroxide Curing Heat of activating solution Curing
29.7 29.7 29.7 29.7
71.5 53.6 35.7 17.8 16.6 16.6 16.6 16.6 0 20 40 60 80 100 120 140
0% sodium hydroxide reduction 25% sodium hydroxide reduction 50% sodium hydroxide reduction 75% sodium hydroxide reduction C o s t ( $ / m 3)
![Table 2.1 Coal combustion and its materials descriptions [60-63]](https://thumb-us.123doks.com/thumbv2/123dok_us/8373202.1384160/25.612.94.520.141.694/table-coal-combustion-materials-descriptions.webp)
![Figure 2.1 Coal combustion productions and utilizations [65]](https://thumb-us.123doks.com/thumbv2/123dok_us/8373202.1384160/26.612.104.513.385.602/figure-coal-combustion-productions-utilizations.webp)
![Figure 2.3 Coal – fired power plants in the United States [58]](https://thumb-us.123doks.com/thumbv2/123dok_us/8373202.1384160/27.612.104.513.360.579/figure-coal-fired-power-plants-united-states.webp)
![Figure 3.4 Sodium hydroxide producer price index (PPI) [84]](https://thumb-us.123doks.com/thumbv2/123dok_us/8373202.1384160/38.612.103.509.87.307/figure-sodium-hydroxide-producer-price-index-ppi.webp)