Article 1
Temporally and Spatially Resolved Emission
2Spectroscopy of Cyanide, Hydrogen and Carbon in
3Laser-Induced Plasma
4Christian G. Parigger 1,*, Christopher M. Helstern 1 and Ghaneshwar Gautam 2 5
1 Department of Physics and Astronomy, University of Tennessee/University of Tennessee Space Institute, 6
411 B. H. Goethert Parkway, Tullahoma, TN – 37388, USA; [email protected]; 7
2 Fort Peck Community College, 605 Indian Avenue, Poplar, MT 59255, USA; [email protected] 9
* Correspondence: [email protected]; Tel.: +1-931-841-5690 10
Abstract: This work examines atomic and molecular signatures in laser-induced plasma in 11
standard ambient temperature and pressure environments, including background contributions to 12
the spectra that depend on the laser pulse-width. Investigations include solids, gases, and 13
nano-particles. Abel inversions of measured line-of-sight data reveal insight into the radial plasma 14
distribution. For nominal 6 nanosecond laser pulses and for pulse-energies in the range of 100 to 15
800 mJ, expansion dynamics and turbulence due to shock phenomena are elucidated to address 16
local equilibrium details that are frequently assumed in spatially averaged emission spectroscopy. 17
Chemical equilibrium computations reveal temperature dependence of selected plasma species. 18
Specific interests include atomic hydrogen (H) and cyanide (CN). Atomic hydrogen spectra 19
indicate axisymmetric shell structures and isentropic expansion of the plasma kernel over and 20
above the usual shockwave. The recombination radiation of CN emanates within the first 100 21
nanoseconds for laser-induced breakdown in a 1:1 CO2:N2 gas mixture when using nanosecond
22
laser pulses to create the micro-plasma. The micro-plasma is generated using 1064 nm, 150 mJ, 6 ns 23
Q-switched Nd:YAG laser radiation. Measurements of the optical emission spectra utilize a 0.64 24
m Czerny-Turner type spectrometer and an intensified charge-coupled device. 25
Keywords: Laser-induced plasma; atomic spectroscopy; molecular spectroscopy; cyanide; 26 hydrogen; carbon 27 28 1. Introduction 29
Analysis of atomic species traditionally utilizes atomic emission spectroscopy of flames, plasmas, 30
arcs, or sparks for quantification of elements in the sample. However, elemental composition studies 31
frequently apply laser-induced breakdown spectroscopy (LIBS) in a variety of environments and 32
with extensions to molecular characterizations of solids, liquids, and gases [1-4]. Investigations of 33
laser-induced hydrogen plasmas serve the purpose of addressing fundamental aspects of 34
time-resolved emission spectroscopy and associated dynamic processes following optical 35
breakdown. Measurements of hydrogen plasmas allow one to determine important plasma 36
parameters such as excitation electron density and temperature. Usually one measures the width of 37
Balmer series lines of hydrogen that occur in the visible spectrum for electron density determination, 38
and the integrated ratio of these lines or with respect to the continuum. Optical emission 39
spectroscopy (OES) records indicate presence of molecular species that can elucidate sample 40
composition or interaction processes in the ambient atmosphere [3-6]. Typically, atomic hydrogen 41
lines, C2 Swan bands and cyanide (CN) violet system show in various applications [6,7] of
42
laser-induced OES such as in experiments with hydrocarbons [8]. Applications include laser ablation 43
molecular isotope spectrometry [9], combustion analyses [10], and plant or medical diagnostics 44
[11-13]. Detection methods of CN in the medical field include optical methods, electrochemical 45
methods, mass- spectrometry, gas chromatography, and quartz crystal mass monitors [14]. These 46
methods are adequate for detection of cyanide, yet molecular emission spectroscopy allows one to 47
measure composition with a minimally invasive approach. 48
This work reports selected results from experiments using nanosecond laser spectroscopy of 49
hydrogen plasma [15] and of CN molecular emission spectroscopy [16]. The CN recombination 50
radiation occurs within the first 100 nanoseconds for laser-induced breakdown in 1:1 CO2:N2 gas
51
mixtures. Aspects of the analysis include Abel inversions [17-21] and computational modeling [6] of 52
the plasma. Analysis of asymmetric plasma expansion would require Radon inverse transformations 53
[22]. Use of a chemical equilibrium code [23] allows one to predict species distribution as function of 54
temperature and pressure and to investigate local thermodynamic equilibrium. Experiments with 55
femtosecond laser pulses reveal advantages for laser ablation [12,13] with direct surface interaction 56
LIBS, but without the type of laser-supported plasma encountered with nanosecond pulses. 57
2. Experimental details 58
The experimental arrangement consists of a set of components typical for time-resolved, 59
laser-induced optical emission spectroscopy [14,15], or nanosecond laser-induced breakdown 60
spectroscopy (LIBS). Primary instrumentations include a Q-switched Nd:YAG device (Quantel 61
model Q-smart 850) that is operated at the fundamental wavelength of 1064-nm to produce 62
full-width-at-half-maximum 6-ns laser radiation with an energy of 850 mJ per pulse, a laboratory 63
type Czerny-Turner spectrometer (Jobin Yvon model HR 640) with a 0.64 m focal length and 64
equipped with a 1200 grooves/mm grating, an intensified charge coupled device (Andor Technology 65
model iStar DH334T-25U-03) for recording of temporally and spatially resolved spectral data, a 66
laboratory chamber or cell with inlet and outlet ports together with a vacuum system, electronic 67
components for synchronization, and various optical elements for beam shaping, steering, and 68
focusing. 69
A singlet lens (Thorlabs model LA1509-C) accomplishes with f/5 focusing the generation of the 70
optical breakdown micro-plasma in a chamber that contains the 1:1 CO2:N2 atmospheric gas mixture
71
(Airgas ultra-high purity N2 and research grade CO2). Beam-splitters and apertures attenuate the
72
energy/pulse from 850 to 150 mJ for the CN experiments. In air breakdown shadow-graph 73
visualizations, a fused silica plano-convex lens (Thorlabs model LA4545) focuses the laser beam with 74
f/10 optics. Figure 1 illustrates computed radial distributions [6] for the Thorlabs LA4545 lens for 75
focusing with f/5 optics. The peak irradiance distributions are computed for 850 mJ, 6 ns, 1064 nm 76
radiation. The tighter f/5 focusing reveals about one order of magnitude (or by a factor of 23) smaller
77
focal volume than that obtained for f/10 focusing. 78
Figure 1. Spatial distribution of 1064-nm, (a) f/5, and (b) f/10 focusing with the Thorlabs LA4545, 100 mm focal
Captured shadow-graphs of the breakdown plasma serve the purpose of visualizing the plasma 79
expansion [24]. Figure 2 illustrates typical shadowgraphs recorded in standard ambient temperature 80
and pressure laboratory air. The figures reveal vertical stagnation layers that originate from multiple 81
breakdown sites as indicated in the computed focal intensity distribution (see Fig. 1). 82
The laser-supported plasma expansion is consistent with previous focal volume investigations [25] 83
and with the Taylor-Sedov blast-wave model [26,27]. Increased electron density and temperature 84
occur in the outer region of the plasma kernel as evidenced by the bright-to-dark boundaries that 85
appear to cause multiple reflection inside the shock wave. The vertical extend is about a factor of 1.4 86
smaller for 150 mJ pulses than that for 850 mJ pulses, according to the Taylor-Sedov energy 87
dependency for the radius of a spherical expansion. 88
89
4. Results and discussion 90
The experimental series for the separate measurements of atomic H and CN molecular distribution 91
after optical breakdown includes evacuating the cell to a nominal mercury pump vacuum of 10-4 Pa
92
(10-6 Torr) and then introducing hydrogen or the N2 : CO2 mixture. Figure 3 illustrates typical raw
93
images of captured time-resolved data following optical breakdown [16] in the ultra-high pure N2
94
and research grade CO2.
95
Figure 2. Plasma expansion (a) at 0.8 µ s (b) at 1 µ s. At 1 µ s time delay, the plasma expands vertically at
~ Mach 3 (~1 km/s). The slopes in (a) and (b) are ± 3.6 and ± 3, respectively, indicate the forward envelopes of
the shock waves.
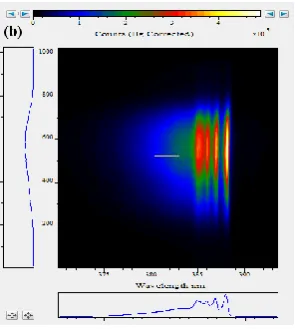
Figure 3. Raw spectra (a) 0.45 µ s and (b) 3.7 µ s after optical breakdown in a 1:1 CO2:N2 atmospheric gas
In the reported investigations, signatures of the 0-0, 1-1, 2-2, 3-3, 4-4 band heads begin to emanate 96
for time delays of the order of 0.1 µ s from optical breakdown. Moreover, the plasma typically 97
propagates towards the laser side. The recorded data indicate a ~ 0.8 mm upward CN-signal 98
propagation in the 370 to 393.5 nm spectral, 7 mm object window during the first 5 µ s, from a delay 99
of 0.2 µ s to 5.2 µ s. Optical breakdown inside the chamber occurs at a rate of 10 Hz, with the laser 100
beam focused with f/5 optics from the top, or parallel to the slit. The detector pixels are binned in 4 101
tracks along the slit direction, resulting in obtaining 256 spectra for each time delay. Figure 3 shows 102
accumulated raw data from 100 consecutive optical breakdown events, recorded at a time delay of 103
0.450 µ s and a gate width of 0.125 µ s. The vertical axis indicates the slit-height, the laser beam is 104
focused from the top. With 1:2 imaging, and a pixel resolution of 13.6 µ m, the discernable plasma 105
size in the cell amounts to ~ 3 mm. The figure illustrates that the CN band heads of the Δv = 0 106
sequence are well-developed, and it also displays an atomic line near 386.2 nm that is the carbon 107
C I 193.09-nm atomic line, recorded in second order [16]. 108
Abel inverse transformation allows one to obtain the radial distribution of the plasma. Strictly 109
speaking, radially symmetric profiles are required for Abel inversion. Analysis of the molecular CN 110
spectra utilizes the same methods as previously applied for atomic hydrogen spectra [17,18]. The 111
integral equation describes line-of-sight averaging, 112
I(z, λ) = 2 ∫ I(𝑟, λ)
𝑧ρ √𝑟2𝑟−𝑧2𝑑𝑟 .
(1) 113The measured, line-of sight data, I(z, λ), along the slit dimension, 𝑧, are inverted for each 114
wavelength, λ, to obtain the volumetric radial distribution, I(𝑟, λ), with the upper limit much larger, 115
ρ >> R, than the radius, R, of the plasma. The choice of the number of Chebyshev polynomials for the 116
inversion [17] is equivalent to the use of a digital filter [18] that causes broadening of computed 117
radial spectra. In this work, the inversion uses 10 polynomials, a smaller number of polynomials 118
would cause smaller spectral resolution. 119
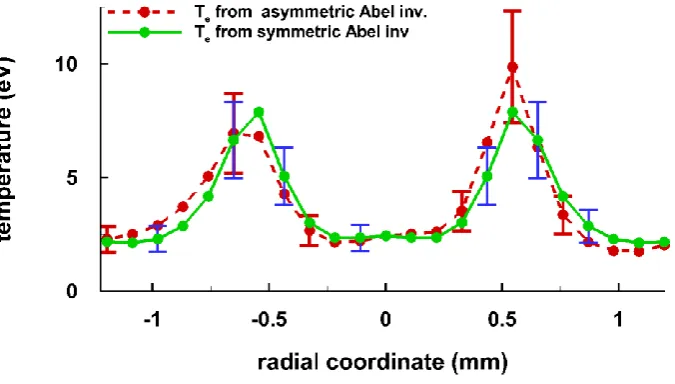
Figure 4 displays results of Abel-inverted hydrogen data for a time delay of 0.4 µ s from optical 120
breakdown. For the recorded data, the constructed Boltzmann plots utilize Hα, Hβ, and Hγ integrated
121
line shapes to provide a measure for the excitation temperature distribution [15]. Figure 4 portrays 122
a cooler central region and a relatively hot ring of the order of 100,000 K (8.6 eV). As indicated in the 123
figure, the kernel expands at or near the speed of sound in hydrogen gas. 124
Figure 5 shows the corresponding electron densities [15,19,20]. The error bars are in part due to 125
the lower fidelity of the Abel inversion for a time delay of 0.4 µ s. Wavelength and detector 126
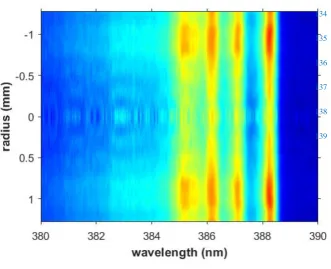
system-sensitivity calibrated CN spectral data are Abel inverted [16]. 127
Figure 6 displays the results and it shows a comparison of computed and of measured spectra 128
[28,29]. Analogous to recently reported hydrogen nitrogen gaseous mixtures [30], the CN signals are 129
weaker at the center and indicate a slightly lower temperature than for the 0.85 mm position. There 130
appears to be residual interference from an atomic line at 386.2 nm that indicates the carbon line at 131
193.09-nm line [20,21], measured in second order. 132
133
134
135
136
137
138
139 Figure 5. Electron density, ne, vs. radial position.
Figure 7 illustrates measured and fitted CN spectra at the radius of 0.85 mm, indicating a fitted 140
FWHM of 0.45 nm and a temperature of 8.6 kK. For comparison, reasonable signal to noise spectra at 141
1 mm and at a delay of 3.7 µ s, reveal expected lower temperature than that for the 1.2 µ s time delay. 142
One would expect that the CN molecule distribution is close to uniform in chemical equilibrium. 143
For time delays in the range of 5 to 50 µ s, the line-of-sight molecular CN spectra are well developed, 144
and the recorded optical emissions originate from a decreasing volume with increasing gate delay. 145
In addition, CN recombination radiation signals may be stronger for specific ranges of temperature. 146
Computation of the freely available Chemical Equilibrium with Applications (CEA) code [23] 147
elucidate CN mass fractions versus temperature. Several atoms and molecules including ionic 148
species are part of the CEA computations, but the results for the CN mass fractions are of primary 149
interest in this work. Figure 8 shows the CN distribution for both air and the mixture as function of 150
temperature. 151
Figure 7. Inferred CN excitation temperature at the radius of 0.85 mm.
Figure 8. CN (a) air and (b) mixture mass fraction vs. temperature in chemical equilibrium, CN shows a
maximum near 7 kK for the 1:1 atmospheric CO2:N2 mixture. CN fractions in air are nearly 3 orders of
The recombination signals from the mixture are strongest near 7 kK. Using the tabulated 152
chemical equilibrium results [23] at a temperature of 7 kK, one finds that the number of CN 153
molecules in the mixture and air amount to ~ 3×1015 cm-3 and ~ 5×1 012 cm-3, respectively. Spectra
154
analyses of the central region data at 0.45-µ s time delay indicate slightly lower temperatures at 155
center than that obtained at a radial position of 1 mm, and spectroscopic interference from the likely 156
carbon line in 2nd order is apparent for time delays of 0.45 and 1.2 µ s. Line-of-sight data consist of
157
average spectra with contributions from regions at different temperatures. For instance, the 158
molecular CN spectra near the plasma edges, viz. near the top and bottom of the spectra (see 159
Figure 3) show smaller signals but reveal higher temperatures than in the center portion. 160
161
5. Conclusions 162
Measured hydrogen and cyanide recombination spectra indicate a spherical shell structure of the 163
plasma kernel inside the shock wave early in the plasma decay. For hydrogen, electron density and 164
excitation temperature are higher in the peripheral region than near the center due to expansion 165
dynamics of the plasma kernel after optical breakdown. The recombination radiation from CN 166
shows a similar trend for early time delays, namely, higher excitation temperatures occur in the 167
outer region than near the center of the plasma kernel. Strictly speaking, the application of Abel 168
inversion requires a symmetric light source, yet the analysis of the extent of asymmetry in the 169
hydrogen plasma leads to variations within the estimated error bars. Shadow-graph studies in air 170
would support symmetrizing the spectral data recorded in the CO2:N2 mixture and applying Abel
171
inverse transforms to extract the spatial variation of the CN optical emission signals. 172
Funding: The authors appreciate the support in part by the Center for Laser Application, a State of Tennessee 173
funded Accomplished Center of Excellence at the University of Tennessee Space Institute. 174
Author Contributions: Christian G. Parigger conceived and performed the experiments with Ghaneshwar 175
Gautam. Christian G. Parigger analyzed the result together with Christopher M. Helstern, and all authors 176
contributed to the writing of the article. 177
Conflicts of Interest: The authors declare no conflict of interest. 178
References 179
[1] Cremers, D.A.; Radziemski, L.J. Handbook of Laser-Induced Breakdown Spectroscopy; Wiley & Sons 180
Ltd.: USA, 2006. 181
[2] Singh, J.P.; Thakur, S.N. (Eds.); Laser Induced Breakdown Spectroscopy; Elsevier: NL, 2007. 182
[3] Hahn, D.W.; Omenetto, N. Laser-Induced Breakdown Spectroscopy (LIBS), Part I: Review of 183
Basic Diagnostics and Plasma-Particle Interactions: Still-Challenging Issues within the 184
Analytical Plasma Community. Appl. Spectrosc. 2010, 64, 335A – 336A. 185
[4] Hahn, D.W.; Omenetto, N. Laser-Induced Breakdown Spectroscopy (LIBS), Part II: Review of 186
Instrumental and Methodological Approaches to Material Analysis and Applications to 187
Different Fields Appl. Spectrosc. 2012, 66, 347 – 419. 188
[5] Parigger, C.G; Surmick, D.M.; G. Gautam, G.; EL Sherbini, A.M. Hydrogen alpha laser ablation 189
plasma diagnostic. Opt. Lett. 2015, 40, 3436 – 3439. 190
[6] Parigger, C.G. Laser-induced breakdown in gases: experiments and simulation; Chapter 4 in: 191
A.W. Miziolek, V. Palleschi, I. Schechter (Eds.), Laser Induced Breakdown Spectroscopy; 192
[7] Dong, M.; Lu, J.; Yao, S.; Zhong, Z.; Li, Junyan; Li, Jun; Lu, W. Experimental study on the 194
characteristics of molecular emission spectroscopy for the analysis of solid materials containing 195
C and N. Opt. Express 2011, 19, 17021 – 17029. 196
[8] Parigger, C.G.; Dackman, M.; Hornkohl, J.O.Time-resolved spectroscopy measurements of 197
hydrogen-alpha, -beta, and -gamma emissions. Appl. Opt. 2008, 47, G1 – G6. 198
[9] Dong, M.; Chan G.C.-Y., X. Mao, X.; Gonzalez, J.J.; J. Lu, Russo, R.E. Elucidation of C2 and CN
199
formation mechanisms in laser-induced plasmas through correlation analysis of carbon 200
isotopic ratio. Spectrochim. Acta Part B: At. Spectrosc. 2014, 100, 62 – 69. 201
[10]Kotzagianni, M.; Couris, S. Femtosecond laser induced breakdown spectroscopy of air– 202
methane mixtures. Chem. Phys. Lett. 2013, 561 – 562, 36 – 41. 203
[11]Minorsky, P.V. On the Inside. Plant Physiol. 2011, 155, 169 – 170. 204
[12]Baudelet, M.; Guyon, L.; Yu, J.; Wolf, J.-P.; Amodeo, T.; Fréjafon, E.; Laloi, P. Spectral signature 205
of native CN bonds for bacterium detection and identification using femtosecond 206
laser-induced breakdown spectroscopy. J. Appl. Phys. 2006, 88, 063901. 207
[13]Baudelet, M.; Guyon, L.; Yu, J.; Wolf, J.-P.; Amodeo, T.; Fréjafon, E.; Laloi, P. Femtosecond 208
time-resolved laser-induced breakdown spectroscopy for detection and identification of 209
bacteria: A comparison to the nanosecond regime. J. Appl. Phys. 2006, 99, 084701. 210
[14]Ma, J.; Dasgupta, P.L. Recent developments in cyanide detection: a review. Anal. Chim. Acta 211
2010, 673, 117 – 125. 212
[15]Parigger, C.G.; Surmick, D.M.; Gautam, G. Self-absorption characteristics of measured 213
laser-induced plasma line shapes. J. Phys.: Conf. Ser. 2017, 810, 012012. 214
[16]Parigger, C.G.; Helstern, C.M; Gautam, G. Molecular emission spectroscopy of cyanide in 215
laser-induced plasma. Int. Rev. At. Mol. Phys. 2017, 8, 25 – 35. 216
[17]G. Pretzler. A New Method for Numerical Abel-Inversion. Z. Naturforsch. 1991, 46a, 639 – 641. 217
[18]G. Pretzler, H. Jäger, T. Neger, H. Philipp, and J. Woisetschläger. Comparison of Different 218
Methods of Abel Inversion Using Computer Simulated and Experimental Side-On Data. Z. 219
Naturforsch. 1992, 47a, 955. 220
[19]Parigger, C.G.; Gautam, G.; Surmick, D.M. Radial electron density measurements in 221
laser-induced plasma from Abel inverted hydrogen Balmer beta line profiles. Int. Rev. At. Mol. 222
Phys. 2015, 6, 43 – 55. 223
[20]Helstern, C.M.; Parigger, C.G. Time-resolved plasma spectroscopy of diatomic molecular 224
cyanide, J. Phys.: Conf. Ser. 2019, in press. 225
[21]Parigger, C.G; Surmick, D.M.; Helstern, C.M.; Gautam, G.; Bol’shakov. A.A. Molecular 226
Laser-Induced Breakdown Spectroscopy; Chapter 7 in: J.P. Singh, S.N. Thakur (Eds.); Laser 227
Induced Breakdown Spectroscopy; Elsevier: NL, 2019, in press. 228
[22]Eschlbӧck-Fuchs, S.; Demidov, A.; Gornushkin, I.; Schmid, T.; Rӧssler, R.; Huber, N.; Panne, U.; 229
Pedarnig, J. Tomography of homogenized laser-induced plasma by Radon transform 230
technique. Spectrochim. Acta Part B: At. Spectrosc. 2016, 123, 59 – 67. 231
[23]McBride B.J.; Gordon, S. Computer Program for Calculating and Fitting Thermodynamic Functions, 232
NASA RP-1271, 1992; on-line 2005 version at https://cearun.grc.nasa.gov/ (last accessed 233
November 26, 2017). 234
[24]Gautam, G.; Helstern, C.M.; Drake, K.A.; Parigger, C.G. Imaging of Laser-induced Plasma 235
[25]Chen, Y.-L.; Lewis, J.W.L.; C. Parigger, C.G. Spatial and Temporal Profiles of Pulsed 237
Laser-Induced Air Plasma Emissions. J. Quant. Spectrosc. Radiat. Transf. 2000, 67, 91 – 103. 238
[26]Taylor, G. The Formation of a Blast Wave by a Very Intense Explosion. II. The Atomic 239
Explosion of 1945. Proc. Roy. Soc. A 1950, 201, 175 – 186. 240
[27]Campanella, B.; Legnaioli, S.; Pagnotta, S.; Poggialini, F.; Palleschi, V. Shock Waves in 241
Laser-Induced Plasmas. Atoms 2019, 7, 7020057. 242
[28]Hornkohl, J.O.; Parigger, C.G.; Lewis, J.W.L. Temperature Measurements from CN Spectra in a 243
Laser-Induced Plasma. J. Quant. Spectrosc. Radiat. Transf. 1991, 46, 405 – 411. 244
[29]Parigger, C.G.; Woods, A.C.; Surmick, D.M.; Gautam, G.; Witte, M.J.; Hornkohl, J.O. 245
Computation of diatomic molecular spectra for selected transitions of aluminum monoxide, 246
cyanide, diatomic carbon, and titanium monoxide. Spectrochim. Acta Part B 2015, 107, 132 – 138. 247
[30]Gautam. G.; Parigger, C.G.; Helstern, C.M.; Drake, K.A. Emission Spectroscopy of Expanding 248