Open Access
Proceedings
Functional group-based linkage analysis of gene expression trait loci
Na Li*
1, Baolin Wu
1, Peng Wei
1, Benhuai Xie
1, Yang Xie
2, Guanghua Xiao
2and Wei Pan
1Address: 1Division of Biostatistics, University of Minnesota, A460 Mayo Building MMC 303, 420 Delaware Street Southeast, Minneapolis, Minnesota 55126, USA and 2Division of Biostatistics, Department of Clinical Sciences, University of Texas Southwestern Medical Center, 5323 Harry Hines Boulevard, Dallas, Texas 75390, USA
Email: Na Li* - [email protected]; Baolin Wu - [email protected]; Peng Wei - [email protected]; Benhuai Xie - [email protected]; Yang Xie - [email protected]; Guanghua Xiao - [email protected]; Wei Pan - [email protected] * Corresponding author
Abstract
We explored approaches to using multiple related traits (gene expression levels) in linkage analysis. We first grouped mRNA transcripts according to their functions annotated in biological process of gene ontology (GO). We then compared using sample average, principal-components analysis (PCA), and linear discriminant analysis (LDA) to derive a univariate composite trait. Our results showed that PCA generally yielded stronger evidence for linkage, through the LDA component had the highest heritability. We also developed an algorithm to search for clusters of linkage peaks from multiple traits in the same group and a heuristic method for calculating p-value evaluating the linkage peak clustering. Future research is needed to develop rigorous methods in mapping of genes affecting the expression of a group of transcripts.
Background
Our aim is to explore approaches to collecting informa-tion from multiple sub-clinical traits (e.g., gene expres-sion, protein levels, metabolite measurements) in search for loci responsible for complex diseases. Given a particu-lar regulatory/metabolic pathway that is important in the development of a disease, we use the expression levels of genes in the pathway to map the loci affecting the path-way, thus affecting the clinical outcome. To avoid confu-sion between the genes we are trying to map and the genes whose expression levels are used as traits, we will call the expression levels "traits" of "transcripts", as we will talk about functions of the transcripts. Because these traits
reflect more immediate effects of the gene in question, we may reduce the confounding effects of environmental fac-tors and the disease genetic heterogeneity.
Because there is no clinical trait or covariate information in Problem 1, we defined a group of transcripts as those sharing some common biological functions, and explored whether we can gain more linkage information by com-bining multiple expression traits in a group.
from Genetic Analysis Workshop 15
St. Pete Beach, Florida, USA. 11–15 November 2006
Published: 18 December 2007
BMC Proceedings 2007, 1(Suppl 1):S117
<supplement> <title> <p>Genetic Analysis Workshop 15: Gene Expression Analysis and Approaches to Detecting Multiple Functional Loci</p> </title> <editor>Heather J Cordell, Mariza de Andrade, Marie-Claude Babron, Christopher W Bartlett, Joseph Beyene, Heike Bickeböller, Robert Culverhouse, Adrienne Cupples, E Warwick Daw, Josée Dupuis, Catherine T Falk, Saurabh Ghosh, Katrina A Goddard, Ellen L Goode, Elizabeth R Hauser, Lisa J Martin, Maria Martinez, Kari E North, Nancy L Saccone, Silke Schmidt, William Tapper, Duncan Thomas, David Tritchler, Veronica J Vieland, Ellen M Wijsman, Marsha A Wilcox, John S Witte, Qiong Yang, Andreas Ziegler, Laura Almasy and Jean W MacCluer</editor> <note>Proceedings</note> <url>http://www.biomedcentral.com/content/pdf/1753-6561-1-S1-info.pdf</url> </supplement>
This article is available from: http://www.biomedcentral.com/1753-6561/1/S1/S117
© 2007 Li et al; licensee BioMed Central Ltd.
Methods
Selection of gene functional groups
The 3554 transcripts were grouped based on the biologi-cal processes in which they are involved according to the gene ontology (GO) via Onto-Express [1]. On the one hand, we would like to borrow information across many transcripts in a function group; on the other hand there is an increasing functional heterogeneity with a larger or less-specific function group. To achieve a trade-off between a functional specificity and group size, and to ensure that the results from several groups are compara-ble, we restricted our analysis to those groups with approximately 10 to 20 transcripts. We calculated pair-wise correlations between pairs of traits in the same group and the general heritability was estimated using SOLAR [2] for each of the 554 transcripts in 40 groups. The top 10 groups with the highest average heritability estimates were selected for subsequent linkage analysis because they were more likely to contain interesting linkage signals.
Linkage analysis with composite trait
All traits were standardized to have sample mean of 0 and sample variance of 1. We used three approaches to pro-ducing a univariate summary of the expression traits of individual genes in each group: a sample average, princi-pal-components analysis (PCA), and linear discriminant analysis (LDA). All three approaches derive a single or multiple univariate "composite" traits by using a linear combination of the individual traits. The components in PCA are orthogonal linear combinations of original data and are ordered by decreasing sample variances [3]. In particular, the first component explains the largest pro-portion of sample variation. PCA was carried out using function prcomp in R. The PCA did not take into account the fact that the subjects came from several distinct fami-lies. As an alternative, we sought to find a linear combina-tion of the original data that maximized the ratio of inter-family variance to within-inter-family variance, for which we used LDA with the family as the class label. The LDA was carried out using function lda in R.
Multipoint variance-component LOD scores for each tran-script and composite traits were calculated using Merlin [4].
Combining linkage results from multiple traits
In linkage studies in which multiple related traits (such as obesity, diabetes, and hypertension) are analyzed, it is often of interest to see if several of the traits have linkage signals around a common region, often done by simply visualizing the LOD scores along a chromosome. We developed a heuristic algorithm for identifying the cluster-ing of linkage peaks. 1) Linkage "peaks" were defined as LOD scores greater than a particular threshold C (e.g., 2). The threshold was set to be relatively high such that the
chance of type I error was low. 2) The peak locations were defined to be where the local maximum LOD scores were. 3) Using a sliding window with width W (e.g., 10 cM), we defined a "cluster" as the window inside which more than one distinct gene had one or more peaks.
To assess whether a cluster was due to chance, we calcu-lated a simple p-value, assuming that linkage peaks were independent and uniformly distributed along a chromo-some, conditional on the observed number of peaks for each gene. Let L denote the total chromosome length. For gene k, conditional on observing nk peaks, the probability of observing at least one peak in a window is . We calculated the average probabil-ity as
For the total K transcripts in a group, the probability that there are at least K0 peaks in a window is
Results
Selection of functional groups
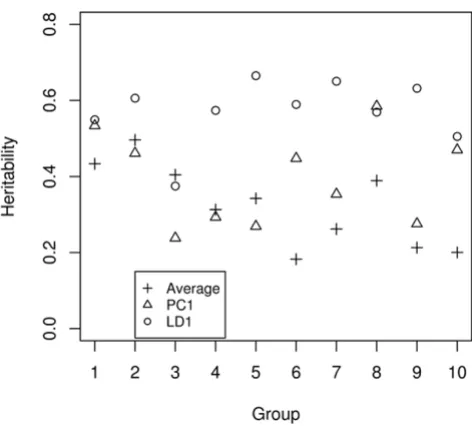
Figure 1 shows the heritability of the ten selected groups. The median heritability varies from 0.17 to 0.39. The pair-wise correlation of traits within each group is shown in Figure 2. Some groups show strong positive correlations (e.g., Groups 2 and 4), while for others the correlation was distributed almost symmetrically around 0 (e.g., Groups 5 and 6). Our definition of function groups does not neces-sarily imply the transcripts are co-regulated directly or indirectly through the same gene or pathway so it is not surprising to see that some transcripts within a group have very little correlation.
Linkage analysis with composite traits
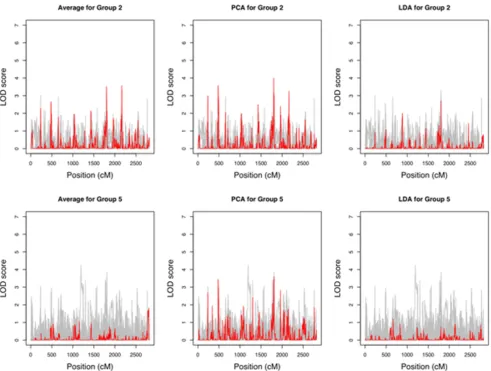
The LOD score curves for individual transcripts and com-posite traits for Groups 2 and 5 are shown in Figure 4. In both cases, PC1 performed well in terms of yielding the strongest evidence for linkage compared with single-trait analysis, while the sample average did poorly for Group 5; it was likely due to the fact that transcripts in Group 2 were mostly positively correlated, whereas about a half of the transcripts in Group 5 were negatively correlated with the other half. PC1 accounted for 45% and 26% of the total variances for Groups 2 and 5, respectively.
Combining linkage results from multiple traits
Table 1 summarizes the clustering of linkage peaks for Groups 2 and 5. Without any multiple testing adjustment, it appeared that in general the probability of chance clus-tering was low even when only two peaks appeared in the same window. If a strong clustering were observed (e.g., three or more peaks clustered together out of ten genes), it could be a strong indicator of the existence of a possible common regulatory locus (co-linkage).
Conclusion
Li et al. [5] used the average expression profile of a tran-scription module as a quantitative trait in linkage map-ping and found that it was more powerful than using
individual expression traits. Lan et al. [6] also used PCA and hierarchical clustering seeded by relevant disease traits for dimension reduction in expression quantitative trait locus mapping, but they did not emphasize its use for a functional group. Here, we compared the performance of several dimension reduction techniques and found
Heritability of the derived composite traits Figure 3
Heritability of the derived composite traits.
Heritability of the ten functional transcript groups with high-est mean heritability
Figure 1
Heritability of the ten functional transcript groups with highest mean heritability. The groups are: 1) amino acid biosynthesis; 2) phosphoinositide-mediated signaling; 3) GTP biosynthesis; 4) purine nucleotide biosynthesis; 5) regu-lation of cyclin dependent protein kinase activity; 6) meiosis; 7) mRNA-nucleus export; 8) cholesterol metabolism; 9) bio-synthesis; and 10) epidermis development.
Pairwise correlations of the ten functional groups with high-est mean heritability
Figure 2
PCA generally outperformed the sample average when applied to GO-defined functional groups, at least in terms of capturing and enhancing any linkage scores as obtained from a single-trait analysis. The motivation behind using LDA was to maximize the heritability of the derived trait because the heritability is approximately the ratio of
intra-versus inter-family variances. However, the linkage result for the LDA-derived trait was actually the worst. The LOD scores are generally smaller than those from single-trait analysis and for Group 5, almost all of the LOD score peaks from single-trait analysis were gone, suggesting that
LOD scores Figure 4
LOD scores. Individuals genes (gray) and the composite traits (red) for groups 2 (phosphoinositide-mediated signaling) and 5 (regulation of cyclin dependent protein kinase activity).
Table 1: Clustering of LOD score peaks
Clustersa
Group No. genes LOD threshold Total no. of peaks 2-peak (p-value) 3-peak (p-value)
2 11 2 18 3 (0.002) 1 (3 × 10⁻⁵)
3 4 1 (10-4) 0
5 21 2 49 5 (0.01) 2 (7 × 10⁻⁴)
3 14 1 (10-3) 0
Publish with BioMed Central and every scientist can read your work free of charge "BioMed Central will be the most significant development for disseminating the results of biomedical researc h in our lifetime."
Sir Paul Nurse, Cancer Research UK
Your research papers will be:
available free of charge to the entire biomedical community
peer reviewed and published immediately upon acceptance
cited in PubMed and archived on PubMed Central
yours — you keep the copyright
Submit your manuscript here:
http://www.biomedcentral.com/info/publishing_adv.asp
BioMedcentral
it is not always desirable to search for traits with high her-itability.
We selected the ten groups for linkage analysis based on the heritability. There is substantial difference in the cor-relation structure within each group as evidenced in Fig-ure 2. It is not clear for what correlation structFig-ure such combined analysis is likely to be the most successful. On the one hand, traits that are correlated are more likely to share a common regulatory gene. On the other hand, two highly correlated traits do not provide much additional information compared with a single trait [7].
Although using PCA does not necessary yield higher LOD scores than a single expression trait, different thresholds for "significant" LOD scores are necessary due to multiple testing when multiple traits are analyzed individually. A dimension reduction approach necessarily reduces the number of tests conducted. We could, for example, use PCA to screen for functional groups that are more likely to be co-regulated by a common gene among all GO groups.
The way we searched for clustering of linkage peaks among related traits was just a proof-of-concept exercise. In particular, information such as the width or height of a linkage peak was not used. Our p-value calculation was based on perhaps over-simplified assumptions, such as the independence of peak locations under the null hypothesis. Much further research is needed.
Finally, given an overwhelmingly large set of variables (e.g., gene expression levels), how to define functional groups will likely be the most critical part of the analysis. We realized that the GO functional groups do not neces-sarily imply the transcripts in a group belong to the same metabolic pathway or are regulated by common genes. Without sufficient biological knowledge and no clinical outcomes, we could not address the problem of how to select traits for joint analysis and opted to simply use GO information. Solutions to this difficult problem are highly context dependent and close collaboration between statis-ticians and subject-area experts is needed.
Competing interests
The author(s) declare that they have no competing inter-ests.
Acknowledgements
This article has been published as part of BMC Proceedings Volume 1 Sup-plement 1, 2007: Genetic Analysis Workshop 15: Gene Expression Analysis and Approaches to Detecting Multiple Functional Loci. The full contents of the supplement are available online at http://www.biomedcentral.com/ 1753-6561/1?issue=S1.
References
1. Draghici S, Khatri P, Bhavsar P, Shah A, Krawetz SA, Tainsky MA:
Tools, the toolkit of the modern biologist: Onto-Express, Onto-Compare, Onto-Design and Onto-Translate. Nucleic Acids Research 2003, 31:3775-3781.
2. Almasy L, Blangero J: Multipoint quantitative-trait linkage anal-ysis in general pedigrees. Am J Hum Genet 1998, 62:1198-1211. 3. Rencheer AC: Multivariate Statistical Inference and ApplicationsNew
York: Wiley; 1998.
4. Abecasis GR, Cherny SS, Cookson WO, Cardon LR: Merlin – rapid analysis of dense genetic maps using sparse gene flow trees. Nat Genet 2002, 30:97-101.
5. Li H, Chen H, Bao L, Manly KF, Chesler EJ, Lu L, Wang J, MiZhou RWW, Cui Y: Integrative genetic analysis of transcription modules: towards filling the gap between genetic loci and inherited traits. Hum Mol Genet 2005, 15:481-492.
6. Lan H, Stoehr JP, Nadler ST, Schueler KL, Yandell BS, Attie AD:
Dimension reduction for mapping mRNA abundance as quantitative traits. Genetics 2003, 164:1607-1614.