The magnetic phase transition and universality class
of
h-(Y
0.98
Eu
0.02
)MnO
3
and
h-YMnO
3
in zero and
applied pressure
Sonja Holm-Dahlin1,2,∗, Sofie Janas1, Andreas Kreisel3, Ekaterina Pomjakushina4, Jonathan S. White2, Amy L. Fennell, and Kim Lefmann1
1 Nanoscience Center, Niels Bohr Institute, University of Copenhagen, 2100 Copenhagen Ø, Denmark 2 Laboratory for Neutron Scattering and Imaging, Paul Scherrer Institute, 5232 Villigen PSI, Switzerland 3 Institut für Theoretische Physik, Universität Leipzig, D-04103 Leipzig, Germany
4 Laboratory for Multiscale Materials Experiments, Paul Scherrer Institute, 5232 Villigen PSI, Switzerland
* Correspondence: [email protected] Tel.: +45-28306064
Abstract: We have investigated the antiferromagnetic phase transition in the frustrated and multiferroic hexagonal manganites h-(Y0.98 Eu0.02)MnO3 (YEMO) and h-YMnO3 (YMO). Elastic neutron scattering has been used to study in detail the phase transition in YMO and YEMO in zero pressure and in YMO at a hydrostatic pressure of 1.5 GPa. In zero pressure, we find the critical temperatureTN =72.11(5)K and 71.3(1) K and the critical exponentβ=0.206(3)and 0.22(2), for YEMO and YMO, respectively. This is in agreement with earlier work by Roessliet al.. In applied hydrostatic pressure of 1.5 GPa, the ordering temperature increases toTN =75.2(5)K, in agreement with earlier reports, whileβis unchanged. Inelastic neutron scattering was used to determine the anisotropy spin wave gap at the phase transition, expected from spin wave theory to close with a critical exponentβ0identical to the one of the order parameter,β0 =β. Our results indicate that the gap in YEMO indeed closes atTN=72.4(3)K withβ0=0.24(2), while the in-pressure gap in YMO closes at 75.2(5) K with an exponent ofβ0=0.19(3). In addition, the low-temperature anisotropy gap was found to have a slightly higher absolute value under pressure. The consistent values obtained forβin the two systems support the likelihood of a new universality class for triangular, frustrated antiferromagnets.
Keywords:critical exponent, multiferroics, spin-wave, magnetic phase transition, applied pressure, inelastic neutron scattering
1. Introduction
In multiferroic materials the structural, magnetic, and electronic order parameters are intertwined. For this reason multiferroic materials are relevant for applications in e.g. transducers, actuators, or multi-memory devices [1–3]. Practical applications of multiferroics will in most cases require functionality at room temperature, which is as of yet discovered only in the material BiFeO3. However, the study of multiferroicity at low temperatures should help to unravel the physical mechanism behind this phenomenon [4,5]. Multiferroics are in general divided into two classes: Type-I, where the ferroelectric transition takes place at higher temperatures than the magnetic ordering, and type-II where the two ordering phenomena occur at roughly the same temperature.
One common class of multiferroics is the hexagonal rare-earth manganites RMnO3. These compounds are type-I multiferroics forRbeing Sc, Y, Ho Er, Tm, Yb and Lu [6,7]. The results presented in this paper concern the hexagonal magnaniteh-YMnO3(YMO), which has only one type of magnetic ion, and is the most studied rare-earth manganite. Additionally to being multiferroic, YMO is also a frustrated spin-2 antiferromagnet with a Curie-Weiss temperature of θCW = −500 K [8]. The
ferroelectric ordering in YMO takes place at 1258 K [9], while the magnetic ordering takes places at a
much lower temperature ofTN =72 K [8,10,11]. However, other authors report a slightly different ordering temperatures; 70 K [12] and 75 K [13,14].
We have performed experiments at YMO under zero and high applied pressure. Some of our zero-pressure experiments, however, were performed on a Eu-doped sample,h-(Y0.98Eu0.02)MnO3 (YEMO). At this low doping rate, the sample is expected to have properties very similar to YMO [15,16], which we also found in the present study. For YMO, it was earlier found by neutron diffraction up to 6 GPa pressure that the applied pressure increased the ordering temperature with approximately 1 K/GPa [13,14], but reduced the average ordered moment [17].
In this study, we are concerned with the nature of the magnetic phase transition in YMO and YEMO. In general, physical systems exhibiting a phase transition can be classified according to the value of their critical exponents. Systems sharing the same critical exponents behave identically close to the phase transition, independent on the details of the model that describes their physics. For the triangular Heisenberg antiferomagnet, there are indications that frustration may lead to a separate universality class [18,19], which could pave the way to understanding differences in the appearing phases and the nature of phase transitions in such frustrated systems in general.
Here we investigate the critical exponent,β, in several different ways. We use neutron diffraction to measure the magnetic ordered signal and inelastic neutron scattering to observe the spin wave signal. We record the spin wave gap and the ordered magnetic moment as a function of temperature: in zero pressure (YMO and YEMO) and in a hydrostatic pressure of 1.5 GPa (in YMO). We find that the Néel temperature in YMO increases from 71.3(1) K to 75.2(5) K with applied pressure of 1.5 GPa and that the ordered moment is reduced. The critical exponent of the phase transition is very small, β = 0.206(3)for the most accurate determination (YEMO). Both observations are in accordance with (some of) the earlier studies. When approaching the phase transition, the spin wave gap reduces from∆=2.1 meV at base temperature to zero atTNwith an apparent critical exponent ofβ0=0.24(2), which is consistent with the elastic data within one standard deviations. In applied pressure, the spin wave gap also tracks the Néel temperature with a similar behavior as in zero pressure.
In summary, we find similar critical behaviour for YMO and YEMO. In addition, we do not find any evidence that the critical behavior changes upon application of pressure,i.e.the system remains in the same universality class with a very small value ofβ, which could be a universality class particular for frustrated, triangular systems. The particular energies of the microscopic interactions are, however, affected by pressure, as observed in the increase of the ordering temperature and the value of the anisotropy gap.
2. Experimental Details
The crystal structures of h-YMnO3 and h-Y0.98Eu0.02MnO3 are hexagonal with equal lattice constants of a = b = 6.108 Å (measured in the current work) and c = 11.39 Å. The unit cell of h-YMnO3is shown in Figure1along with the magnetic structure, which is a 3-sublattice “120 degree structure” within the basal(a,b)planes and stacked along thec-direction; most likely as one of the two options shown in Figure1[21]. For the YEMO sample, 2% of the yttrium spacers are replaced with europium, the spin of which is expected to be paramagnetic at the temperatures used in this work.
O
Mn
Mn
Y
a b c
P6'3cm' P63cm
Figure 1.Left panel shows the unit cell of YMO with the Mn layers highlighted with green and blue (drawn using Vesta [20]). On the right, two possible candidates for the structure of the magnetic ground state are displayed. The 3D spin structure is projected on the(a,b)plane, bonds symbolize the in-plane interactions in the two layers are colored in blue and green, see [21].
sample piece appear to be of mostly good quality with a single phase with limited mosaicity. Small, completely misaligned grains were found in the largest sample piece. These grains are, however, too small to contribute significantly to the neutron scattering signal.
For experiments at zero pressure, a large sample rod of YEMO with a mass of 5.25 g was mounted with glue on an aluminum holder.
For pressure cell experiment, two smaller pieces of the YMO (370 mg and 232 mg) were co-aligned and mounted in a clamp pressure cell. The pressure transmitting medium was a 1:1 mix of Fluorinerts FC-75:FC-77. The applied pressure was monitored in-situ at low temperature by measuring the lattice compression of a small NaCl single crystal co-mounted with the sample, and using its reported equation of state [22]. During preparation, the two pieces of YMO became misaligned inside the cell. The experiment was therefore carried out using the data from only the larger piece, while the signal from the smaller, misaligned piece contributed only to the elastic and inelastic background. Data was taken in the same set-up both in zero and 1.5 GPa pressure.
ILL-type Orange cryostats were used in all experiments to control the temperature of the samples.
Inelastic measurements were carried out at the cold-neutron triple-axis spectrometer RITA-II at the Paul Scherrer Institute (PSI), CH. The instrument was configured in the monochromatic imaging mode [23,24] with a constant final energy of 5.0 meV for the experiment without pressure cell and 4.6 meV for the experiment with pressure, giving an energy resolution of 0.2-0.3 meV, depending on energy transfer and resolution inq-space of 0.015 r.l.u.. The incoming collimation was 80’ without pressure cell and 40’ with pressure cell. The imaging mode gives RITA-II a natural outgoing collimation of 40’. A Be-filter was placed on the outgoing side for both experiments to reduce contamination from second-order neutrons.
Elastic measurements were carried out at RITA-II using two settings; the monochromatic three-axis imaging mode and the two-axis mode. Both set-ups had an incoming collimation of 80’ and a Be-filter out going. Additional elastic measurements were done at the thermal triple-axis spectrometer EIGER, PSI using a final energy of 14.64 meV giving an energy resolution of 1 meV. A pyrolytic graphite filter was placed on the outgoing side to reduce contamination from second-order neutrons.
3. Experimental Results: Neutron diffraction
(100) (000) (100) (000)
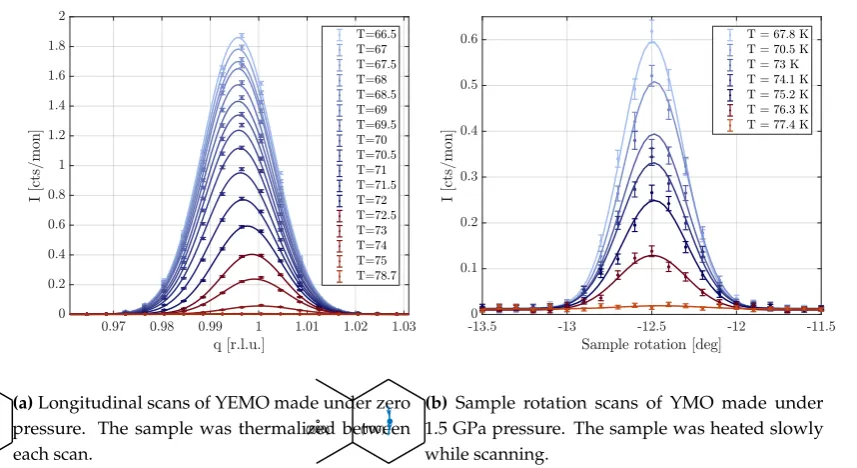
(a)Longitudinal scans of YEMO made under zero pressure. The sample was thermalized between each scan.
(100) (000)
(b) Sample rotation scans of YMO made under 1.5 GPa pressure. The sample was heated slowly while scanning.
Figure 2.The magnetic Bragg peak atq= (100)measured at RITA-II in three-axis mode. The red and blue colors indicate scans made above and below the critical temperatures respectively.
Even with our relatively goodq-resolution, the expected Lorentzian broadening from short-range magnetic order [25] was not seen, even in the critical region just aroundTN. For that reason, we have fitted all data with single Gaussians. The found intensities are plotted as a function of temperature in Figure3. All fitting parameters can be found in FiguresA1andA3in the appendix.
In zero pressure (Figure2a) the intensity of the magnetic Bragg peak in YEMO is seen to decrease as the temperature approachesTN, but a clear signal lingers aboveTN and must be identified as critical scattering, despite the lack of visible signal broadening. In the longitudinal scans a small shift in the peak position is visible. The shift indicates a change of 0.05% in the lattice parameters close toTN. The data in Figure2bis obtained under applied pressure of 1.5 GPa, and stems from sample rotation scans of the peak atq= (100), where the YMO sample is aligned in the(a,b)plane. Scans were made while both heating and cooling the sample slowly, though only the heating data is shown here. The data at zero pressure (not shown) is consistent with the high pressure ones, with the modification that the ordering temperature is here a few Kelvin lower.
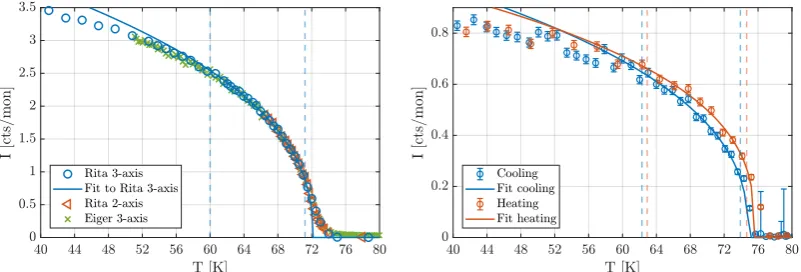
In order to ensure that the data obtained were independent of the experimental conditions,e.g. the energy resolution, the intensity of the magnetic Bragg peak atq= (100)in YEMO in zero pressure was measured as a function of temperature under three different experimental conditions: cold TAS (RITA-II), thermal TAS (EIGER), and cold two-axis (RITA-II without analyzer). The peak intensities obtained in the three experiments are shown together in Figure3a.
In the cold TAS experiment, longitudinal scans were performed and intensities were obtained by Gaussian fits. In the two-axis experiments (no raw data shown), sample rotation scans in the(a,b)
(a)Data on YEMO at zero pressure. The data shown is measured using three different experimental setups: RITA-II three-axis mode, RITA-II two-axis mode, and Eiger three-axis mode. Errorbars not shown, as they are smaller than markers.
(b)Data on YMO in a pressure of 1.5 GPa. We display both data taken during cooling and data taken during heating.
Figure 3. Fitted intensities of the magnetic Bragg peak atq = (100)as a function of temperature measured under different conditions. The fitting region is indicated by the colored dashed lines. The resulting fit parameters can be seen in table1.
and the temperature was shifted by 0.79 K to compensate for the temperature drag of the sample inside the cryostat.
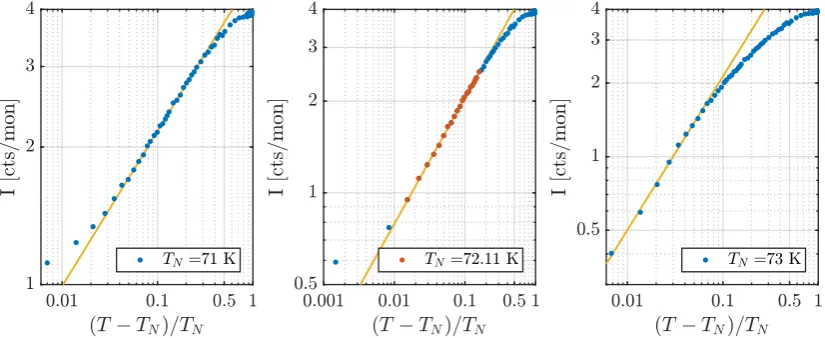
The three measuring methods are found to give identical results in terms of curve shape, including the amount of critical scattering found around and aboveTN. We have aimed to obtain an estimate ofTNandβby a power law I ∝(1−T/TN)2β fit to the intensities in the critical region of the cold TAS intensities in Figure3. Since the standard method of subtracting the critical scattering from short-range order [25] did not apply in the present case, we have adopted a method, where we directly fit the diffraction data from the long-range order in a region where the contamination from short-range order is negligible. To identify the correct fitting range within the critical region as well as an approximate value ofTN, double logarithmic plots of the intensities versus the reduced temperature,t= (TN−T)/TN, were used for different values ofTN. The approximate value ofTN was then chosen as the one which would give the largest critical region (straight line in the log-log plot; see appendix, FigureA2). The final power law fit was then performed with bothβandTNas free parameters. The fitting region found is from 60 K to 71.5 K corresponding to a reduced temperature range oft=0.012−0.17. The fit yields the valuesTN=72.11(5)andβ=0.206(3).
73.9 K for the cooling data, and 62.9 – 74.7 K for the heating data, which is indicated in Figure3bas the red and blue dashed lines. For the cooling data this yieldedTN=74.9(4)K andβ=0.20(2), while the heating data yieldedTN =75.6(8)K andβ=0.17(4). It should be noted that the two estimates for TNare within 1.3 K of each other and that the two estimates forβare consistent within the statistical error, as expected. A naive average of the two values would estimate the true Néel temperature as TN =74.9(2)K and critical exponentβ=0.19(2). For the YMO data at zero pressure, the very same fitting range was used as for the YEMO data, yieldingTN =71.3(5)K andβ=0.22(2)upon heating; data not shown.
4. Experimental Results: Inelastic neutron scattering
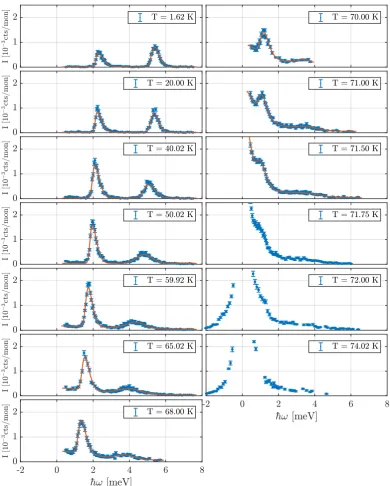
In Figure4, selected energy scans at constantq = (100)measured at three temperatures are displayed for both YEMO at zero pressure and for YMO in applied pressure. The full data set is shown in FigureA6in the appendix. Two distinct magnon modes are observed at 1.6 K in zero pressure for YEMO in Figure4a: one at 2.3 meV and one at 5.4 meV. These values are in complete agreement with literature for YMO [6,12,26]. The lower mode is gapped due to the anisotropy of the system. As the temperature is increased, the two modes move to lower energies. The lower mode increases in amplitude until 60 K and then falls off towardsTN. The width in energy of the mode stays constant. At temperatures close toTN, quasi-elastic critical scattering broadens out from zero energy, making it increasingly difficult to follow the position of the lower mode. The upper mode has a constant integrated intensity from base temperature until around 60 K, but here the width of the mode increases. Above 60 K, the upper mode becomes very broad and the intensity decreases until it finally disappears atTN. The constantqscans through the magnon modes reveal Gaussian-shaped peaks but with a pronounced skew. This skewness is due to a combination of the instrument resolution for the momentum transfer and the measurement at the minimum of the magnon mode where the density of states follows a step function. Close toTNa Lorentzian function with a center in ¯hω=0 meV has been added to fit the critical quasi-elastic scattering. All fitting parameters as a function of temperature can be found in FigureA8in the appendix.
Energy scans for YMO in an applied pressure of 1.5 GPa have been performed at four temperatures in an energy interval that covers the lower magnon mode (see Figure4b). The magnon mode behaves qualitatively similar in pressure, moving to lower energies for higher temperatures. The signal to background ratio is 2 due to the small sample mass and the bulky sample environment. Despite this, a peak position can be found using a simple Gaussian function. A Lorentzian function has been used to fit the broad elastic signal.
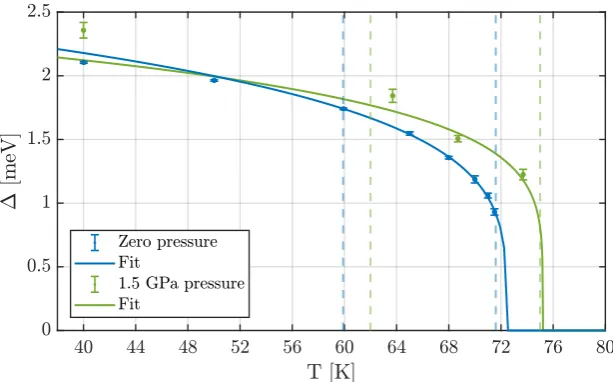
In Figure5, the position of the lower spin wave mode is plotted as a function of temperature for both zero pressure (YEMO) and 1.5 GPa (YMO). For a skewed Gaussian, the center and peak maximum are different and the difference depends on the skew parameter. We have therefore chosen to use the position of the peak maxima, which has been found numerically from the fitting function, in Figure5. It is naively assumed that the maximum positions have the same error as the peak center found in the fitting routine.
The excitation gap,∆, for spin waves in an anisotropic Heisenberg model, as it is realized in YMO and YEMO, is expected to be proportional to the effective spin. This result from the spin-wave approach directly leads to the proportionality∆ ∝hSi[27]. The excitation gap, also showing a critical behavior∆ ∝(1−T/TN)β
0
is therefore expected to have the same critical exponent as the (sublattice) magnetization,β=β0. Indeed, the data in Figure5follows∆ ∝(1−T/TN)β
0
(a) Measured intensities at selected temperatures for the zero pressure experiment on YEMO.
(b)Intensities at all temperatures for the YMO experiment with applied pressure of 1.5 GPa.
Figure 4.Inelastic energy scans above the magnetic Bragg peak atq= (100)showing the two magnon modes.
with the values obtained from the elastic data within one and two standard deviations respectively.
Since there are three data points in the critical region for the inelastic data in applied pressure, an estimate of the critical exponent can be found by lockingTNto the naive average value obtained from the elastic measurements for heating and cooling (TN(1.5GPa)=75.2(5)K). Fitting in the same critical range as for the data from the elastic measurements with applied pressure, yields a critical exponent of β0=0.19(3), which is consistent with the value obtained from the elastic measurements within one standard deviation.
5. Discussion
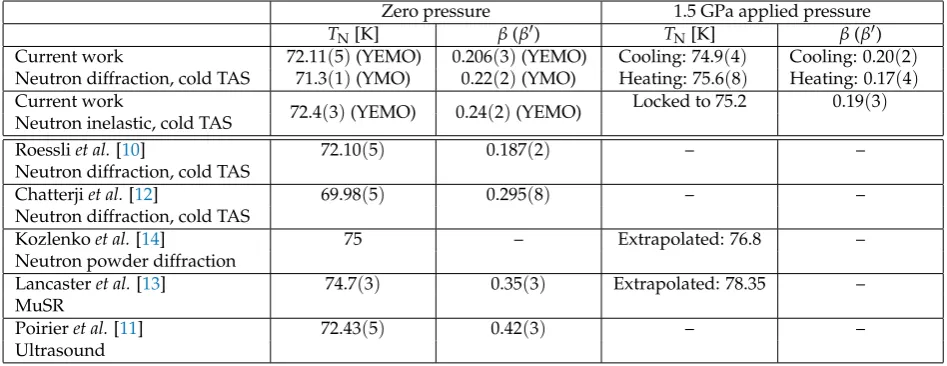
We first note that for clarity we have collected the main results from this neutron scattering work in Table1, along with corresponding literature results, where a number of experimental methods have been applied. We then proceed to discuss our findings individually.
Secondly, we note that some of our results are measured on pureh-YMnO3(YMO) and some with a low level of Eu doping (YEMO). In agreement with literature, the two samples differ so little in physical and crystallographical properties that only elemental analysis (in our case gamma spectroscopy) can differentiate them. Therefore, we assume that their phase transition properties are strongly comparable, and below we therefore discuss the two samples in combination.
5.1. The critical parameters and the critical region
Figure 5.The anisotropy gap of the lower spin wave as a function of temperature. The data is fitted with a power law in the critical ranges indicated by the dashed lines. Zero pressure data is from YEMO, while applied pressure data is from YMO.
The traditional approach to findTNandβin neutron diffraction is to fit the scattering signal with two components; a resolution limited Gaussian and a broader Lorentzian signal from the critical scattering close toTN. This approach was not applicable in our experiment, since the width of the signal stays constant as seen in FigureA1. Instead we have used the double-logarithmic method as described in Section3. We believe this to be a robust approach to determine the critical diffraction signal. With this method, an unwanted signal from short-range order scattering peaking atTNwould reveal itself as an upturn of the signal at low values oftin the double-logarithmic plot. On the other hand, effects of extinction and deviation from universality at lower temperatures would be revealed as a downturn from the linear behaviour in the double-logarithmic plot at high values of the reduced temperaturet, and therefore be discarded by the method, as demonstrated in the Appendix. A linear behaviour over a larget-range in the double-log plot would indicate that none of these effects are present and that the critical behaviour analysis is therefore valid.
We have measured the phase transition with three different neutron scattering methods with energy resolutions of respectively 0.2 meV, 1 meV, and about 5 meV. These three methods will yield very different integration of quasielastic fluctuations just aroundTN. However all are found to display the same critical behaviour, as seen in Figure3a, and again indicating the robustness of our method for this particular system.
Roessli et al. used a cold-neutron triple axis instrument with an energy resolution of
∆E=0.18 meV (FWHM) and foundTN =72.10(5)K andβ=0.187(2)[10]. Their range of fitting the critical behavior is not directly mentioned in the publication, but from their illustrations it seems to be 66 K to 71 K. As in the analysis of our present work, they made no attempt to subtract critical scattering of short-range order from the total signal.
Table 1.Summarizing table for the estimated critical temperatures,TN, and critical exponents,β, for
the various experiments in this work and in other publications. The data is for YMO, unless specifically stated otherwise
Zero pressure 1.5 GPa applied pressure
TN[K] β(β0) TN[K] β(β0)
Current work
Neutron diffraction, cold TAS
72.11(5)(YEMO) 71.3(1)(YMO)
0.206(3)(YEMO) 0.22(2)(YMO)
Cooling: 74.9(4) Heating: 75.6(8)
Cooling: 0.20(2) Heating: 0.17(4) Current work
Neutron inelastic, cold TAS 72.4(3)(YEMO) 0.24(2)(YEMO)
Locked to 75.2 0.19(3)
Roessliet al.[10]
Neutron diffraction, cold TAS
72.10(5) 0.187(2) – –
Chatterjiet al.[12]
Neutron diffraction, cold TAS
69.98(5) 0.295(8) – –
Kozlenkoet al.[14]
Neutron powder diffraction
75 – Extrapolated: 76.8 –
Lancasteret al.[13] MuSR
74.7(3) 0.35(3) Extrapolated: 78.35 –
Poirieret al.[11] Ultrasound
72.43(5) 0.42(3) – –
that a subtraction of Lorentzian tails has been performed - although not mentioned directly. We believe that this subtraction may have taken away too much of the true long-range order signal due to the uncertainties associated with the weak short-range order signal, thereby underestimatingTN and yielding a too large value ofβ.
The critical parameters were also estimated from muon spin rotation by Lancasteret al. [13]. They foundTN = 74.7(3)K with a critical exponent ofβ = 0.35(3). For the determination ofTN, Lancasteret al.used the midpoint between 0% and 100% ordered volume fraction, which is a 4 K wide temperature range. The muon is a local probe that measures on a very long timescale (~µs) compared to that of neutron scattering (~ps). Hence, the ordering temperature measured by muon spin rotation is likely to be (slightly) lower than that measured by neutron scattering. The difference in time scale can therefore not explain the difference in the critical temperatures measured with the two methods. One explanation for the higherTNcould be impurities in their sample, which would be able to lift the frustration locally, thereby also giving a distribution of ordering temperatures. For the determination ofβ, Lancasteret al.fit a stretched-exponential to the full temperature range from 2 K and up. In our view, this weakens the validity of their data analysis. The 3 data points within the critical region close to the critical temperature lie on a curve that is also consistent with aβaround 0.2 if a value ofTNjust above 72 K is assumed.
Poirieret al.[11] used ultrasound measurements to estimate the critical parameters. They obtain TN =72.43(5)K andβ=0.42(3). Their estimate of the Néel temperature is consistent with our results, while the critical exponent differs significantly. The ultrasound method is an indirect spin probe and it is sensitive to elastic deformations of the crystal structure. A strong magneto-elastic coupling has been reported by Leeet al.[8] after Poirieret al.presented their work. Leeet al.claim to observe a relative shift in the Mn position of 3.3% over the critical region in temperature. This has not been taken into account in the data analysis by Poirieret al., which could explain the discrepancy between their results and our.
account of the critical temperature,TN =72.11(5)K for YEMO, and the critical exponentβ≈0.21 for both samples,
Turning to the precise value of the Néel temperature: Eu doping has earlier been found to slightly lowerTN[15], so in the light of our results for YEMO, it is likely that the true value for YMO lies in the range 72-74 K. In addition, the muon data, although potentially less accurate, definitely show an ordered moment at 72 K. For that reason it must be concluded that the Néel temperature ofh-YMnO3 is at least of that value, questioning the findings of Chatterjiet al.. In addition, the critical exponents agree fairly well between our work and that of Roessliet al.(β=0.187(2)), adding to the confidence in our results.
Discussing the inelastic measurements, Chatterjiet al.investigated theT-dependence on the spin wave spectrum [12]. However, the group did not report the spin wave spectrum close to the Néel temperature. In addition, they measured the spin wave spectrum only at point in reciprocal space away from theΓ-point in reciprocal space. Although not explicitly mentioned, the energy resolution of their scans indicate that the temperature dependence was taken using a thermal-neutron triple axis instrument, so that they can follow the lowest lying excitation only down to 1.8 meV, which happens more than 10 K fromTN.
In our work, we measured the spin excitations at theΓ-point, where the excitations have no dispersion. In addition, we use a cold-neutron triple axis with a superior energy resolution, allowing us to follow the lowest energy excitation down to 0.6 meV (1.2 meV in pressure), which takes place less than 1 K (1.5 K in pressure) away fromTN. For this reason, we were able to follow the closure of the spin wave gap closer to the phase transition, making our measurements a more reliable account of the critical behaviour of the inelastic scattering.
5.2. Pressure effect of the magnetic order and phase transition
Based on our elastic data and using the same approach as described above, we find that an applied pressure of 1.5 GPa increases the ordering temperature with 3.9 K, fromTN(0 GPa)=71.3(5)K toTN(1.5GPa) = 75.2(5)K. This is in general agreement with earlier neutron diffraction studies by Kozlenkoet al.[14,17]. They show that the pressure indeed increases the Néel temperature, and based on measurements at zero pressure and applied pressures of 6.7 GPa they estimate a linear relationship of the formTN =75.0+1.2pK, wherepis the pressure in GPa, which extrapolates toTN =76.8 K at p=1.5 GPa. They attribute this to the increase of exchange interaction when the volume - and thus the inter-atomic distances - decreases. This slope is significantly smaller than the results of our single crystal studies and the muon studies. This strongly indicates that the change of the Néel temperature is not linear at higher pressures.
The refinement of the magnetic data in [17] shows that the spin direction of the Mn3+ions turn gradually 90◦between 0 and 9 GPa, going from the pureΓ1structure over a mixedΓ1+Γ2structure to a pureΓ2structure at 9 GPa. The ordered moment decreases from 3.27µBat zero pressure to 1.52µBat 5 GPa. Kozlenkoet al.[14], and earlier Parket al.[28], attributed this to the concurrent existence of a spin liquid phase. This phase is also claimed responsible for the lowering of the ordered magnetic moment at zero pressure from the expected 4.0µBfor (S = 2) Mn3+, as well as for the increase in diffuse scattering at the Néel temperature and at applied pressure. This effect was attributed to the restoration of perfect triangular symmetry within the layers by pressure.
pressure, and b) the out-of-plane couplings are assumed to increase with pressure.
Our in-pressure neutron diffraction study shows a good agreement with this behaviour with a slope of around 2.6 K/GPa; with the present uncertainties, the deviation from the earlier study is not significant. Additionally, we measure the critical exponent of YMO toβ=0.19(2)which agrees with the zero-pressure data ofβ=0.22(2)within errorbars.
The spin excitations at theΓpoint were also measured in applied pressure, allowing us to track the anisotropy gap as a function of temperature. AtT=40 K, the anisotropy gap in pressure was increased by 0.25 meV inp =1.5 GPa compared with the zero pressure data. Though the Néel temperature could not be determined independently for the inelastic data, the critical exponent was obtained to be β=0.19(3), in accordance with our neutron diffraction measurements.
5.3. The universality class of h-YMnO3
The magnetic excitations inh-YMnO3can be well understood in terms of a Heisenberg model with an in-plane anisotropy. The exchange interactions are strongly frustrated, and couple the spins in all three directions, whereas the coupling out of plane were earlier found by us to be at least one order of magnitude smaller [21]. The anisotropy in spin space makes the one-to-one assignment of this system to a universality class difficult. In our experiments, we deduce the critical exponentβto be in the rangeβ=0.17−0.24, with a clear majority in the range 0.19 - 0.22. All these values are consistent within their standard deviations.
Looking up critical exponents from the literature, we find β = 0.19 for the 3D Ising model, β = 0.25 for 2D Chiral XY system, β = 0.30 for a chiral Heisenberg model and an even larger exponent for the 3D Heisenberg model[18]. Note that a smaller critical exponent leads to a larger order parameter close to the critical region. In the Ising model, only fluctuations of one type are present, thus allowing for a larger order parameter and thus smaller critical exponent. Moving towards the XY model or the Heisenberg model, two or three components of the spin operator are allowed to fluctuate, thus suppressing the order parameter stronger and increasing the critical exponent.
Firstly, we note that despite the 3D Ising model having a close match of the critical exponent with our data, such a model is not capable to explain the inelastic neutron data from our earlier experiments [21]. Secondly, even though the 2D or 3D Heisenberg models with fluctuations in all spin components seem to be the most relevant model, the critical exponent of these models do not at all match our observations. In contrast, the fluctuations in the frustrated, anisotropic system are found to be much less effective, testified by the measured small critical exponent of our investigation. We should here note that for the material VCl2, that is also an anisotropic triangular antiferromagnet, a value ofβ=0.20 has been measured, a value remarkably close to our findings [18]. We find it likely that the strong frustration in both materials is causing this behavior at criticality, strengthening the case for a separate universality class for frustrated antiferromagnets.
order in a Heisenberg model. Turning now to the consequences of the pressure on the universality class of the system, we find no experimental evidence for a change of the value ofβupon application of pressure. Thus there is no indication that the universality class is altered by pressure.
6. Conclusion
We have carefully studied the antiferromagnetic magnetic phase transition ofh-YMnO3and h-(Y0.98Eu0.02)MnO3by neutron diffraction. For The Eu-doped sample, the Néel temperature is found to be consistent between three different set-ups: TN = 72.11(5) K. For the pure sample, we find TN(0 GPa) = 71.3(5)K, whereas this temperature increases at applied pressure toTN(1.5 GPa) = 75.2(5)K.
The critical exponents agree within errorbars for the two samples and for zero and applied pressure, namelyβ=0.206(3)for the doped sample andβ(0 GPa) =0.22(2)andβ(1.5 GPa) =0.19(2) for the pure sample. In our view, this favors the previous results of Roessliet al. over the rather different findings of Chatterjiet al..
By inelastic neutron scattering, we find that the anisotropy gap in the spin wave spectrum closes in almost the same way as for the diffraction measurements. Assuming that∆ ∝hSi, we find the ordering temperatures of 72.4(3) K and 75.2(5) K, for zero and applied pressure, respectively. The critical exponents are also very similar with values of β = 0.24(2) and 0.19(3), respectively. Thus, applying pressure to the system does not change the critical exponent within our statistical errors.
The low value ofβ ≈0.20 found consistently in all our measurements are in agreement with those of the similar material VCl2. A possible explanation is that frustrated triangular magnets are in a separate universality class with an unusually low value ofβ.
Acknowledgments:The project was supported by the Danish Research Council for Nature and Universe through ”DANSCATT“. This work is based on experiments performed at SINQ, Paul Scherrer Institute (CH). We would like to thank Henrik Rønnow for useful comments on our data analysis, and Dharmalingam Prabhakaran for conversations regarding the sample.
Author Contributions:S. Holm-Dahlin and K. Lefmann conceived and designed the experiments; S. Holm-Dahlin, C. Niedermayer, J. White, A. Fennel, and K. Lefmann performed the experiments; E. Pomjakushina produced the single crystal sample; S. Janas and S. Holm-Dahlin analyzed the data; A. Kreisel contributed to the data interpretation and discussion; S. Holm-Dahlin, S. Janas, A. Kreisel and K. Lefmann wrote the manuscript with input from all co-authors.
Conflicts of Interest:The authors declare no conflict of interest.
Appendix Diffraction data fits
Figure A1.Overview of the parameters used in the Gaussian fits for the elastic, zero pressure data for YEMO at theq= (100)magnetic Bragg peak measured at RITA-II in triple-axis mode. Figures show from left to right: amplitude, center, width, and background.
Figure A2.Zero pressure double-logarithmic plot for various estimates ofTN(YEMO), as well as the
trueTN=72.11(5)K obtained from the fit in Figure3a. The straight lines are overlain as a guide to the
eye. For the value ofTN=72.11 K, the linear range for fitting is estimated as 60-71.2 K.
Figure A3.Overview of the parameters used in the Gaussian fits for the elastic, applied pressure (1.5 GPa) data for YMO at theq= (100)magnetic Bragg peak measured at RITA-II in triple-axis mode. Figures show from left to right: amplitude, center, width, and background.
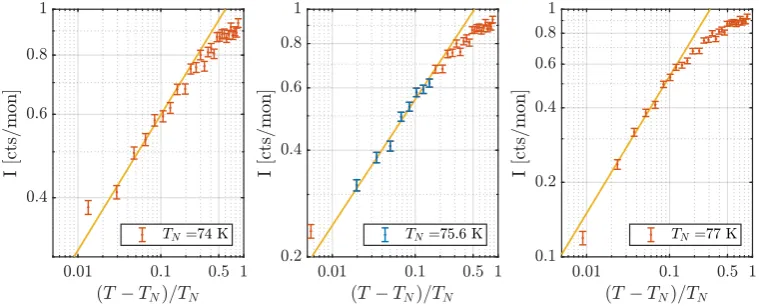
Figure A4.Double logarithmic plot for applied pressure data taken while cooling the YMO sample for various estimates ofTN, as well as the trueTNobtained from the fit in Figure3b,TN=74.9(4)K. The
straight lines are overlain as a guide to the eye. For the value ofTN=74.9 K, the linear range for fitting
is estimated as 62.3 – 73.9 K.
Figure A5.Double logarithmic plot for applied pressure data taken while heating the YMO sample for various estimates ofTN, as well as the trueTNobtained from the fit in Figure3b,TN=75.6(4)K. The
straight lines are overlain as a guide to the eye. For the value ofTN=75.6 K, the linear range for fitting
Appendix Inelastic Neutron scattering data
The inelastic data for YEMO in zero applied pressure on is shown in FigureA6, while the inelastic data for YMO in applied pressure is shown in Figure4b. For temperatures belowT =71.75 K the peaks were deemed sufficiently separated to allow fitting to extract the peak position. The data was fitted with the function below, consisting of two skewed Gaussians for the magnon modes and a Lorentzian centered atE=hω¯ =0 nearTNfor the elastic signal:
I(E) =Imagnon1(E) +Imagnon2(E) +ILorentz(E) = √I1
2πσ1
exp(−(E−µ1)
2
2σ12
)
1+erf
γ1(√E−µ1) 2σ1
+√I2
2πσ2
exp(−(E−µ2)
2
2σ22
)
1+erf
γ2(E−µ2)
√
2σ2
+I0 σ 2 0
E2+ (σ0/2)2+Bkg,
whereIjrefers to the peak intensity,σjto the width,µjto the peak center,γjto the peak skewness, and
Bkgto the background. Additionally, the subscript 1 refers to parameters for the lower magnon mode, subscript 2 to the upper magnon mode, and subscript 0 to the elastic mode. The fitting parameters for this function versus temperature for the zero pressure data can be seen in FigureA8. Also shown is the integrated intensity for each magnon,R
Idq=∑Ijσj.
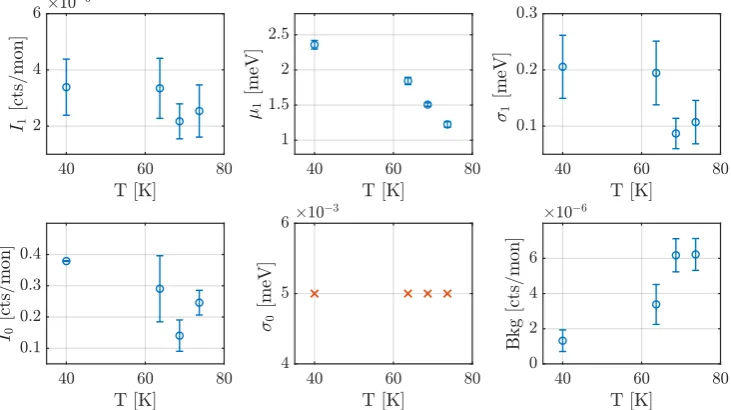
The inelastic data for YMO in applied pressure is shown in Figure4b. The data has been fit with a Gaussian and a Lorentzian in ¯hω=0, as described in the formula above. However, since the data is of a poorer quality, allowing for a variable skew cannot be justified, and the skew for the magnon has been locked toγ = 0. Additionally, the width of the Lorentzian has been fixed to the appropriate width for theT=40Kdata.
Figure A7.Fitting parameters of the inelastic YMO measurements in applied pressure (1.5 GPa). The upper row are parameters pertaining to the lower magnon mode, and the lower row pertains to the elastic peak, as indicated by the respective subscripts.Iis the peak intensity,σthe width, andµthe
Figure A8.Fitting parameters and integrated intensity of the inelastic YMO measurements in zero pressure. Here the upper row are parameters pertaining to the lower magnon mode, the middle row pertains to the upper magnon mode and the lower row pertains to the elastic peak, as indicated by the respective subscripts.Iis the peak intensity,σjis the width,µjis the peak center,γjis the peak skewness,Bkgrefers to the background, andR
References
1. Hill, N.A. Why Are There so Few Magnetic Ferroelectrics? J. Phys. Chem. B2000,104, 6694–6709. doi:10.1021/jp000114x.
2. Lee, S.; Ratcliff, W.; Cheong, S.W.; Kiryukhin, V. Electric field control of the magnetic state in BiFeO3single
crystals.Appl. Phys. Lett.2008,92, 192906.
3. Catalan, G.; Scott, J.F. Physics and Applications of Bismuth Ferrite. Advanced Materials2009,21, 2463. doi:10.1002/adma.200802849.
4. Spalding, N.A.; Fiebig, M. The renaissance of Magnetoelectric Multiferroics. Science2005,309, 391–392. doi:10.1126/science.1113357.
5. Cheong, S.W.; Mostovoy, M. Multiferroics: a magnetic twist for ferroelectricity.Nature Mater.2007,6, 13–20. doi:10.1038/nmat1804.
6. Petit, S.; Moussa, F.; Hennion, M.; Pailhès, S.; Pinsard-Gaudart, L.; Ivanov, A. Spin Phonon Coupling in Hexagonal Multiferroic YMnO3. Phys. Rev. Lett.2007,99, 266604. doi:10.1103/PhysRevLett.99.266604.
7. Sim, H.; Oh, J.; Jeong, J.; Le, M.D.; Park, J.G. HexagonalRMnO3: a model system for two-dimensional
triangular lattice antiferromagnets. Acta Cryst. B2016,72, 3–19. doi:10.1107/S2052520615022106. 8. Lee, S.; Pirogov, A.; Kang, M.; Jang, K.H.; Yonemura, M.; Kamiyama, T.; Cheong, S.W.; Gozzo, F.; Shin, N.;
Kimura, H.; Noda, Y.; Park, J.G. Giant magneto-elastic coupling in multiferroic hexagonal manganites.
Nature2008,451, 805–808. doi:10.1038/nature06507.
9. Gibbs, A.S.; Knight, K.S.; Lightfoot, P. High-temperature phase transitions of hexagonal YMnO3. Phys.
Rev. B2011,83, 094111.
10. Roessli, B.; Gvasaliya, S.N.; Pomjakushina, E.; Conder, K. Spin fluctuations in the stacked-triangular antiferromagnet YMnO3. J. Exp. Theor. Phys. Lett.2005,81, 287–291. doi:10.1134/1.1931017.
11. Poirier, M.; Laliberté, F.; Pinsard-Gaudart, L.; Revcolevschi, A. Magnetoelastic coupling in hexagonal multiferroic YMnO3 using ultrasound measurements. Phys. Rev. B 2007, 76, 174426.
doi:10.1103/PhysRevB.76.174426.
12. Demmel, F.; Chatterji, T. Persistent spin waves above the Néel temperature in YMnO3. Phys. Rev. B2007,
76, 212402. doi:10.1103/PhysRevB.76.212402.
13. Lancaster, T.; Blundell, S.J.; Andreica, D.; Janoschek, M.; Roessli, B.; Gvasaliya, S.N.; Conder, K.; Pomjakushina, E.; Brooks, M.L.; Baker, P.J.; Prabhakaran, D.; Hayes, W.; Pratt, F.L. Magnetism in Geometrically Frustrated YMnO3under Hydrostatic Pressure Studied with Muon Spin Relaxation. Phys.
Rev. Lett.2007,98, 197203. doi:10.1103/PhysRevLett.98.197203.
14. Kozlenko, D.P.; Mirebaeu, I.; Park, J.G.; Goncharenko, I.N.; Lee, S.; Park, J.; Savenko, B.N. High-pressure-induced spin liquid phase of multiferroic YMnO3. Phys. Rev. B2008,78, 054401.
15. Namdeo, S. Synthesis and characterization of novel perovskite multiferroics. PhD thesis, Devi Ahilya University, 2014.
16. Goian, V.; Kamba, S.; Kadlec, C.; D. Nuzhnyy, P.K.; Moreira, J.A.; Almeida, A.; Tavares, P. THz and infrared studies of multiferroic hexagonal Y1−xEuxMnO3(x=0−0.2) ceramics. Phase Transitions2010,
83:10-11, 931–941. doi:10.1080/01411594.2010.509603.
17. Kozlenko, D.P.; Kichanov, S.E.; Lee, S.; Park, J.G.; Savenko, B.N. Pressure-induced spin fluctuations and spin reorientation in hexagonal manganites. J. Phys.: Condens. Matter.2007,19, 156228.
18. Collins, M.F.; Petrenko, O.A. Triangular antiferromagnets.Canadian Journal of Physics1997, pp. 605–655. doi:10.1139/cjp-75-9-605.
19. Murtazaev, A.K.; Ramazanov, M.K.; Badiev, V.K. Phase Transitions and Critical Properties of the Frustrated Heisenberg Model on a Layer Triangular Lattice with Next-to-Nearest-Neighbor Interactions. Journal of
Experimental and Theoretical Physics2012,115, 303–308.
20. Momma, K.; Izumi, F.VESTA3for three-dimensional visualization of crystal, volumetric and morphology data. J. Appl. Cryst.2011,44, 1272–1276. doi:10.1107/S0021889811038970.
B.M.; Lefmann, K. Magnetic ground state and magnon-phonon interaction in multiferroic h-YMnO3. Phys.
Rev. B2018,97, 134304. doi:10.1103/PhysRevB.97.134304.
22. Skelton, E.F.; Webb, A.W.; Qadri, S.B.; Wolf, S.A.; Lacoe, R.C.; Feldman, J.L.; Elam, W.T.; Carpenter, E.R.; Huang, C.Y. Energy-dispersive x-ray diffraction with synchrotron radiation at cryogenic temperatures.
Review of Scientific Instruments1984,55, 849–855. doi:10.1063/1.1137856.
23. Bahl, C.; Andersen, P.; Klausen, S.; Lefmann, K. The monochromatic imaging mode of a RITA-type neutron spectrometer.Nucl. Instr. Meth. B2004,226, 667 – 681. doi:http://dx.doi.org/10.1016/j.nimb.2004.07.005. 24. Bahl, C.; Lefmann, K.; Abrahamsen, A.; Rønnow, H.; Saxild, F.; Jensen, T.; Udby, L.; Andersen, N.; Christensen, N.; Jakobsen, H.; Larsen, T.; Häfliger, P.; Streule, S.; Niedermayer, C. Inelastic neutron scattering experiments with the monochromatic imaging mode of the RITA-II spectrometer. Nuclear
Instruments and Methods in Physics Research Section B: Beam Interactions with Materials and Atoms2006,
246, 452 – 462. doi:http://dx.doi.org/10.1016/j.nimb.2006.01.023.
25. Collins, M.F.Magnetic Critical Scattering; Oxford University Press: Oxford, 1989.
26. Pailhès, S.; Fabrèges, X.; Régnault, L.P.; Pinsard-Godart, L.; Mirebeau, I.; Moussa, F.; Hennion, M.; Petit, S. Hybrid Goldstone modes in multiferroic YMnO3studied by polarized inelastic neutron scattering.Phys.
Rev. B2009,79, 134409. doi:10.1103/PhysRevB.79.134409.
27. Lovesey, S.W.Theory of neutron scattering from condensed matter; Vol. 2: Polarization effects and magnetic scattering, Clarendon Press, 1984.
28. Park, J.; Park, J.G.; Jeon, G.S.; Choi, H.Y.; Lee, C.; Jo, W.; Bewley, R.; McEwen, K.A.; Perring, T.G. Magnetic ordering and spin-liquid state of YMnO3. Phys. Rev. B2003,68, 104426. doi:10.1103/PhysRevB.68.104426.
29. Gao, P.; Chen, Z.; Tyson, T.A.; Wu, T.; Ahn, K.H.; Liu, Z.; Tappero, R.; Kim, S.B.; Cheong, S.W. High-pressure structural stability of multiferroic hexagonalRMnO3 (R= Y, Ho, Lu). Phys. Rev. B2011,83, 224113.
![Figure 1. Left panel shows the unit cell of YMO with the Mn layers highlighted with green and blue(drawn using Vesta [20])](https://thumb-us.123doks.com/thumbv2/123dok_us/8046989.1340367/3.595.123.478.88.209/figure-left-panel-shows-layers-highlighted-green-vesta.webp)