A Survey on Tumor Node Detection in PET/CT image based on
Image Fusion
M. Mohanasundari1, D. Kaviya2
1Assistant Professor (Selection Grade), Department of Computer Science & Engineering, Velalar College of
Engineering and Technology, TN, India
2 M. E. Scholar, Department of Computer Science & Engineering, Velalar College of Engineering and
Technology, TN, India
ABSTRACT
To enhance the spatial and spectral resolution from several low resolution images, image fusion is required. Image fusion based on Discrete Wavelet Transforms (DWT) is one of the superior methods because it is a multi resolution approach, it allows image decomposition in different kinds of coefficients and provides directional information. DWT based fusion methods and Haar wavelet based fusion method are used in literature when compared to pixel averaging method, select maximum and minimum method. In the present work, contourlet transform and neural networks are integrated to exploit the classification capabilities of neural networks to fuse PET and CT image. The fused images of the proposed method are more complete with minimum distortion and eliminate most of the visual artifacts.
Keywords : Tumor, Image Fusion, Discrete Wavelet Transforms (DWT), Positron Emission Tomography (PET), Computed Tomography (CT)
I.
INTRODUCTIONA. Image Processing
Image processing is processing of images using mathematical operations in which any form of signal processing can be done by passing the input as an image, such as a photograph or video; the output may be either an image or a set of characteristics or parameters related to the image. Most of the image-processing techniques involves treating the image as a two-dimensional signal and applying standard signal-processing techniques to it.
It usually refers to digital image processing, but analog and optical image processing also are possible. The acquisition of images (producing the input image first) is referred to as imaging.
B. Digital Image Processing
Digital image processing uses computer algorithms to perform image processing on digital images. As a subcategory of digital signal processing, it has many advantages over analog image processing. It allows wider range of algorithms to be applied for the input data so that it can avoid problems such as the build-up of noise and signal distortion during processing. Since images are defined in two dimensions
(perhaps more) digital image processing may be modeled in the form of multidimensional systems.
What is an image?
Figure 1.1: An image - an array or a matrix of pixels arranged in columns and rows.
In a (8-bit) grayscale image each picture element will be assigned with an intensity which ranges from 0 to 255. A grayscale image normally a black and white image, but the name emphasizes that it will also include many shades of grey.
Figure 1.2: Each pixel has a value from 0 (black) to 255 (white). The possible range of the pixel values depend on the color depth of the image, here 8 bit = 256 tones or grayscales.
Figure 1.3: A true-color image assembled from three grayscale images colored red, green and blue.
Such an image may contain up to 16 million different colors.
Colors:
Science communication includes the two main color spaces, they are RGB and CMYK.
RGB
The RGB color model relates very closely to the way a person perceives a color with the r, g and b receptors in the retinas. RGB uses additive color mixing and it is the basic color model used in television or any other medium which projects color with light. This is the basic color model used in computers and for web graphics, but it cannot be used for print production.
In Photoshop while using the “screen” mode for the different layers in an image, it will make the intensities mix together according to their additive color mixing model. This is analogous to the stacking slide images on the top of each other and shining light through them.
Figure 1.4: The additive model of RGB. Red, green, and blue are the primary stimuli for human color perception and are the primary additive colors.
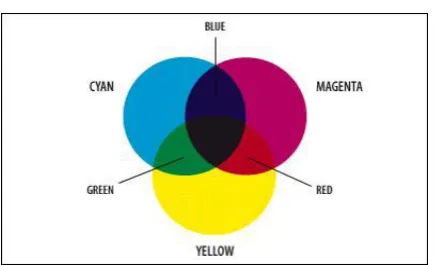
CMYK
The 4-colour CMYK model is used in printing lays down overlapping layers of varying percentages of transparent cyan (C), magenta (M) and yellow (Y) inks. In addition to that a layer of black (K) ink can be added. The CMYK model will make use of the subtractive color model.
Figure 1.5: The colors created by the subtractive model of CMYK don't look exactly like the colors
created in the additive model of RGB, CMYK cannot reproduce the brightness of RGB colors.
C. Image Fusion Fundamentals
An Image is a two-dimensional quantity. It can be viewed as the combination of illumination and reflectance. Illumination stands for the amount of light from the source which is falling on the object and reflectance corresponds to the amount of light which gets reflected from the same object.
Sensor is a device which converts the incoming energy into an electrical signal. In case of an image sensor, the reflected energy will be converted into corresponding electrical signal. The sensor array gives an array of signals. The sampling presented in the spatial domain is performed by the sensor array. These signals are quantized in order to obtain a digital image representation. This complete process is termed as digitization which is shown in Fig 1.6(c). Thus, the visual information present in the scene can be captured in the form of a digital image f(x,y)using a sensor array. All the elements in the sensor array are of same modality. Hence the image captured using a sensor array is simply referred to as single sensor image capture. The details of a scene can be captured using multiple sensor arrays, each operating in a different wavelength range. This is termed as multi sensor image capture.
(a) Single sensor
(b) Single sensor array and its corresponding image represented as a matrix
(c) Digitization process.
Figure 1.6: Single sensor imaging
Visual information present in a scene can be captured as an image using a charge coupled device
(CCD). The wavelength of the visible (VI) light that can be captured by CCD sensor ranges from 400 nm to 700 nm. However, in most of the computer vision applications, CCD image alone is not sufficient to provide all the details of the scene. This can be done by capturing images in wavelengths other than the VI band of the electromagnetic spectrum.
Fig 1.7: The electromagnetic spectrum
Table 1.1: Electromagnetic wavelength range
Usually objects with more than 0 K emits radiations throughout the IR spectrum. The energy emitted by these objects can be sensed by IR sensors and displayed as images for the end users. However, these images alone are not sufficient to provide accurate description about the targeted scene. Hence, required information from VI spectrum also needs to be integrated for better scene understanding.
single image. Whereas, MRI can capture soft tissue information present in the brain. For a radiologist, fused image obtained from these two images will be helpful in computer assisted surgery and radio surgery for better diagnosis and treatment.
D. Types of Image Fusion Systems
Image fusion systems are broadly classified as single-sensor image fusion system (SSIF) and multi-single-sensor image fusion system (MSIF) In SSIF using a single sensor, sequence of images of the same scene are captured and useful information of these several images is integrated into a single image by the process of fusion. In noisy environment and in some illumination conditions, human observers may not able to detect the objects of interest which can be easily found from the fused images of that targeted scene. Digital photography applications such as multi-focus imaging and multi-exposure imaging (Li and Kang, 2012) come under SSIF. However, these fusion systems have their drawbacks. They depend on conditions like illumination and dynamic range of the sensors. For example, VI sensor like digital camera can capture visually good images in high illumination conditions. However, they fail to capture visually good images at low illumination condition such as night, fog and rain.
To overcome the difficulties of SSIF, MSIF systems are introduced to capture images in adverse environment conditions. In MSIF, multiple images of the same scene are captured using various sensors of different modalities to acquire complementary information. For example, VI sensors are good in high lighting conditions. However, IR sensors are able to capture images in low lighting conditions. Required and necessary information of these images are combined into a single image by the process of fusion. Applications such as medical imaging, military, navigation and concealed weapon detection fall under MSIF category.
I. LITERATUREREVIEW
A. Alzheimer’s Disease Diagnosis using Landmark-Based Features from Longitudinal Structural MR Images
A landmark-based feature extraction framework is proposed for AD diagnosis using longitudinal structural MR images. Different from traditional longitudinal studies, our method
Does not require the time-consuming nonlinear registration and tissue segmentation,
Can cover the representative morphological abnormalities from the whole brain, and
Is able to handle the inconsistency among longitudinal scans.
time-consuming steps of both nonlinear registration and tissue segmentation in the application stage. In addition, our method can also extract unified feature representations for subjects with different numbers of longitudinal scans, which is typical in the longitudinal studies. These two merits make our method suitable for clinical practice, where efficient diagnosis with the capability of dealing with the problem of inconsistent scan numbers is desired.
B. Random Walk and Graph Cut for
Cosegmentation of Lung Tumor on PET-CT Images
The effect of Random walk is utilized to provide initial lesion detection on PET which will be used as object seed sets for PET and CT and also as an initial shape model for tumors in CT images. The co-segmentation problem is an energy minimization problem. As a graph-based method, the performance of the graph cut method is largely controlled by the energy function. We proposed a novel energy function which is well adjusted to the characteristic of PET and CT images. The energy function for both PET and CT segmentation has two terms, region term and boundary term. For PET, the region cost consists of three components, a cost based on SUV distribution, a downhill cost and a three-dimensional (3D) derivate function. The downhill cost is based on the analysis of tumor uptake. The 3D derivative feature is formulated using the Hessian matrix combined with Gaussian functions. For CT, a shape constraint term is integrated into the region cost function. To get consistent results between PET and CT, a context term which penalizes the difference between them is added to the energy. The optimal solution with respect to energy function minimization will be achieved in a polynomial time by computing maximum flow in the constructed graph The key novelty of our method is the incorporation of random walk and graph cut method and the cost function we design for graph cut segmentation on PET and CT. The integration of the
two methods can avoid the small cut problem in graph cut and has good performance in capturing fuzzy boundary of the tumor on PET images. The novel energy function we proposed effectively utilizes the features from both PET and CT images. Each feature has contributions to tumor segmentation. The SUV distribution feature makes our method perform well on segmentation of both homogeneous and heterogeneous tumor. The downhill feature can extract the surrounding tissues with high uptakes similar to tumor SUV and its exterior can be used as the background seeds for CT segmentation. The 3D local structure enhancement feature has the advantage of specifying the blob-like tumor objects. The shape term in the energy function for CT segmentation helps locate the tumor site.
C. Joint Segmentation of Anatomical and Functional
Images: Applications in Quantification of Lesions from PET, PET-CT, MRI-PET, and MRI-PET-CT Images
A novel framework to localize processes require precise segmentation of both functional and
anatomical images, most segmentation methods in
PET imaging are based on thresholding techniques with no clear consensus on the selection of an optimal threshold value for delineation. Hence, an accurate diagnosis or assessment of treatment response in radiotherapy procedures is very difficult as any small change in SUV measurement and morphological properties, such as metabolic activity or the gross lesion volumes, can easily affect the decision process. Region delineation must be performed meticulously and accurately in both structural and functional images for the following reasons:
Errors in segmentation can distort the calculations of SUV by altering the region’s margins,
unacceptable inter-observer variance and the variability in the anatomic image, and
Using CT or MRI for segmenting lesions that are quantitatively measured on PET can overlook and exclude other important quantitative data such as texture features in PET images.
Because of all those reasons, it has been planned to construct an automated robust segmentation method which simultaneously unifies anatomic and functional information with high precision and accuracy. It is fast and efficient enough to be used in routine clinical applications. The proposed method can be especially useful in quantifying lesions characterized by fuzzy boundaries and low contrast from surrounding normal structures. It presents a novel approach to exploit feasibility of noninvasive detection and accurate quantification of different types of pathologies via hybrid imaging modalities PET-CT and MRI-PET through a novel simultaneous joint segmentation method. Our proposed framework also included an automated pathology detection method, which helps the users in the identification of the object of interest and background regions automatically prior to delineation. We tested our method in both clinical and phantom data sets where PET, CT, PET-CT, MRI-PET, and finally MRI-PET-CT images were segmented to validate the intuition behind the co-segmentation idea. For PET image segmentation our method with the state-of-the-art methods, and also with another graph-based cosegmentation method applicable to PET-CT images with the assumption of one-to-one abnormal region correspondence between structural and functional images. In all cases, qualitative and quantitative comparisons showed that our proposed method achieves superior performance and may be used in clinical routine readily in the near future.
D. Outcome Prediction in Tumour Therapy based on
Dempster-Shafer Theory
A novel wrapper selection method based on Dempster-Shafer theory is proposed. A modified
evidential K-nearest neighbour classifier (mEK-NN) is designed at first, in which the previous evidence construction protocol of classical EK-NN is improved to achieve a more robust representation of the uncertainty about given data. Then, based on mEK-NN, a special objective function is developed to search for predictive feature subsets that lead to high classification accuracy and low overlapping between classes.In the leave-one-out cross-validation protocol, the proposed evidential feature selection (EFS) was compared with two classical wrapper methods and a widely used imbedded method, SVMRFE. The classification accuracy of SVM (Gaussian kernel with σ = 1 was empirically chosen) serves as the selection criteria in SFS and SFFS. The optimal hyper-parameters used in EFS and cutoff thresholds for all the last three methods (feature subsets selection) were determined using a rough grid search strategy. In each iteration, the selected feature subsets were used to predict the test data. The same SVM classifier was still used after SFS and SFFS, while the proposed mEK-NN was executed after EFS. Finally, the average prediction accuracy with 95% confidence interval and the selected subset size were calculated. Based on feature frequency statistics, the robustness of selection methods was evaluated using the criteria introduced, on.
High classification accuracy;
Low imprecision and uncertainty (small overlaps between different classes);
E. View-Aligned Hyper Graph Learning for
Alzheimers Disease Diagnosis With Incomplete Multimodality Data
A view-aligned hyper graph learning (VAHL) method use incomplete multi-modality data for AD/MCI diagnosis. Specifically, we first partition the original data into several views according to the availability of data modalities, and construct one hyper graph in each view using a sparse representation based hyper graph construction approach. We then develop a view-aligned hyper graph classification model to explicitly capture the underlying coherence among views, as well as automatically learn the optimal weights of different views from data. A multi-view label fusion method is employed to assemble the estimated class probability scores to arrive at a final classification decision. Results on the baseline ADNI-1 database (with MRI, PET, and CSF modalities) demonstrate the efficacy of our method in AD/MCI diagnosis. In this study, we employ all original features for hyper graph construction, while there may exist noisy or redundant information in original features. It is interesting to select those most informative features for subsequent hyper graph construction, which will be part of our future work. The experiments will be performed on the baseline ADNI-1 database with three data modalities.
The purpose of multi-view data grouping strategy is to utilize all the subjects, by grouping them in different forms of views according to the availability of data modalities. Currently, the data grouping approach can only be applied to the block-wise incomplete data problem. For more general problems such as some missing values in a specific modality for some subjects, we can first impute these missing values using some technique (e.g., EM or SVD), and then group subjects into different views.
F. Advanced Statistical Matrices for Texture
Characterization: Application to Cell
Classification
The specific and relevant part of cell characterization is particularly difficult during mitosis. To figure out these problem to design new advanced statistical matrices based on the Gray Level Size Zone Matrix. First, a multiple gray levels version which uses more information about the texture thanks to a complete gray level decomposition. It provides at least comparable results to the best original SZM on both applications, uses one less parameter, but requires more computations. In addition, two new versions, which use radial distribution and length/orientation of flat zones, in order to characterize specific DNA and microtubules aspects. These matrices showed their power and efficiency for quantitative cell analysis, and can be applied to other specific problems of texture characterization. Objective of the datasets are separated into two groups: a training sample and a validation sample. The classifier must have comparable performance levels through training and validation. But prior to the classification phase, it is necessary to construct a characteristics vector describing the data. The vector must be relevant to allow an accurate classification and prediction. The major risk in providing the classifier too many characteristics is over-fitting. The greater the characteristic vector dimension, the greater the model flexibility and the better the classification, but the poorer the model’s performance for a data set not used during the training. Then each model must systematically be validated and the best classification with the validation sample identified.
G. Spatial Evidential Clustering with Adaptive
Distance Metric for Tumor Segmentation in FDGPET Images
specificities of individual patients, as well as those of target tumors, to re-optimize the treatment plan early on during the course of treatment . The utilization of FDG-PET in adaptive radiation therapy has great benefits, including
As a complement to computed tomography (CT), FDG-PET can help to modify the gross tumor volume (GTV) definition;
FDG-PET images can be used to define sub volumes, namely biological target volumes (BTVs), within the tumor target, so as to include tumor biological characteristics in adaptive radiation therapy;
The functional information provided by PET images can predict early the treatment outcome before the end of therapy, offering significant evidence for the adaptation of a more effective treatment plan.
A new clustering algorithm tailored for the
delineation of tumor volumes in low-quality 3D PET images. The proposed method has three main
objectives:
To add textural features as complementary information for intensities that used in the above methods, so as to obtain more accurate segmentation;
To properly adapt distance metric for well representing the clustering distortions and the similarities between neighboring voxels rather than using the simple Euclidean distance directly. Different from the existing methods a sparsity constraint is included in the distance metric updating procedure to realize a feature selection via a low-dimensional feature transformation, thus limiting the influence of unreliable input features on the output segmentation;
To define a new energy function in the framework of DST using the concept of Markov random field (MRF).
By reason that MRF offers a reliable way to consider spatial information, the new MRF-based energy
function is included in the objective function of ECM, and acts as a spatial regularization to effectively quantify the local homogeneity of PET image voxels.
H. Machine Learning Applications in Cancer Prognosis and Prediction
I. Feature Generation, Feature Selection, Classifiers, and Conceptual Drift for Biomedical Document Triage
The Text Retrieval Conference (TREC) Genomics track is divided into two main tasks: First one is categorization, and ad-hoc retrieval. The categorization task is composed of two subtasks, a document triage subtask and an annotation subtask to detect the presence of evidence in the document for each of the three main Gene Ontology (GO) code hierarchies. This work mainly focused on the document triage subtask and also the ad-hoc retrieval task will be carried out.
J. A Review on Segmentation of Positron Emission Tomography Images
Positron Emission Tomography (PET), is a non-invasive functional imaging method at molecular level, images contains the distribution of biologically targeted radiotracers with high sensitivity. PET provides detailed quantitative information about many diseases and it is often used to evaluate inflammation, infection, and cancer by detecting emitted photons. In order to differentiate abnormal tissue from other areas in PET images, image segmentation plays a vital role; and therefore, accurate image segmentation is always necessary for proper disease detection, diagnosis, treatment planning, and follow-ups. In this paper, state-of-the-art PET image segmentation methods, and the recent advancement in image segmentation techniques are discussed. It also briefly explains the fundamentals of PET imaging, the challenges in diagnosing PET image, and the effects of these challenges on the segmentation results.
K. Optimal co-segmentation of tumor in PET-CT images with context information
Positron emission tomography (PET)-computed tomography (CT) images are used in clinical practice for radiotherapy treatment. Many existing approaches work for a single imaging modality,
which suffer from the low spatial resolution in PET and low contrast in CT. In this work, a novel method is proposed for the co-segmentation of the tumor in both PET and CT images, which makes it an advantage from each modality: the functionality information from the PET image and the anatomical structure information from the CT image. It formulates the segmentation problem as a minimization problem of a Markov random field model that encodes the information from both modalities. The optimization is solved by using a graph-cut method. Two sub-graphs are constructed for segmenting the PET and the CT images. To achieve consistent results in both modalities, an adaptive context cost is enforced by adding context arcs between the two sub-graphs. An optimal solution can be obtained by solving the single maximum flow problem that leads to simultaneous segmentation of the tumor volumes in both modalities. The proposed algorithm was validated in robust delineation of lung tumors on 23 PET-CT datasets. Both qualitative and quantitative results shows significant improvement when compared to the graph cut methods solely using PET or CT.
L. Robust Cancer Treatment Outcome Prediction
Dealing with Small-Sized and Imbalanced Data from FDG-PET Images
rebalancing procedure and specified prior knowledge is used to enhance the reliability and robustness of selected feature subsets. The proposed system aims to reduce the imprecision and overlaps among different classes in the selected feature subspace, thus improving the prediction accuracy. It has been evaluated by two clinical datasets, which shows good performance.
II.CONCLUSION
This manuscript presents co-segmenting and identifying the tumor in PET/CT/MRI images. Our approach is easy to deploy, lending itself to use easier approaches to medical systems
The proposed system reviewed a number of standards algorithm of their applications of de-noising, fusion and evaluated their performances on the basis of Mean Square Error (MSE), Peak-to-Signal Noise Ratio (PSNR) and Standard Deviation (SD).The proposed approach permits images from different modalities are combined with a manual option to reach a more informative image for human-visual purposed for source images to a weight map which contains the integrated pixel activity information, that is very useful for the medical assessment and planning for the diagnosis of the human disease in future development is to estimate and evaluate the quality of a fused image due to the selection or developing the suitable quality metric based on their applications.
III. REFERENCES
[1] C. Lian et., “Spatial evidential clustering with adaptive distance metric for tumor segmentation in FDGPET images,” IEEE Transactions on Biomedical Engineering, vol. 65, no. 1, pp. 21–30, 2018.
[2] B. Foster., “A review on segmentation of positron emission tomography images,” Computers in Biology and Medicine, vol. 50, pp. 76–96, 2014.
[3] Q. Song., “Optimal co-segmentation of tumor in PET-CT images with context information,” IEEE Transactions on Medical Imaging, vol. 32, no. 9, pp. 1685– 1697, 2013.B. Foster et al., “A review on segmentation of positron emission tomography images,” Computers in Biology and Medicine, vol. 50, pp. 76–96, 2014.
[4] U. Bagci., “Joint segmentation of anatomical and functional images: Applications in quantification of lesions from PET, PET-CT, MRI-PET, and MRI-PET-CT images,” Medical Image Analysis, vol. 17, no. 8, pp. 929–945, 2013.
[5] W. Ju., “Random walk and graph cut for cosegmentation of lung tumor on PET-CT images,” IEEE Transactions on Image Processing, vol. 24, no. 12, pp. 5854–5867, 2015.
[6] C. Lian., “Outcome prediction in tumour therapy based on Dempster-Shafer theory,” in ISBI, 2015, pp. 63–66.
[7] J. Zhang et al., “Alzheimer’s disease diagnosis using landmark-based features from longitudinal structural MR images,” IEEE Journal of Biomedical and Health Informatics, vol. 21, no. 6, pp. 1607–1616, 2017. [8] M. Liu., “View-aligned hypergraph learning for
Alzheimers disease diagnosis with incomplete multimodality data,” Medical Image Analysis, vol. 36, pp. 123–134, 2017
[9] C.Lian., “Robust cancer treatment outcome prediction dealing with small-sized and imbalanced data from FDG-PET images,” in MICCAI. Springer, 2016, pp. 61– 69.
[10] G.Thibault., “Advanced statistical matrices for texture characterization: application to cell classification,” IEEE Transactions on Biomedical Engineering, vol. 61, no. 3, pp. 630–637, 2014.
[11] Konstantinakourou, themis P.Exarchos, Konstantinos P.Exarchos Michalis, V.Karamouzis Dimitrios I fotiadis, “Machine learning applications in cancer prognosis and prediction”, computational and structural biotechnology journal, Vol 13, PP 8-17, 2015.