3D high resolution images for objects different in colors using
laser scanning system
Muaath J. Mahmoud1, Mehdi M. Shellal2, and Ayad Z. Mohammed2.
1
Department of Materials Research, Laser Research Center, Ministry of Science and Technology, Baghdad, Jadria, Iraq.
2
Department of Laser and Optoelectronic Engineering, University of Technology, Baghdad, Industry Street, Iraq.
Abstract
In this paper, a newly-developed compact 3D laser scanning system is presented. It consists of: a red line semiconductor laser source has a wavelength (650 nm) and of (<5mw) power. Stepper motor which has a (2048 steps) to rotates object 360 degrees in horizontal directions. A driver card model ULN2003. Arduino UNO microcontroller that is connected to a computer which programmed through an (Arduino c program) to control the rotational speed and direction of stepper motor. A high definition CMOS imager has been used in order to gather information about the body under test by capturing laser pulses reflected from that object. The scanning process includes: laser transmission, scanning, optical image capturing, image saving, processing of image. Plotting the 3D model for all object points is achieved by a computer through the LabVIEW software.
Keywords: 3D laser scanner, laser line shape, CMOS sensor, LabVIEW, and image processing.
1. Introduction
A 3D scanner is a system that collects data from a real-world object, then converts it to three dimensional digital model. The goal of a 3D scanner is to make a points cloud of the real-world object. These points can then be used to generalize the shape of the object [1].
A 3D laser scanning system is a comprehensive technological one, which includes: a laser source, computer image sampling, image processing, numerical control, computer-aided design (CAD), and precision mechanisms [2].
In general, the 3D laser scanning technology has many features which are: quick speed, ease of handling, high precision, smooth data processing, and anti-interference ability that are cannot be achieved using other types of scanners [3].
In latest years and due to the developments in laser sources, computer technology, and graphics processors that led to use 3D models in science, reverse engineering, and many other applications. Because of the increased request for 3D models, a low-cost 3D scanning systems have been developed [4].
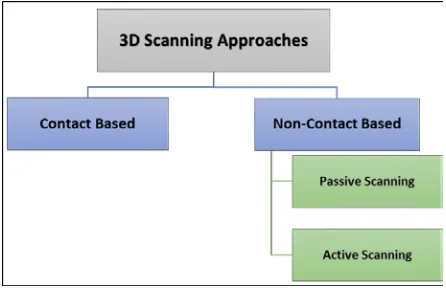
The scanning process involves an interaction between the laser beam (electromagnetic energy) and the target. So the laser radiation is the first requirement of energy source pointed to the target to illuminate its surface. Since the target is not far from the laser source, the interaction between laser beam and atmosphere that passes through it is neglected. Once the laser energy reaches the target, it interacts with target depending on the properties of both the target and the radiation. Then, the scattered energy or reflected from the target is collected and recorded by a sensor (camera). Then, the energy recorded by the sensor is transmitted, often in electronic form, to a receiving computer to monitor the information about the object. A wide number of 3D scanning methods have been developed over the last century. In general, these methods follow two primary directions: contact based and non-contact based as shown in the following sketch [5].
Fig. 1: 3D Scanning Approaches.
captured by the camera to cover the surface of the object as shown in fig.(2) [6].
Fig. 2: A schematic diagram of the most common setup.
The 3D laser scanner systems have wide-range of applications [7]. Some of them are described below: • Industrial Measurements
• Cultural Heritage • Reverse Engineering • Medical Sciences
• Applications of Human Body Digitization [8]–[11].
2. Experimental Setup
The 3D scanning systems comprises from hardware and software's.
2.1 The hardwares
In the hardware part, the system consists of the following elements:
1- Rotative platform, to carry the target that want to be scanned.
2- Stepper motor, to rotate the Platform.
3- Driver Card, to control the speed of motor
rotation.
4- Line laser source, to provide electromagnetic energy pointed to the target to illuminate its surface.
5- Arduino card, to control the operation of all the devices (above).
6- HD Webcam Camera, to sense and record the
reflected energy of laser beam.
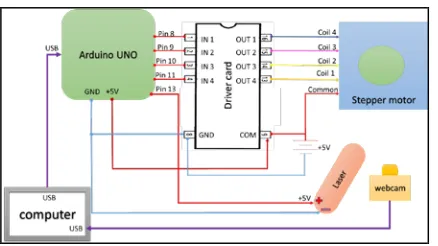
7- PC Computer, all the scanning process is
achieved by a personal computer as shown in fig. (3).
Fig. 3: A schematic diagram of the proposed 3D laser scanner system.
The overall Hardware components of laser scanning system is shown in fig. (4).
Fig. 4: Overall hardware devices of the proposed laser scanning system prototype.
The main advantages of this system are:
1. Its low cost compared to other 3D laser scanners. 2. Its low weight and compactness.
3. Its high speed scanning.
4. It's of portability, durability, reliability and safety. 5. 360o scanning and USB powered capability.
2.2 The softwares
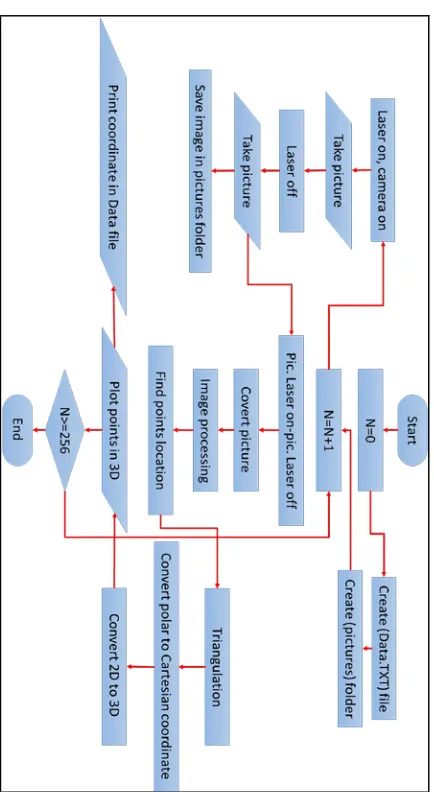
Fig. 5: A flowchart of Labview operations.
The flowchart in fig.(5) shows the sequence of LabVIEW operations in each step. It will be repeated 256 to complete one cycle (360o) depending on the Arduino program. At the beginning, a folder with a txt file must be created by the software to save the results as point coordinates of the desired shape. At the beginning of every capture step, two images are captured. One with laser “ON” and the other with the laser “OFF”. Then, these two images subtracted to obtain a clean image containing laser light only and eliminating the outside light effect. After that, the resulted image is gray scaled to remove the colors. Then, several filters are applied to get perfect line edges. Later, edge detection is used to detect the x and y coordinates of the edge points. Finally, by applying triangulation method, the location of each point is converted to 3D by adding Z-Depth and save in the 3D plotter screen.
The designed LABVIEW program have two windows, front panel window and block diagram window. Fig.(6) shows the front panel with a description of each tool.
Fig. 6: The front panel window of LabVIEW.
The front panel contains a test display that provides the user to align the camera i.e. the laser line must be passed through the center of optical axis of camera. In addition, Field of View (FOV) of camera must cover all points of the scanned object and the laser angle must be adjusted. To execute the program as shown in the flowchart in fig. (5), the start button has to be pressed. In the front panel, the “start time” indicator shows the time and date of starting of the program, the “loading” bar indicator represents the progress of the number of step that are finished so far, “laser on display” show the image when the laser is ON while, “laser off display” shows the image when the laser is OFF. The “subtract display” represents the final image after applying filters and having sharp edges. The “scanning display” denotes the edges detection filter that can find the edge points of line laser. In addition, the “x value” indicator is the output location in pixel from the edge detection filter. After applying the Triangulation method, the final location of the points can be found. The “3D plotter display” shows the plotted points in 3D for each laser line in each step. The plotted 3D object can be zoomed and rotated 360o vertically and horizontally inside that window. Finally, the “end time” indicates when the program is finished and 256 steps are completed by turning ON the complete LED and buzzer. Lastly, the “scanning time” indicator shows the time of program execution in minutes.
3. Results and Discussions
System error is calculated using equation (3.1) from which it is possible to calculate both, length and width errors [12].
(1)
Where (actual) is the real dimensions of object, and (digital) is the resultant image dimensions.
The objects that tested are:
• A cup: the material of that cup is the plastic. It has dimensions of: a length of (4.7) cm, and the diameter is (5) cm. See fig. (7 a, c, e and g). The high resolution 3D digital model is shown in fig. (7 b, d, f and h), which in turn has the following dimensions: a length of (4.9) cm and the diameter is (5.1) cm. The scanning time of all cup is the same which is (29.8) minutes. However, the length error is (3.1) % while the diameter error is (2) %.
Fig. 7: (a): The original yellow cup. (b): A 3D digital model of the yellow cup. (c): The original blue cup. (d): A 3D digital model of the blue cup.
(e): The original green cup. (f): A 3D digital model of the green cup. (g): The original red cup. (h): A 3D digital model of the red cup.
• The apple fruits: their surfaces are mostly composed of cellulosic material. They have the following dimensions: the lengths are (6.4-6.5-6.1) cm, and the diameters are (7.8, 6.9, 8.3) cm. See fig. (8 a, c, and e) respectively. The high resolution 3D digital models are shown in fig. (8 b, d, and f), which in turn have the following dimensions: lengths of (6.5, 6.6, 6) cm and the diameters of (7.9, 7.1, 8.5) cm respectively. The scanning time of green apple is (29.9) minutes, red apple is (29.5) minutes and yellow apple is (30.1) minutes. The average length error is (2.2) % while the average diameter error is (2.3) %.
Fig. 8: (a): The original green apple. (b): A 3D digital model of the green apple. (c): The original red apple. (b): A 3D digital model of the red apple. (e): The original yellow apple. (f): A 3D digital model of the
yellow apple.
From the results presented above, it is clear that the shapes and dimensions of the digital models are almost the same as the actual scanned objects despite of changing their colors. In other words, the scanning results is independent of the object color in spite of the monochromaticity of the laser.
the system is (+2.15) %. Moreover, the total average error in the system is (+2.4) %. Finally, the optimal scanning resolution is about (0.5) mm.
4. Conclusions
The following conclusions can be made:
• The system has been applied to many objects
with different colors. In general, it is found that the objects color don’t effect of scanning process.
• The digital model of each object has high
accuracy. However, the avarage length error is (+2.65) % while the avarage width error is (+2.15) %; therefore, it is possible to get effective 3D models of small scale objects. Moreover, the total average error in the system is (+2.4) %. • The average scanning time is (29.8) minutes and
it depends on the object size.
References
[1] B. Becerik-Gerber, F. Jazizadeh, G. Kavulya, and G. Calis, “Assessment of target types and layouts in 3D laser scanning for registration accuracy,” Autom. Constr., vol. 20, no. 5, pp. 649–658, 2011.
[2] Y. Zhu and A. C. F. Colchester, “Plane curve matching under affine transformations,” IEEE Comput. Graph. Appl., vol. 152, no. 6, pp. 875–887, 2005.
[3] Y. Zhou, M. Cui, and L. Yang, “Application of 3D laser scanner in topographic change monitor and analysis,” 9th Int. Conf. Electron. Meas. Instruments, vol. 38, pp. 382–385, 2009.
[4] O. Akyol and Z. Duran, “A Low-Cost Laser Scanning System Design,” J. Russ. Laser Res., vol. 35, no. 3, pp. 244–251, 2014.
[5] F. Bosche, C. T. Haas, and B. Akinci, “Automated Recognition of 3D CAD Objects in Site Laser Scans for Project 3D Status Visualization and Performance Control,” J. Comput. Civ. Eng., vol. 23, no. 6, pp. 311– 318, 2009.
[6] S. Y. Lee, Z. Majid, and H. Setan, “3D Data Acquisition for Indoor Assets Using Terrestrial Laser Scanning,” ISPRS Ann. Photogramm. Remote Sens. Spat. Inf. Sceinces, vol. 2, pp. 27–29, 2013.
[7] A. Kuş, “Implementation of 3D optical scanning technology for automotive applications,” Sensors, vol. 9, no. 3, pp. 1967–1979, 2009.
[8] N. D’Apuzzo, “Digitization of the human body in the present-day economy,” SPIE-IS&T Electron. Imaging, vol. 5665, no. 41, pp. 252–259, 2004.
[9] L. Kovacs, a. Zimmermann, G. Brockmann, H. Baurecht, K. Schwenzer-Zimmerer, N. a. Papadopulos, M. a. Papadopoulos, R. Sader, E. Biemer, and H. F. Zeilhofer, “Accuracy and precision of the three-dimensional assessment of the facial surface using a 3-D laser scanner,” IEEE Trans. Med. Imaging, vol. 25, no. 6, pp. 742–754, 2006.
[10] R. Alsarraf, “Outcomes research in facial plastic surgery: a review and new directions,” Aesthetic Plast. Surg., vol. 24, no. 8, pp. 192–197, 2000.
[11] S. T. L. S. C. Aung, C. L. Foo, “Three dimensional laser scan assessment of the Oriental nose with a new classification of Oriental nasal types,” Br. J. Plast. Surg., vol. 53, no. 23, pp. 109–116, 2000.