ISSN: 2319-8753
I
nternational
J
ournal of
I
nnovative
R
esearch in
S
cience,
E
ngineering and
T
echnology
(An ISO 3297: 2007 Certified Organization)
Vol. 2, Issue 9, September 2013
Copyright to IJIRSET www.ijirset.com
4803
Comparison of Acidic and Basic Pretreatment
on Saccharification of Water Hyacinth
Sathvik Varma V
1, Hari Narayanan T R
2, Kamala K
3, Shivashankar B
4, Jagadish H Patil
5 Corresponding author, UG Chemical Engineering student, R V College of Engineering, Bangalore, India.1UG Chemical Engineering student, R V College of Engineering, Bangalore, India.2
UG Chemical Engineering student, R V College of Engineering, Bangalore, India3
UG Chemical Engineering student, R V College of Engineering, Bangalore, India4
Assistant Professor, Chemical Engineering Department, R V College of Engineering, Bangalore, India5
Abstract: Rapid industrial expansion and development has seen increased use of fossil fuels all over the world. These fuels are being consumed at an alarming rate. Our dependence on the fuels and their rapid rate of depletion has called for measures to look for alternative fuels. Bio ethanol is one such renewable fuel which is gaining importance. It can be used as a substitute to, or as a blend with petrol. Lignocellulosic materials are found to be suitable for bioethanol production. Water hyacinth, an aquatic weed, grows in most parts of the world. The considerably lower lignin and higher cellulosic content in water hyacinth makes it a good raw material for bio ethanol production, which involves three steps, namely pretreatment, saccharification and fermentation. Pretreatment is essential to break the lignin bonds so that the cellulose and hemi cellulose content are accessible to the micro organisms which produce the enzymes for saccharification. This study addresses the effect of acidic and basic pretreatment on the saccharification of water hyacinth using Aspergillus niger as inoculums. Through this experiment, it was observed that acidic pretreatment is more suitable for the process. The highest yield of reducing sugars after saccharification was obtained on the second day after inoculation and was equal to 150µg/mL. The results from this study will be incorporated in the fermentation stage of the conversion process.
Keywords: Water hyacinth, pretreatment, saccharification, optical density, Aspergillus niger.
I. INTRODUCTION
The last century has seen a burgeoning rise in the use of fossil fuels such as petrol, diesel and coal. This has been the result of industrial development at an extremely rapid rate in many parts of the world. The fossil fuels that we use every day are produced naturally under the action of tremendous pressure and temperature in the earth’s crust. The global oil availability is practically constant because the natural formation of petroleum is a process which takes a very long time and it is not replaced at the rate at which it is being extracted. The use of conventional fuels as primary energy source has led to scarcity in fuel, climate change, environmental degradation and human health problems1.
ISSN: 2319-8753
I
nternational
J
ournal of
I
nnovative
R
esearch in
S
cience,
E
ngineering and
T
echnology
(An ISO 3297: 2007 Certified Organization)
Vol. 2, Issue 9, September 2013
Copyright to IJIRSET www.ijirset.com
4804
wastes and many other organic materials. Some crops like jatropha, copra and castor seed are also grown for the purpose of producing energy in the form of bioethanol or biodiesel and these crops are known as bio- energy crops.
The attributes of a bio-energy crop are as follows 5
Naturally grown vegetation, grows perennially.
High cellulose and low lignin content per unit volume of dry matter.
Easily digestible.
Water Hyacinth (WH) is a widely prevalent aquatic weed in India. Its high content of hemicellulose (30–55% of dry weight) can provide hemicellulosic sugars for bio- conversion to ethanol 6. The lower lignin content in water hyacinth as compared to other biomass used for the conversion process is an important parameter to be considered. The conversion of WH to ethanol is achieved in three major steps namely, pretreatment of the raw material, saccharification of complex sugar molecules to simple sugars and finally fermentation of the produced simple sugars into bioethanol 7.
The first step, called Pretreatment, is the process where cellulosic biomass is made amenable to the action of enzymes8. The main purpose of this step is to break open the lignin content to make the hemicellulose and cellulose available for the conversion process. All naturally occurring cellulosic materials require pretreatment to become accessible to the enzymes that control hydrolysis 9. Saccharification in the absence of pretreatment usually yields lesser than 20% of theoretical yields, whereas yields after pretreatment often exceed 90% of theoretical3. Some of the common methods of pretreatment are acidic pretreatment and alkaline pretreatment8. The second step is the hydrolysis of polysaccharides to soluble sugars, which is also called "Saccharification". In this step, the complex sugars are broken down to a simpler form, usually by the action of enzymes (cellulase), produced by the Saccharification micro-organisms8. In this experiment, Aspergillus niger was the fungus used to produce the cellulase required for breakdown of complex sugars. The third step, called Fermentation, is a process in which enzymes produced by microorganisms catalyze chemical reactions that break simple sugars into lower molecular weight materials such as organic acids and neutral solvents such as ethanol. A large variety of bacteria, yeasts, and fungi are of interest for fermentation10.
II. MATERIALS AND METHODS
A. Collection and preparation:
Fresh water hyacinth was collected from the Kengeri lake in the outskirts of Bangalore city, India. The leaves and stalks were separated from the rest of the water hyacinth plant and used as substrate for saccharification process.
B. Pretreatment process:
ISSN: 2319-8753
I
nternational
J
ournal of
I
nnovative
R
esearch in
S
cience,
E
ngineering and
T
echnology
(An ISO 3297: 2007 Certified Organization)
Vol. 2, Issue 9, September 2013
Copyright to IJIRSET www.ijirset.com
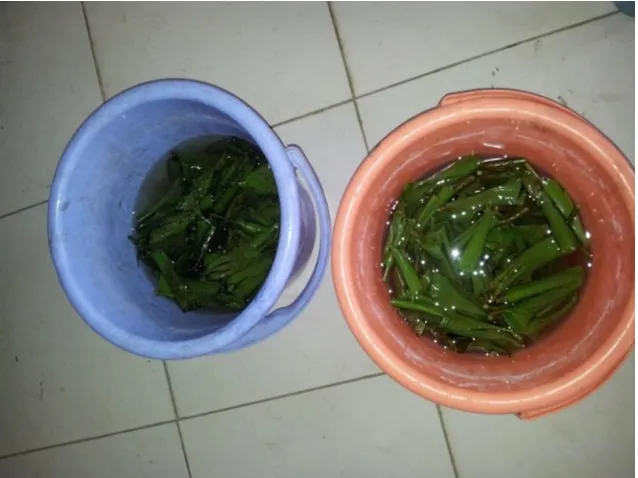
4805 Figure 2: Pretreated substrate after soaking, drying and communition.
ISSN: 2319-8753
I
nternational
J
ournal of
I
nnovative
R
esearch in
S
cience,
E
ngineering and
T
echnology
(An ISO 3297: 2007 Certified Organization)
Vol. 2, Issue 9, September 2013
Copyright to IJIRSET www.ijirset.com
4806
C. pH test for substrate:
The pH of the substrate was measured for all the 3 different types considered, namely, substrate without pretreatment, acid pretreated substrate and base pretreated substrate. For this process, 1 g of the substrate was added to 25ml of distilled water and pH was measured using a pH meter. The results are shown in table 1.
Table 1: pH values for the different samples.
D. Preparation of Saccharification media:
Modified Mendell’s media was used for the saccharification process. It consisted of the following components:
Urea (0.3 g/l)
Potassium di-hydrogen phosphate (2.0g/l)
Ammonium sulphate (1.4 g/l)
Peptone (0.75g/l)
Calcium chloride (0.3 g/l)
Magnesium chloride (0.3 g/l)
Yeast extract (0.25 g/l)
Solution was prepared using the above mentioned quantities of components. The contents of the solution were stirred to ensure uniformity. 100 ml of the prepared media was then added to each flask.
E. Addition of substrate and labelling of flasks:
250 ml Erlenmeyer flasks (12 nos.) were used for the experimental procedure. Each flask was filled with 100 ml of modified Mendell’s media. The flasks were labeled as follows: Of the twelve flasks, three flasks were maintained as control (labeled “A-C1, A-C2, A-C3”) to which substrate was not added. The other nine flasks were labeled based on the type of pretreatment used for the respective water hyacinth sample, namely, “A-A” for acid pretreated substrate, “A-B” for base pretreated substrate and “A-N” for the sample without any chemical pretreatment(neutral). The contents of the flasks are given in Table 2. All flasks were then sealed with cotton plugs and autoclaved at 25 psi for 2 hours.
Table 2: Nomenclature of flasks containing media and substrate
Flask Name Contents
A-C1, A-C2. A-C3 Media (100mL)
A-A1, A-A2. A-A3 Media (100mL) and Acid pretreated substrate (1g) A-B1, A-B2, A-B3 Media (100mL) and Base pretreated substrate (1g) A-N1, A-N2, A-N3 Media (100mL) and substrate without chemical pretreatment (1g)
F. Inoculation of fungus Aspergillus niger:
Autoclaving minimizes the chances of contamination in the flasks. All flasks were autoclaved at 120 degree Centigrade for 2 hours. The autoclaved flasks were allowed to cool in a water bath at room temperature for two hours. All the flasks were inoculated with fungus Aspergillus niger under sterile condition in Laminar Air Flow. The flasks were then sealed with the cotton plugs and kept under continuous agitation in an orbital shaker at 100 rpm at 30° C.
Type of pretreatment pH
Acid pretreated 3.10
Base pretreated 6.07
ISSN: 2319-8753
I
nternational
J
ournal of
I
nnovative
R
esearch in
S
cience,
E
ngineering and
T
echnology
(An ISO 3297: 2007 Certified Organization)
Vol. 2, Issue 9, September 2013
Copyright to IJIRSET www.ijirset.com
4807 0
0.1 0.2 0.3 0.4 0.5 0.6 0.7 0.8
0.05 0.1 0.15 0.2 0.25 0.3
Op
ti
ca
l
De
n
sity
OD
Concentration of Glucose solution in mL Standard Calibration Curve
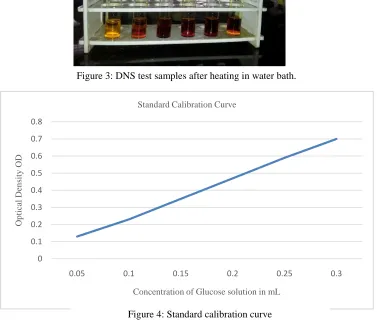
G. Standard calibration curve:
A glucose standard curve was plotted by taking a 1g/L solution of glucose and make up water in known proportions. Glucose solution and water were added to 3ml of DNS solution. The solutions were heated in a water bath and their OD values were measured at 540 nm since the absorbance is found to be highest at this wavelength. This standard curve was then used calculate the quantity of glucose produced in the experiment over 5 days. The test tubes are shown in Fig 3. The caliberation curve is shown in figure 4.
Figure 3: DNS test samples after heating in water bath.
ISSN: 2319-8753
I
nternational
J
ournal of
I
nnovative
R
esearch in
S
cience,
E
ngineering and
T
echnology
(An ISO 3297: 2007 Certified Organization)
Vol. 2, Issue 9, September 2013
Copyright to IJIRSET www.ijirset.com
4808
H. DNS Test procedure:
1.5 ml of the contents of each flask was withdrawn by means of a micro pipette. The contents were transferred to correspondingly labeled Epindoff tube. These tubes were centrifuged for 10 minutes at 13500 rpm. The contents were then allowed to rest for 15 minutes. Using a micro pipette, 0.75 ml of supernatant liquid from each tube was taken and transferred to test tubes labeled correspondingly. 3 ml of DNS reagent was added to each of the test tubes. All the test tubes were heated in a water bath for 10 minutes. The control solution was used to calibrate the colorimeter used for the measurement of optical densities (OD) of the different samples.
I. Test for reducing sugars:
Dinitrosalicylic acid test (DNS Test) was used to measure the quantity of reducing sugars produced by the saccharification process. Higher the optical density values, higher the quantity of reducing sugars produced. The test was conducted at an interval of 24 hours starting from the day after inoculation. The tests were carried out over a continuous 5- day period and the results are depicted in Table 3 and 4.The OD values of the different samples were determined at 540 nm. The corresponding OD values were used to calculate the quantity of reducing sugar in the solution. The obtained values were noted in table 5.
Table 3: OD values of the individual samples on different days.
Sample OD on Day 1 OD on Day 2 OD on Day 3 OD on Day 4 OD on Day 5
1 2 3 1 2 3 1 2 3 1 2 3 1 2 3
A-C 0.00 0.00 0.00 0.00 0.00 0.00 0.00 0.00 0.00 0.00 0.00 0.00 0.00 0.00 0.00 A-A 0.05 0.06 0.06 0.15 0.15 0.15 - 0.03 0.01 0.01 0.01 0.00 0.01 - 0.01 A-B 0.02 0.02 0.02 0.06 0.07 - 0.03 0.02 0.03 - 0.03 0.03 0.05 - 0.05 A-N - - 0.01 0.02 0.03 0.03 0.03 - 0.03 0.02 - - 0.02 0.02 0.02
Table 4: Consolidated table for OD values of different samples.
Sample OD on Day 1 OD on Day 2 OD on Day 3 OD on Day 4 OD on Day 5
A-C 0.00 0.00 0.00 0.00 0.00
A-A 0.06 0.15 0.02 0.01 0.01
A-B 0.02 0.07 0.03 0.03 0.05
A-N 0.01 0.03 0.03 0.02 0.02
Table 5: Reducing sugar yield for different samples Sample Reducing sugar
yield on Day 1 (µg/mL)
Reducing sugar yield on Day 2(µg/mL)
Reducing sugar yield on Day 3(µg/mL)
Reducing sugar yield on Day 4(µg/mL)
Reducing sugar yield on Day 5(µg/mL)
A-C 0 0 0 0 0
A-A 60 150 20 10 10
A-B 20 70 30 30 50
ISSN: 2319-8753
I
nternational
J
ournal of
I
nnovative
R
esearch in
S
cience,
E
ngineering and
T
echnology
(An ISO 3297: 2007 Certified Organization)
Vol. 2, Issue 9, September 2013
Copyright to IJIRSET www.ijirset.com
4809 0
20 40 60 80 100 120 140 160
Day 1 Day 2 Day 3 Day 4 Day 5
Re
d
u
cing
Su
gar
yie
ld
s
(µg/mL)
Days
Comparison of reducing sugars yields of the samples
Acid pretreated Base pretreated Without pretreatment
III. RESULTS
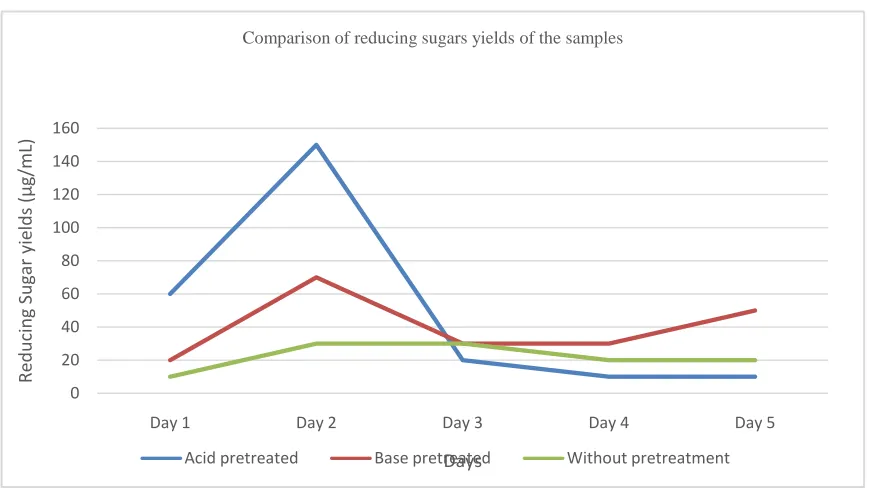
During the course of the experiment, increase in biomass was noticed in flasks labeled A-A, A-B, and A-N. No increase was seen in the control flask A-C. This suggested the inoculated spores had grown in all the flasks except those used for control. In all samples, the second day yielded highest optical density values. Thus it was inferred that that maximum reducing sugar content is obtained two days after inoculation. Among the three samples, acid pretreated water hyacinth substrate (A-A) gave the highest optical density reading and correspondingly highest reducing sugar content. The comparison of the yields of the saccharification process is shown in figure 5.
IV. CONCLUSION
The increased biomass content suggested that water hyacinth is a suitable substrate for the saccharification process. The optimum period of saccharification was found to be 2 days for all samples. Acid and basic pretreated samples gave higher OD values than the substrate without pretreatment. This highlights the importance of the pretreatment process.. Among the 3 samples considered, acid pretreated substrate yielded the highest quantity of reducing sugar content on Day 2 (150µg/mL). Thus, it was inferred that acid pretreatment is better than basic pretreatment for the saccharification of water hyacinth. The yields of reducing sugars in the different samples are given table 4.
ISSN: 2319-8753
I
nternational
J
ournal of
I
nnovative
R
esearch in
S
cience,
E
ngineering and
T
echnology
(An ISO 3297: 2007 Certified Organization)
Vol. 2, Issue 9, September 2013
Copyright to IJIRSET www.ijirset.com
4810
V. FUTURE PROSPECTS
The results from this experiment will be incorporated in the second part of the conversion process, i.e, fermentation of the reducing sugars to ethanol. Other prospects include small changes in pH of the substrate to determine the optimum pH for the saccharification process, carrying out the entire process using other micro organisms, such as Trichoderma viride or Trichoderma Reesei, studying the effect of agitation on the results, etc.
ACKNOWLEDGEMENT
The authors would like to express their gratitude to Dr. H G Ashok Kumar, Head of Department of Biotechnology, R V College of Engineering, for his invaluable technical inputs and to Mr. Armugam, Department of Biotechnology, for his guidance during the course of the experiment.
REFERENCES
1. Patil J.H, MolayanLourdu Antony Raj, Bhagyashree, Vantimar Dinesh and Rohith, “Kinetic Modeling of Anaerobic Co-digestion of Water Hyacinth
and Poultry Litter”, Research Journal of Chemical Sciences, Vol 3(6), 69-73,(2013)
2. GO. Ogawa Masami, Ishida YukinariUsui and Naoto Urano, “Ethanol production from the water hyacinth Eichhornia crassipes by yeast isolated
from various hydrospheres”, African Journal of Microbiology Research, Vol.(2), 110-113, (2008)
3. Lynd L.R, “Production of ethanol from lignocellulosic materials using thermophilic bacteria: critical evaluation of potential and review”, Advances
in Biochemical Engineering / Biotechnology 38, 1–52.(1989)
4. Parisi, F, “Advances in lignocellulosics hydrolysis and in the utilization of the hydrolysates”, Advances in Biochemical Engineering / Biotechnology
38, 53–87. (1989)
5. Anjanabha Bhattacharya and Pawan Kumar, “Water hyacinth as a potential biofuel crop”, Electronic Journal of Environmental, Agricultural and
food chemistry, ISSN 1579-4377, (2010)
6. J.N. Nigam, “Bioconversion of water-hyacinth (Eichhornia crassipes) hemicellulose acid hydrolysate to motor fuel ethanol by xylose–fermenting
yeast”, Journal of Biotechnology 97, 107–116, (2002)
7. Lynd L.R,” Overview and evaluation of Fuel ethanol from cellulosic Biomass”, Annual Review of Energy and the Environment., 21:403–65, (1996)
8. Rangarajan Hari Narayanan, Varma Sathvik V, Krishnappa Kamala, Basavaraj Shivashankar, Patil J H, “Determination of optimum period of
Saccharification of water hyacinth using Trichoderma Reesei and Aspergilus Niger”, Research Journal of Chemical Sciences., Vol 3(8), 49-52, August (2013)
9. Yi Zhenget. All, “Overview of biomass pretreatment for cellulosic ethanol production”, International Journal of Agricultural & Biological
Engineering, Vol. 2 No.3 (51), (2009)
10. K. Pillai Raji, P. Natarajan, G. M. Kurup, “Bioconversion of ligno-cellulosic residues of water hyacinth to commercial product”, International
Biannual journal of Environmental Sciences, 2 (2) : 261 - 264, (2008)
BIOGRAPHY