Article
1
Database of shear experiments on steel fiber
2
reinforced concrete beams without stirrups
3
Eva O.L. Lantsoght 1,2*
4
1 Universidad San Francisco de Quito; [email protected]
5
2 Delft University of Technology; [email protected]
6
* Correspondence: [email protected]; Tel.: +593 2 297-1700 ext. 1186
7
8
Abstract: Adding steel fibers to concrete improves the capacity in tension-driven failure modes. An
9
example is the shear capacity in steel fiber reinforced concrete (SFRC) beams with longitudinal
10
reinforcement and without shear reinforcement. Since no mechanical models exist that can fully
11
describe the behavior of SFRC beams without shear reinforcement failing in shear, a number of
12
empirical equations have been suggested in the past. This paper compiles the existing empirical
13
equations and code provisions for the prediction of the shear capacity of SFRC beams failing in shear
14
as well as a database of 487 experiments reported in the literature. The experimental shear capacities
15
from the database are then compared to the prediction equations. This comparison shows a large
16
scatter on the ratio of experimental to predicted values. The practice of defining the tensile strength
17
of SFRC based on different experiments internationally makes the comparison difficult. For design
18
purposes, the code prediction methods based on the Eurocode shear expression provide reasonable
19
results (with coefficients of variation on the ratio of tested to predicted results of 27% - 29%). None
20
of the currently available methods properly describe the behavior of SFRC beams failing in shear.
21
As such, this work shows the need for studies that address the different shear-carrying mechanisms
22
in SFRC and its crack kinematics.
23
Keywords: beams; database; experiments; flexure; shear; steel fiber reinforced concrete
24
25
1. Introduction
26
When steel fibers are added to the concrete mix, the weak tension properties of the concrete are
27
improved, as the steel fibers can carry this tension. As a result, steel fiber reinforced concrete (SFRC)
28
has superior material and mechanical behavior for all tension-driven material properties and failure
29
modes. An example of a tension-drive failure mode is shear failure [1,2]. Typically, shear-critical
30
elements are provided with shear reinforcement. However, for certain cases, providing shear
31
reinforcement may not be desirable. An example of such application is reinforced concrete one-way
32
slabs [3], where using shear reinforcement is often not cost-effective. For other cases, heavy shear
33
reinforcement and the resulting reinforcement congestion make casting concrete difficult [4],
34
especially in high performance high strength beams, so that other solutions may be more practical
35
and may lead to a better quality of the structural element. For these cases, dispersing steel fibers in
36
the concrete mix can improve the shear capacity, and reduce or eliminate the need for stirrups.
37
Bernard proposed the use of steel “splinters” to strengthen concrete in tension as early as 1874
38
[5]. Nevertheless, practical applications of SFRC are still not widespread. The main barrier to
39
application is that building codes, such as the ACI 318-14 [6] and EN 1992-1-1:2004 [7] do not contain
40
provisions for determining the shear capacity of SFRC. The most noteworthy national codes and
41
guidelines with shear provisions for SFRC are the French recommendations [8-10] and the German
42
guideline [11].
43
The currently available shear equations from codes and guidelines, as well as those reported in
44
the literature are summarized in this work. An analysis of the available expressions shows that the
45
majority are empirical equations. Expressions resulting from an analysis of the mechanics of the
46
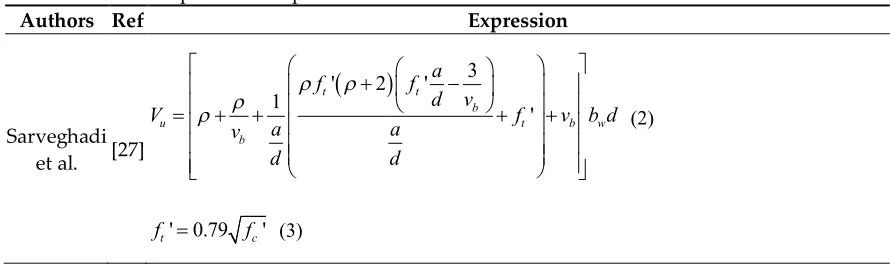
problem are scarce, with exceptions the extensions [12,13] of the Modified Compression Field Theory
47
(MCFT) [14] and the Dual Potential Capacity Model [15,16]. None of the existing expressions are
48
based on an analysis of the shear-carrying mechanisms in concrete [17]: the capacity of the uncracked
49
concrete in the compression zone [18], aggregate interlock [19], dowel action [20], and residual
50
tension across the crack [21]. For SFRC, the contribution of the residual tension across the crack may
51
be negligible, and instead the contribution of the steel fibers bridging the crack should be analyzed
52
[22]. This lack of understanding of the mechanics of the problem forms a more fundamental barrier
53
to the practical application of SFRC. To optimize structural designs, and reduce the material
54
quantities used in a project, as well as their embodied carbon and environmental impact, it is
55
important to develop better models for the shear capacity of SFRC with longitudinal steel
56
reinforcement without stirrups.
57
Before better models for the shear capacity of SFRC can be evaluated, it is necessary to gather
58
the available experimental data from the literature. This information can be used to analyze the
59
shortcomings of the current equations, and to carry out parameter studies. This paper presents a
60
unique database of 487 experiments. Smaller databases have been reported or discussed in the
61
literature previously [23-29], but the current effort has resulted in the recompilation of a significantly
62
larger number of datapoints. Moreover, the full database is available as a dataset in the public domain
63
for other researchers [30], which is a step forward as well.
64
2. Methods
65
2.1 Overview of shear prediction equations
66
The currently available expressions to predict the shear capacity of SFRC beams without stirrups
67
are mostly empirical equations. Besides the empirical equations, some methods have been derived
68
that are (partially) based on the mechanics of the problem. Noteworthy here are extensions of the
69
Modified Compression Field Theory (MCFT) [14,31] for SFRC, the Dual Potential Capacity Model
70
[15,16], and plasticity-based approaches. For the extension of the MCFT to SFRC several approaches
71
have been followed: describing the constitutive equations of cracked SFRC [32-34], assumptions for
72
smeared cracking in SFRC [35], programming the effect of fibers into the VecTor software [12,36],
73
panel testing [37], the development of an engineering model [38] for inclusion in the next version of
74
the fib Model Code [39], and the development of a model that considers the rotation of the individual
75
fibers with respect to the crack plane [40] and its closed-form solution [41]. Hwang’s softened truss
76
model with steel fibers [42] falls in the same category as the MCFT for SFRC. Most of these
MCFT-77
based methods require programming and/or the use of finite element models. The Dual Potential
78
Capacity Model [15,16] evaluates the capacity of the concrete in the compression zone and the tension
79
capacity of the SFRC in the tension zone. The drawback of this approach is that these assumptions
80
for the mechanics of the behavior do not reflect all shear-carrying mechanisms in SFRC (capacity of
81
compression zone, dowel action, tension capacity of SFRC in tension zone, aggregate interlock, and
82
arching action [17]). Plasticity-based models have been proposed in the past [43-46]. While the results
83
of these models seem promising, they require further research and validation.
84
Since the mechanical models that are available in the literature each have drawbacks as pointed
85
out in the previous paragraph, the current codes and guidelines are based on empirical models.
86
Therefore, in this section, an overview of a selection of currently available empirical prediction
87
equations and code equations is given. These prediction models will be used in Section 3 for
88
comparison to the shear capacities obtained from the literature.
89
Table 1 gives an overview of the shear prediction equations. All symbols used in Table 1 can be
90
found in the list of notations at the end. The expression by Sarveghadi et al. [27] is a simplification of
91
a matrix-based expression resulting from an analysis testing different artificial neural networks.
92
Many expressions describe the steel fiber properties with the fiber factor F. The fiber factor is a metric
93
used for defining the properties of the fibers, taking into account the fiber volume fraction Vf, the
94
aspect ratio Lf/df, and the bond properties of the fiber ρf:
f f f f l F V d
(1)
96
The expression of Kwak et al. [47] follows the form of Zsutty’s empirical equation for the shear
97
capacity of reinforced concrete beams [48], with vb as given in Eq. (4). The Greenough and Nehdi [49]
98
expression, which is a simplification of an expression resulting from genetic programming, uses a %
99
for ρ instead of the actual reinforcement ratio.
100
Khuntia et al. [50] ‘s expression is a proposal to include the effect of fibers on the expression for
101
the shear capacity of ACI 318-14 [6]. Similarly, Sharma [51]’s proposal follows the format of the ACI
102
318-14 code expression, and links the tensile and compressive strength of concrete through the
103
expression by Wright [52]. Mansur et al. [53] also propose an extension of the ACI 318-14 code
104
expression, using σtu as recommended by Swamy and Al-Ta’an [54], which uses the fiber length
105
correction factor ηl from Cox [55], the fiber spacing from Swamy et al. [56], and the bond stress τ
106
proposed by Swamy and Mangat [57]. Ashour et al. [58] propose two (sets of) equations: the first
107
equation, Eq. (17) is a proposal for extension of the ACI 318-14 [6] expressions, whereas Eq. (18) and
108
(19) are based on Zsutty’s [48] equation. Arslan’s [59] equations are also based on Zsutty’s [48]
109
equation, with the addition of the determination of the height of the compression zone c as proposed
110
by Zararis and Papadakis [60]. However, this method for determining c ignores the contribution of
111
the fibers on the horizontal and moment equilibrium of the cross-section.
112
The shear capacity equation from Bažant and Kim [61], derived from fracture mechanics of
113
quasi-brittle materials, was extended to include the contribution of fibers by Imam et al. [62] as well
114
as Yakoub [63] (first set of equations, Eq. (25) through (27)). The second set of equations by Yakoub
115
[63], Eq. (28) through (32)are a proposal to include the effect of fibers in the shear expressions from
116
the Canadian code CSA A23.3-04 [64], which is based on the MCFT [14].
117
The next entries in Table 1 are expressions from codes and guidelines. The expressions from the
118
French recommendations [10] separate the concrete contribution to the shear-carrying capacity from
119
the contribution of the fibers. The determination of the contribution of the fibers requires
120
experimental data of the SFRC mix, as shown in Eq. (35) through (38). An additional material safety
121
factor γE is added so that γcfγE = 1.5. The angle of the compression strut θ ≥ 30o. The value of K in Eq.
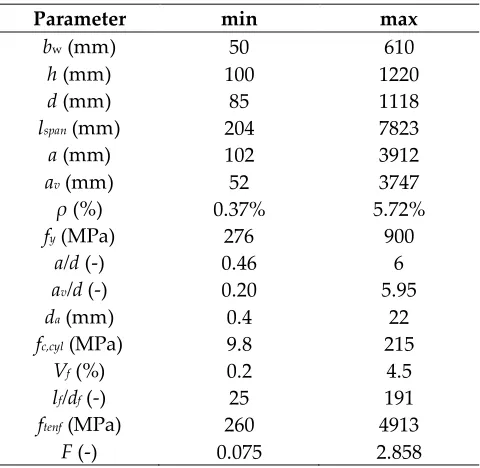
122
(36) can be approximated as K = 1.25, except when bw and h are less than 5lf, or the value of K can be
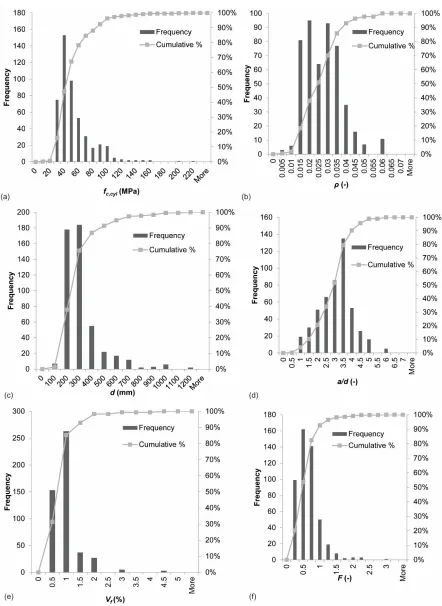
123
determined from tension tests on the SFRC mix.
124
The expressions from the German guideline [11] and RILEM [65] are based on the Eurocode EN
125
1992-1-1:2004 [7] equations, by adding a term to represent the contribution of the steel fibers. The
126
expressions from the fib Model Code [39] are based on EN 1992-1-1:2004 [7], but incorporate the effect
127
of the fibers into the original expression. In the German National Annex of the Eurocode 2, CRd,c =
128
0.15, and this value is used in Eq. (41) as well. The following factors are used: γc = 1.5, ctf = 1.25,
129
f c
= 0.85 to account for long-term effects, and f F
k = 0.5 for shear. For cross-sections subjected to
130
axial loads, the contribution of the steel fibers cannot be taken into account, as more experimental
131
results are necessary to derive suitable expressions [23]. The expressions from the German guideline
132
[11], RILEM [65], and the fib Model Code [39] are valid for ρ ≤ 2%. For the fib Model Code expressions,
133
CRd,c = 0.18 and γc = 1.5. All notations used in Table 1 are explained in the “List of notations”.
134
135
Table 1. Shear prediction equations from literature and available codes
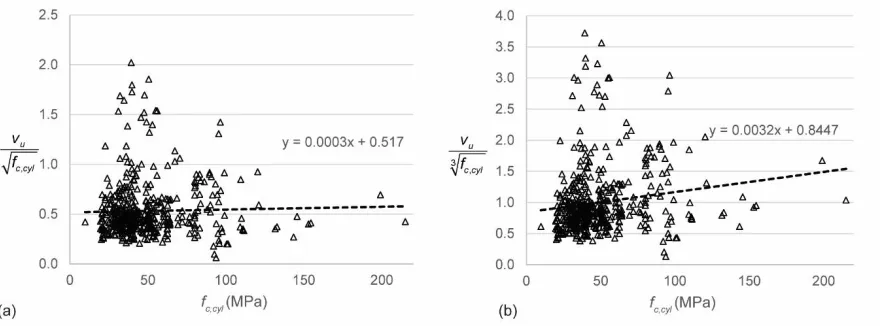
136
Authors Ref Expression
Sarveghadi et al. [27]
3' 2 '
1
'
t t
b
u t b w
b
a
f f
d v
V f v b d
a a v d d (2)
' 0.79 '
t c
0.41
b
v
F
with τ = 4.15 MPa (4)Kwak et al. [47]
1/ 3 2/ 3
3.7 0.8
u spfc b w
d
V ef v b d
a (5)
20
0.7 1.0cuf spfc f f F F
in MPa (6)
1 for 3.4
3.4 for 3.4 a d e d a a d (7) Greenough
and Nehdi [49]
0.4 0.18
400
0.35 1 ' 1 0.9
u c o w
d
V f F F b d
d a
(8) Kuntia et
al. [50] Vu
0.167 0.25 F
fc'b dw (9) Sharma [51]0.25 2
0.8 ' 3
u c w
d
V f b d
a (10) Mansur et al. [53]
u c tu w V V b d (11)
0.16 ' 17.2 0.29 '
c c w c w
Vd
V f b d f b d
M
(12)
3.2 with 2.58MPa tu o lF
(13)
tanh 2 1 2 f l f l l
(14)
2 ln m f f f G S E A r (15) 25 f f f d S V l (16) Ashour et al. [58]
0.7 ' 7
17.2u c w
d d
V f F b d
a a
(17)
0.333 3
2.11 ' 7 for 2.5
u c w
d a
V f F b d
a d (18)
0.333 3 2.52.11 ' 7 2.5 for 2.5
u c b w
d a a
V f F v b d
a
a d d
Arslan et al. [59]
2/ 3
3 3
0.2 ' 1 4 '
u c c w
c
V f F f b d
a d d (20) 2 600 600 0 ' ' c c c c
d f d f
(21)
Imam et al. [62]
0.44 35
0.6 ' 275
u c w
V f b d
a d (22) 5.08 1 1 25 a a d d d (23)
1 4F
(24)
Yakoub [63]
3
5
0.83 ' 249.28 0.405 f ' for 2.5
u c f g c w
f
l d a
V f V R f b d
d a d
a d (25) 3 5
0.83 ' 249.28 0.162 f ' for 2.5
u c f g c w
f
l a
V f V R f b d
d d a d (26) 1 1 25 a d d (27) 0.40 1300
2.5 ' 1 0.7 for 2.5
1 1500 1000
f
u c f g w v
x xe f
l d a
V f V R b d
s d a d
(28) 0.40 1300
' 1 0.7 for 2.5
1 1500 1000
f
u c f g w v
x xe f
l a
V f V R b d
s d d
(29)
max 0.9 , 0.72 v
d d h (30)
2 v x s s M V d E A
(31)
35
0.85 and 16
x
xe x x v
a s
s s s d
d
Association Française de Génie Civil [10] , ,
Rd Rd c Rd f V V V (33)
1/2 ,
0.21
Rd c ck w
cf E
V f b d
(34)
, ,
tan
vf Rd f Rd f
A
V
(35)
lim lim 0 lim , limfor strain softening or low strain hard
1 1
1 1
for high strain
ening hardening el w f cf Rd f f cf el w dw K w d K
(36)
lim max u, max
w w w (37)
lim max u, max
(38)
vf w A b z(39)
DAfStB [11]
, , ,
f
Rd c Rd c Rd cf V V V (40)
1/3,
, 100 , ,min
Rd c
Rd c ck w Rd c
c C
V k f b d V
(41)
, ,
f f c ctR u w
Rd cf f
ct f b h
V
(42)
, 0.37 ,L 2
f f f f
ctR u F G cfIk
f k k f (43)
1.0 0.5 1.7
f f
G ct
k A (44)
min ,1.5 f
ct w
A b d m (45)
200
1 mm
k
d
(46)
RILEM [65]
Rd cd fd V V V (47)
130.12 100
cd ck w
V k f b d(48)
0.7
fd f fd w
V k k b d(49)
1 f f 1.5
f w h h k n b d (50) 3 3 and
f w w
f f
b b b
n n
h h
(51)
,4 0.12
fd fRk
(52)
fib [39]
1/ 3 ,
, 100 1 7.5
Rd c Ftuk
Rd Rd f ck w
c ctk
C f
V V k f b d
f (53)
2 / 3
0.3 for concrete grades C50
2.2 Database of experiments
138
2.2.1 Development of database
139
The database developed for this study contains 487 experiments of SFRC beams with
140
longitudinal tension reinforcement (mild steel only) and without transverse shear reinforcement
141
failing in shear reported in the literature. The consulted references are: Singh and Jain [4], Sahoo and
142
Sharma [66], Shoaib, Lubell, and Bindiganavile [67] (lightweight beams), Manju, Sathya and Sylviya
143
[68], Arslan, Keskin, and Ulusoy [69], Parra-Montesinos et al. [70], Rosenbusch and Teutsch [71],
144
Sahoo, Bhagat, and Reddy [72] (T-beams), Amin and Foster [73], Tahenni et al. [74], Narayanan and
145
Darwish [75], Cucchiara, La Mendola, and Papia [76], Kwak et al. [47], Lim and Oh [77], Dinh,
Parra-146
Montesinos and Wight [78], Lima Araujo et al. [79] , Casanova, Rossi, and Schaller [80], Aoude et al.
147
[81], Minelli and Plizzari [82], Kang et al. [83], Casanova and Rossi [84], Lim, Paramasivam, and Lee
148
[44], Mansur, Ong, and Paramasivam [53], Zarrinpour and Chao [85], Noghabai [86], Randl, Mészöly,
149
and Harsányi [87], Ashour, Hasanain, and Wafa [58], Tan, Murugappan, and Paramasivam [88],
150
Pansuk et al. [89], Kim et al. [90], Sharma [51], Narayanan and Darwish [91], Li, Ward, and Hamza
151
[92], Swamy, Jones, and Chiam [93], Cho and Kim [94], Greenough and Nehdi [49], Kang et al [95],
152
Dupont and Vandewalle [96] with further information in [97], Swamy and Bahia [98], Batson, Jenkins,
153
and Spatney [99], Zhao et al. [100], Jindal [101], Shin, Oh, and Ghosh [102], Imam, Vandewalle, and
154
Mortelmans [103] [104], Huang, Zhang, and Guan [105], Kwak, Suh, and Hsu [106], Roberts and Ho
155
[107], Hwang et al. [108], Spinella, Colajanni, and La Mendola [109], Chalioris and Sfiri [110], Cohen
156
and Aoude [111], Aoude and Cohen [112], Qissab and Salman [113], Furlan and de Hanai [114],
157
Dancygier and Savir [115], Krassowska and Kosior-Kazberuk [116], Yoo and Yang [117], Gali and
158
Subramaniam [118], Zamanzadeh, Lourenco, and Barros [119], Shoaib, Lubell, and Bindiganaville
159
[120], Shoaib [121], Bae, Choi, and Choi [122], and Abdul-Zaher et al. [123]. The database does not
160
include the Keskin et al. [124] experiments, since for these specimens carbon fiber reinforced polymer
161
(CFRP) bars were used as longitudinal reinforcement. The experiments by Khan [125] are excluded,
162
as these specimens are subjected to a combination of shear, bending moment, and torsional moment.
163
Table 6 gives the database developed for this study. The full spreadsheet is available as
164
supplementary file in .xlsx format available in the public domain [30]. The notations used in this
165
database are given in the “List of notations”. For a number of references
[42,44,49,51,53,58,66,68-72,74-166
77,79,80,82-84,87,88,93,96-99,101-103,105,106,108-111,114-118,122,123,126], information about the
167
geometry of the support and loading plate was missing. These values were then approximated based
168
on figures of the test setup in the original reference. For rollers, the contact surface was assumed to
169
be 10 mm wide. Most specimens are rectangular beams, but the specimens in [72,80,93,98] are
T-170
beams, in [88,89] I-beams, and in [113] non-prismatic beams. Almost all experiments are on simply
171
supported beams in three- or four-point bending, with exception of the two-span beams in [116] and
172
the special setup by [127] for short spans that does not allow for the development of arching action.
173
In terms of geometry, references [53,68,75] do not report the total length of the beam specimen.
174
[120] only reports the total length for the largest specimens. For the database entries, a similar
175
overhang is used for the smaller specimens. [53] does not report the span length, but the span and
176
total length are estimated from the technical drawings in the original reference. The total length for
177
the beams in [51,88,96,101] was also estimated based on the technical drawings in the paper. A
178
practical value of overhang over the support is assumed for these cases. The results in [102] are
179
inconsistent: the relation between the maximum load in the figures and the shear stress in the
180
reported table is not clear. The cause of this inconsistency seems to be that the authors did not show
181
the length correctly: the sketched span length lspan appears to be the total length ltot. This correction is
182
included in the database. References [68,80,114] do not report the effective depth. For the database
183
entries, these values are then calculated back from the a/d ratio, or based on the rebar diameter and a
184
10 mm cover, as typically used in laboratory conditions on small specimens. [78] reports different
185
values for the effective depth than what can be calculated from the technical drawings. The values
186
from the drawings are used for the database. The ratio av/d reported in [116] is 2.7. For the database
187
depth is calculated assuming a cover of 10 mm. These assumptions result in av/d = 2.83; the value of
189
av/d = 2.7 can’t be reverse-engineered based on the available information. Singh and Jain [4] mention
190
that the smallest dimension of the cross-section should be at least three times the length of the longest
191
fiber in the mix. As can be seen in the database, many experiments do not fulfil this requirement.
192
Regardless of their comment, Singh and Jain proceeded to test specimens that do not fulfil this
193
requirement, for ease of comparison to other test results.
194
The concrete compressive strength in the database is fc,cyl, the average concrete compressive
195
strength as measured on cylinders. When the compressive strength is reported from cube specimens,
196
the conversion fc,cyl = 0.85fc,cube is used. Reference [101] does not give the concrete compressive strength,
197
but uses 3 ksi (21 MPa) in the presented calculation example. Therefore, the value of fc is reported as
198
21 MPa. [118] does not report the concrete compressive strength. Normal strength concrete of fc = 30
199
MPa is assumed. [49] and [111] used self-consolidating concrete. For references where the maximum
200
aggregate size is not reported [51,73,81,90,108,114,118,119], a standard laboratory mix with da = 10
201
mm is assumed. References [51,85,113,114,123,127] do not report the yield strength of the steel. For
202
these cases fy = 420 MPa is assumed. For [107], the yield strength at 0.2% strain from the stress-strain
203
diagram is used for the database.
204
When the tensile strength of the fibers was not given [49,51,70,88,96,97,99,106,107,109,110,114],
205
the value of ftenf = 1100 MPa was assumed. For recent references, this assumption is reasonable, as this
206
value is common for commercially available fibers. For the experiments by Batson [99] from 1972, it
207
is only known that low-carbon steel was used for the fibers, but the tensile strength of the fibers is
208
not known. The reported tensile strength for fibers by Ashour et al. [58] is smaller than for any other
209
reference. The same value is reported in the paper in MPa and psi units, which seems to exclude a
210
typing error in the reference. [119] used recycled steel fibers. The properties of these fibers were not
211
discussed in this reference, but for the database entries [128] was consulted. [122] does not report on
212
the fiber type and properties. Therefore, standard commercially available hooked fibers were
213
assumed. For the references where the amount of fibers is given as a mass, the fiber volume fraction
214
is calculated by dividing the mass by 7800 kg/m3. When the concrete mix contained a combination of
215
fibers [82], the reported fiber properties are weighted averages of the different fibers. Experiment B59
216
by [98] contained fibers only in the bottom 90 mm of the cross-section.
217
The results are given in terms of the sectional shear force at failure Vutot, which includes the
218
contribution of the self-weight, as well as the failure mode. Since this database includes the
219
contribution of the self-weight, the shear at failure from this database may differ from what is
220
reported in the original reference. For small specimens, the effect is small. For lightweight specimens
221
[67,83], the density as reported in the original reference is taken into account to calculate the
222
contribution of the weight. When this value was not reported in the original reference [93], a
self-223
weight of 17 kN/m3 was assumed. In some references [80], the sectional shear force at failure Vmax or
224
the applied load at failure Pmax is not included. Where possible [118,122], the load-displacement
225
diagrams are used to read off this value. When this information was not presented, the experiments
226
were not included in the database for lack of vital information. There is a factor 2 difference between
227
the shear stress at failure vmax in [101] and the value I calculated based on the size of the cross-section
228
and the sectional shear at failure Vmax. The database contains this calculated value. What [117] reports
229
as the shear force Vmax is actually Pmax, as one can see when calculating vmax. The following
230
abbreviations are used for the reported failure modes: B (bond failure of longitudinal reinforcement),
231
DT (diagonal tension), NA (the failure mode for the individual experiment is not given in the original
232
reference, but the text mentions that all experiments resulted in shear failure), S (shear failure), SC
233
(shear-compression failure), S – FL (shear-flexure), ST (shear-tension), and Y (yielding of
234
reinforcement).
235
2.2.2 Parameter ranges in database
236
This section evaluates the distribution of the values of parameters over the database, in terms of
237
ranges show that the maximum height that has been tested (1220 mm) is relatively small to evaluate
239
the size effect in shear [61,129-133].
240
Table 2. Ranges of parameters in database
241
Parameter min max
bw (mm) 50 610
h (mm) 100 1220
d (mm) 85 1118
lspan (mm) 204 7823
a (mm) 102 3912
av (mm) 52 3747
ρ (%) 0.37% 5.72%
fy (MPa) 276 900
a/d (-) 0.46 6
av/d (-) 0.20 5.95
da (mm) 0.4 22
fc,cyl (MPa) 9.8 215
Vf (%) 0.2 4.5
lf/df (-) 25 191
ftenf (MPa) 260 4913
F (-) 0.075 2.858
242
Figure 1 shows the distribution of a selection of key parameters in the database. In terms of
243
concrete compressive strength, Figure 1a shows that the results in the database are concentrated in
244
the range of normal strength concrete, with some outliers for high and ultra high strength concrete.
245
For the reinforcement ratio, one can observe in Figure 1b that most specimens have large amounts of
246
longitudinal steel, as typical for shear experiments where extra tension reinforcement is used to avoid
247
a bending moment failure. The experiments are uniformly distributed in the range from 1.5% - 3.5%
248
reinforcement. The database shows crowding in the range of small effective depths, see Figure 1c.
249
The experiments are normally distributed in terms of shear span to depth ratio, see Figure 1d, with
250
a/d = 3.5 as the most frequently used shear span. The histogram of the fiber volume fraction Vf, Figure
251
1e, shows crowding in the range of 0.5% - 1.5%. This observation is not surprising, as these fractions
252
are practical values. Similarly, the observations for the histogram of the fiber factor F in Figure 1f
253
reflect practical considerations and workability of SFRC.
254
256
Figure 1. Distribution of parameters in database: (a) concrete compressive strength fc,cyl; (b)
257
reinforcement ratio ρ; (c) effective depth d; (d) shear span to depth ratio a/d; (e) fiber volume fraction
258
Vf; and (f) fiber factor F.
259
260
3. Results
262
3.1 Parameter studies
263
First, the raw data from the database are used to analyze the effect of different experimental
264
parameters on the outcome (sectional shear stress at failure as a result of self-weight and applied
265
load). To eliminate the influence of the concrete compressive strength fc,cyl on the parameter studies,
266
normalized shear stresses are used. There is, however, quite some disagreement in the literature on
267
the effect of the concrete compressive strength on the shear capacity [134]: should we normalize the
268
shear stress with respect to the square or cube root of the concrete? Therefore, I analyzed the
269
normalized shear stress to both the square and cube root of the concrete as a function of the concrete
270
compressive strength. Figure 2 shows the relation between the normalized shear stress and the
271
concrete compressive strength fc,cyl. These results show that the shear stress should be normalized
272
with respect to the square root of fc,cyl. The influence of different parameters will thus be studied as a
273
function of the shear stress normalized to the square root of fc,cyl.
274
275
276
Figure 2. Normalized shear stresses to the concrete compressive strength: (a) normalized to the square
277
root; (b) normalized to the cube root.
278
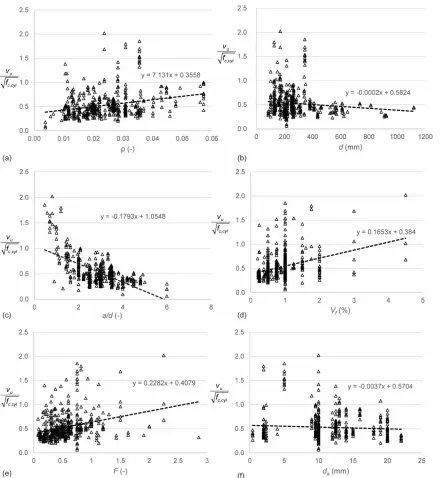
Figure 3 gives an overview of the most important parameters and their influence on the shear stress
279
normalized to the square root of fc,cyl. Figure 3a shows the influence of the reinforcement ratio ρ.
280
Larger reinforcement ratios result in larger normalized shear capacities. This observation is expected,
281
since larger reinforcement ratios result in a larger dowel action capacity [20,135,136], and thus a larger
282
shear capacity. Figure 3b shows the influence of the effective depth d on the normalized shear stress.
283
In reinforced concrete, the so-called size effect in shear [61,129-131,137,138] is known: the shear stress
284
at failure reduces as the effective depth increases. The analysis of the database shows a small size
285
effect. However, very few experiments on specimens with larger depths are available, as shown in
286
Figure 1c. More experiments are necessary to study the size effect in SFRC. Figure 3c shows the
287
influence of the shear span to depth ratio in terms of a/d. These results show that, just as for reinforced
288
concrete beams, the shear capacity for specimens with a/d ≤ 2.5 increases for a decrease in a/d. The
289
development of a compressive strut or arch between the point of application of the load and the
290
support increases the shear capacity through the shear-carrying mechanism of arching action
[139-291
141]. This influence can also be expressed as a function of the clear shear span to depth ratio av/d and
292
the generalized expression M/Vd. Since almost all experiments in the database are three- or four-point
293
bending tests, the difference between a/d and M/Vd lies only in the contribution of the self-weight to
294
M and V. For small specimens, this effect is negligible. For the current database therefore, the
295
difference between the influence of a/d and M/Vd is negligible [142]. The parameter av/d has a slightly
296
larger influence on the normalized shear stress than a/d. This observation can be explained by the
297
geometries used for deep beams in the database. Figure 3d shows the relation between the
298
normalized shear capacity and the fiber volume fraction Vf. The normalized shear stress increases as
299
across the crack. Figure 3e shows the relation between the fiber factor F and the normalized shear
301
stress. Comparing Figure 3d and Figure 3e shows that using the fiber factor F is an improvement as
302
compared to using only the fiber volume fraction Vf: less scatter is observed. Other properties of the
303
fibers that were studied [142] were the aspect ratio lf/df and the fiber tensile strength ftenf. The influence
304
of the aspect ratio is similar to the influence of the fiber factor F, with the difference that the scatter
305
on the plot with the fiber factor is smaller than for the plot with the aspect ratio. Small increases in
306
the normalized shear strength were found for increases in the fiber tensile strength ftenf. Since the fibers
307
typically do not reach their tensile strength, this observation is not surprising. Figure 3f shows the
308
influence of the maximum aggregate size da on the normalized shear strenght. The data show a minor
309
decrease in normalized shear strength for increasing maximum aggregate size. Larger aggregates
310
improve the aggregate interlock capacity [143,144], and it is often assumed that using smaller
311
aggregates in small specimens is a conservative approach. For SFRC, however, smaller aggregates
312
result in a more uniform concrete mix with a better bond between the fibers and the concrete.
313
314
315
Figure 3. Parameter studies based on normalized shear stresses for all entries in database, influence
316
of (a) longitudinal reinforcement ratio ρ; (b) effective depth d; (c) shear span to depth ratio a/d; (d)
317
fiber volume fraction Vf; (e) fiber factor F; and (f) maximum aggregate size da.
3.2 Comparison to code predictions
319
The experimental shear capacities from the database are then compared to the shear capacities
320
predicted by the code equations and equations proposed in the literature. A difficulty here lies in the
321
definition of the tensile strength of the SFRC, which is based on different experiments depending on
322
local or national practice. As such, it is not possible to build a database containing all values that
323
quantify the tensile behavior of the SFRC, as none of the references report on the outcome of all
324
possible tension tests. As a result, the equations proposed in the literature that were selected for this
325
study depend as much as possible on the concrete compressive strength instead of on the tensile
326
strength.
327
In a first step, the shear capacity was predicted with 12 sets of equations in total: Sarveghadi et
328
al. [27], Kwak et al. [47], Greenough and Nehdi [49], Khuntia et al. [50], Imam et al. [62], Sharma [51],
329
Mansur et al [53], Ashour et al [58] – first equation, Ashour et al [58] – second set of equations, Arslan
330
et al [59], Yakoub [63] – first set of equations, and Yakoub [63] – second set of equations. Table 1
331
contains all expressions. The expression by Greenough and Nehdi [49] uses the reinforcement ratio ρ
332
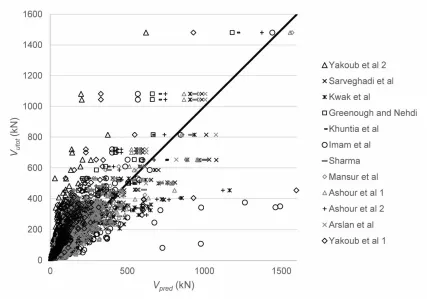
as a percentage instead of as a number. Figure 4 shows the comparison between tested and predicted
333
results, with the statistical properties of Vutot/Vpred in Table 4. Parameter studies for the influence of the
334
different parameters are reported elsewhere [142]. Since not all proposed equations are (explicitly)
335
valid for deep beams, the results for slender beams only are given in Table 6. For all datapoints, the
336
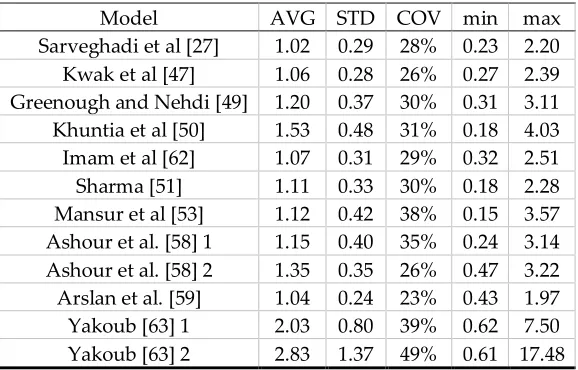
expressions by Kwak et al. [47] result in the smallest coefficient of variation on the ratio of tested to
337
predicted shear capacities, see Table 4. When only the slender beams are considered, the expressions
338
by Arslan et al. [59] result in the smallest coefficient of variation on the tested to predicted shear
339
capacities, see Table 6. In general, the scatter on the tested to predicted shear capacities is high. None
340
of the expressions predicted in the literature is based on a mechanical model that studies the
shear-341
carrying capacity of SFRC based on the mechanisms of shear transfer [17]. The expressions are
(semi)-342
empirical, and thus depend on the database of experiments they were originally derived for. When
343
developing a larger database, as part of this work, the equations do not perform well.
344
345
Figure 4. Comparison between experimental and predicted shear capacities for 12 methods from the
346
Table 3. Statistical properties of Vutot/Vpred for all 487 datapoints
348
Model AVG STD COV min max
Sarveghadi et al [27] 1.03 0.29 28% 0.23 2.49 Kwak et al [47] 1.01 0.28 27% 0.27 2.39 Greenough and Nehdi [49] 1.34 0.48 36% 0.31 3.11 Khuntia et al [50] 1.81 0.85 47% 0.18 6.53 Imam et al [62] 0.97 0.36 37% 0.06 2.51 Sharma [51] 1.24 0.49 39% 0.18 3.59 Mansur et al [53] 1.30 0.60 46% 0.15 3.85 Ashour et al. [58] 1 1.08 0.38 35% 0.24 3.14 Ashour et al. [58] 2 1.29 0.37 29% 0.31 3.22 Arslan et al. [59] 1.17 0.37 31% 0.43 3.24 Yakoub [63] 1 1.90 0.76 40% 0.28 7.50 Yakoub [63] 2 2.97 1.37 46% 0.51 17.48
Table 4. Statistical properties of Vtest/Vpred for 352 datapoints with a/d ≥ 2.5
349
Model AVG STD COV min max
Sarveghadi et al [27] 1.02 0.29 28% 0.23 2.20 Kwak et al [47] 1.06 0.28 26% 0.27 2.39 Greenough and Nehdi [49] 1.20 0.37 30% 0.31 3.11 Khuntia et al [50] 1.53 0.48 31% 0.18 4.03 Imam et al [62] 1.07 0.31 29% 0.32 2.51 Sharma [51] 1.11 0.33 30% 0.18 2.28 Mansur et al [53] 1.12 0.42 38% 0.15 3.57 Ashour et al. [58] 1 1.15 0.40 35% 0.24 3.14 Ashour et al. [58] 2 1.35 0.35 26% 0.47 3.22 Arslan et al. [59] 1.04 0.24 23% 0.43 1.97 Yakoub [63] 1 2.03 0.80 39% 0.62 7.50 Yakoub [63] 2 2.83 1.37 49% 0.61 17.48
350
Next, the experimental shear capacities are compared to the code predictions. The code
351
equations that were used for the predictions are the French recommendations [10], the German
352
guideline [11], the fib 2010 Model Code [39], and the RILEM recommendations [65]. Each of these
353
codes requires the determination of the tensile strength according to experiments described in the
354
respective codes. Since these results are not available in the reported experiments, except for the
355
experiments carried out in the country where the code is valid, the properties had to be calculated.
356
For determination of the tensile strength , 2
f cfIk L
f
in the German guideline, the expression from
357
Thomas [145] is used:
358
0.63
0.288
0.052
spfc cuf cuf
f
f
F f
F
(55)359
To determine ,
f ctR u
f
, the value ofk
Ff
0.5
for shear is used. The value of CRd,c = 0.15 is used together360
with the German guideline, to reflect the German National Annex to the Eurocode, whereas CRd,c =
361
0.18 is used together with the fib Model Code provisions and RILEM provisions. For determining fFtuk
362
as used in the fib Model Code, the value of ,
f ctR u
f
from the German code is used. When comparing to363
the RILEM provisions, it is assumed that fRk,4 = fspfc according to Eq. (55). For all of the expressions
364
based on the Eurocode shear provisions, the limitation of ρ ≤ 2% was removed, so that the heavily
365
reinforced beams from the database could be evaluated as well.
366
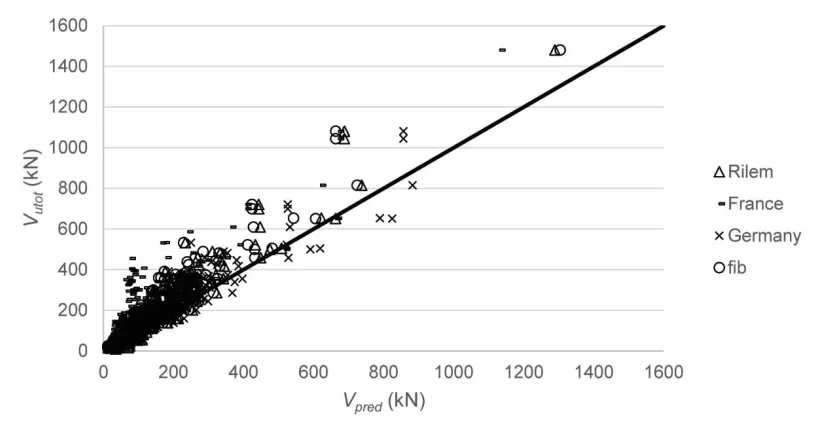
Figure 5 shows the comparison between the tested and predicted shear capacities according to
367
1:2005 [146], the reduction factor β = av/2d for 0.5d ≤ av ≤ 2d is used on the externally applied load but
369
not on the self-weight, to find the sectional shear force at the support Vutot. Table 5 shows the statistical
370
properties of the ratio of the tested to predicted shear capacities. This comparison shows a large
371
scatter on the ratio of experimental to predicted values. For design purposes, the code prediction
372
methods based on the Eurocode shear expression provide reasonable results (with coefficients of
373
variation on the ratio of tested to predicted results of 27% - 29%). These proposed code equations
374
tend to perform better than the equations proposed in the literature. Full parameter studies based on
375
the tested to predicted shear capacities can be found elsewhere [142].
376
377
378
Figure 5. Comparison between tested and predicted shear capacities with the code formulas.
379
Table 5. Statistical properties of Vutot/Vpred for all 487 datapoints
380
Model AVG STD COV min max
French code [10] 1.85 0.88 48% 0.22 5.95 German code [11] 1.12 0.31 27% 0.21 2.13 fib [39] 1.24 0.36 29% 0.30 2.33 RILEM [65] 1.16 0.33 29% 0.23 2.28
381
4. Discussion
382
None of the currently available methods properly describe the behavior of SFRC beams failing
383
in shear, as none of the currently available methods describe the influence of adding steel fibers on
384
the shear-carrying mechanisms: capacity in the compression zone, aggregate interlock, dowel action,
385
residual tension, the contribution of the fibers across the crack, and arching action. This study shows
386
the need for theoretical work that address the different shear-carrying mechanisms in SFRC and its
387
crack kinematics. The large scatter on the ratios of tested to predicted shear capacities found in this
388
study show that the currently available expressions do not describe the shear capacity of SFRC in a
389
satisfactory manner. The code expressions based on the Eurocode are conservative, have smaller
390
scatter as compared to the other expressions, and it seems that these can be used currently for the
391
purpose, as the profession waits for improved expressions.
392
In earlier work [147], I followed the approach of adding a separate term to quantify the
393
contribution of the steel fibers, in addition to the capacity of the concrete expressed by using the
394
Critical Shear Displacement Theory [148]. This approach is followed by a number of the currently
395
available codes and equations proposed in the literature. However, a further study of the influence
396
mechanisms [17] brought me to the conclusion that isolating the contribution of the fibers in a
398
separate, single term is theoretically not correct. The influence of the fibers on all shear-carrying
399
mechanisms should be quantified theoretically, and then evaluated experimentally (for example,
400
with digital image correlation analysis [149-151]).
401
A better understanding of how steel fibers improve the shear resistance of SFRC is important to
402
allow a wider use of SFRC in structural applications. Likewise, a better understanding of the
403
contribution of steel fibers to the shear capacity can result in optimization of cross-sections, a more
404
optimal and economical use of materials, and thus more sustainable designs.
405
5. Summary and conclusions
406
One of the barriers for more widespread use of steel fiber reinforced concrete (SFRC) in
407
structural applications, such as beams and girders where part of the stirrups are replaced by fibers,
408
or slabs without stirrups, is the lack of understanding of the shear-carrying behavior. This lack of
409
understanding is reflected by the fact that only a handful of national codes or guidelines contain
410
expressions to quantify the shear capacity of SFRC. This study evaluates the currently available code
411
provisions and equations proposed in the literature for the shear capacity of SFRC elements without
412
stirrups against a database of 487 experimental results from the literature. This study provides an
413
inventory of the current knowledge, identifies the gaps, and proposes a way forward for research on
414
the shear capacity of SFRC elements.
415
Analyzing the available experimental results from the database resulted in the following
416
conclusions:
417
Most experiments are carried out on small specimens.
418
There is a lack of experiments on SFRC beams with a large depth, which is necessary to
419
evaluate the size effect in shear.
420
Most specimens have a large reinforcement ratio, which is common for shear tests to
421
avoid a flexural failure, but does not correspond to actual designs.
422
Experiments on deep and slender beams are available to evaluate the shear span to
423
depth ratio.
424
The majority of the specimens are cast with normal strength concrete.
425
Most of the fiber volume fractions in the specimens lie between 0.5% - 1.5% as this range
426
contains practical and workable amounts of fibers. The full range of fiber volume
427
fractions in the database is 0.2% - 4.5%.
428
Then, parameter studies were carried out based on the available experimental results from the
429
database, which led to the following observations:
430
An analysis of the data shows that the shear stresses should be normalized to the square
431
root of the concrete compressive strength, as this ratio shows a smaller relation to the
432
concrete compressive strength than the cube root of the concrete compressive strength.
433
The normalized shear strength increases as the reinforcement ratio increases, which can
434
be explained by the larger dowel action for larger amounts of reinforcement.
435
The data show a small decrease for the normalized shear strength as the effective depth
436
increases. Not enough experimental results on large SFRC beams are available to study
437
the size effect in shear in SFRC.
438
The influence of the shear span to depth ratio on the normalized shear strength is similar
439
in SFRC as in reinforced concrete. The higher shear strength for small values of the shear
440
span to depth ratio is the result of arching action.
441
The normalized shear strength increases as the fiber volume fraction increases. The
442
normalized shear strength increases as the fiber factor increases. These observations are
443
expected, since the contribution of the fibers improves the shear capacity. There is less
444
scatter on the influence of the fiber factor than on the influence of the fiber volume
445
fraction, which justifies the use of the fiber factor in expressions and code equations.
446
The normalized shear strength decreases as the maximum aggregate size increases. This
447
improve the aggregate interlock capacity and thus the shear capacity. In SFRC, smaller
449
aggregates result in a more uniform mix, and a better bond between the concrete matrix
450
and the steel fibers, which enhances the shear capacity.
451
For the comparison between the experimental shear capacities and the capacities predicted by
452
the currently available codes and equations proposed in the literature, the following conclusions
453
result:
454
National codes and guidelines are based on specific methods for determining the
455
tensile strength of the SFRC, and these methods differ internationally. As such, none
456
of the experiments available in the literature report on all values of the tensile strength
457
that are required for determining the tensile strength in the various expressions.
458
The ratio of tested to predicted shear capacities shows large scatter. When all
459
experiments are considered, the expression by Kwak et al. results in the best
460
performance. When only slender beams are considered, the expression by Arslan et al.
461
results in the best performance.
462
The code equations based on the Eurocode shear expressions have a coefficient of
463
variation between 27% and 29% and a slightly conservative value of the average ratio
464
of the tested to predicted shear capacity. As such, these equations can be used until
465
better proposals are available.
466
The analysis in this work shows the need for a better understanding regarding the shear capacity
467
of SFRC. An analysis of the influence of the steel fibers on all shear-carrying mechanisms seems
468
necessary. A better understanding of the shear-carrying mechanisms is necessary to allow a more
469
widespread use of SFRC in structural elements, and an optimization of designs.
470
471
Author Contributions: The author confirms to be the sole author of this work.
472
Funding: This research was funded by the program of Poligrants 2017 and Poligrants 2019 from Universidad
473
San Francisco de Quito and the APC was funded by Delft University of Technology.
474
Acknowledgments: The author would like to acknowledge the work done by Belkis Filian Abad in the
475
exploratory study on this topic.
476
Conflicts of Interest: The authors declare no conflict of interest. The funders had no role in the design of the
477
study; in the collection, analyses, or interpretation of data; in the writing of the manuscript, or in the decision to
478
publish the results.
479
List of notations
480
a shear span, distance between center of loading plate and center of support
481
av clear shear span, distance between face of loading plate and face of support
482
bw web width
483
c height of compression zone
484
d effective depth
485
da maximum aggregate size
486
df fiber diameter
487
dv shear depth
488
e factor to take effect of shear span to depth ratio into account
489
fc’ specified concrete compressive strength
490
fc,cube average measured concrete cube compressive strenght
491
fc,cyl average measured concrete cylinder compressive strength
492
, 2 f c fIk L
f characteristic value of post-cracking flexural strength for a deflection of 3.5 mm
493
fck characteristic concrete cylinder compressive strength
494
fctk characteristic tensile strength of concrete
495
, f c tR u
f uniaxial tensile strength of SFRC
496
fcuf cube compressive strength of fiber reinforced concrete
fFtuk characteristic value of post-cracking strength for ultimate crack opening
498
fRk,4 characteristic residual flexural strength for the ultimate limit state at a CMOD of 3.5 mm
499
fspfc splitting tensile strength of fiber reinforced concrete
500
ft’ specified tensile strength of concrete mix
501
ftenf tensile strength of the fibers
502
fy yield strength of the reinforcement steel
503
h height of cross-section
504
hf height of flange
505
k size effect factor
506
kf factor that considers the contribution of flanges in T-sections (=1 for rectangular sections)
507
f F
k factor that considers the orientation of the fibers
508
f G
k size factor, which accounts for the fact that fibers are better distributed in larger elements
509
lf fiber length
510
lspan span length
511
ltot total specimen length
512
n parameter for effect of geometry of flanged sections
513
rf fiber radius
514
sx crack spacing
515
sxe equivalent crack spacing factor
516
vmax shear stress at maximum sectional shear Vmax
517
wlim limiting crack width
518
wmax maximum crack width permitted by the code
519
wu ultimate crack width, i.e. the value attained at the ULS for resistance to combined stresses on the
520
outer fiber under the moment exerted in this section
521
vb shear strength attributed to fibers
522
z internal lever arm
523
f ct
A effective area bw × d, with d limited to 1.5 m
524
Af cross-sectional area of the fiber
525
As area of longitudinal tension reinforcement
526
Avf shear area over which fibers contribute
527
B failure of bond between concrete and longitudinal reinforcement
528
CRd,c calibration factor for the design shear capacity
529
DT diagonal tension failure
530
Ef modulus of elasticity of the fibers
531
Es modulus of elasticity of reinforcement steel
532
F fiber factor
533
Gm matrix shear modulus
534
K orientation coefficient
535
M sectional moment
536
NA the failure mode of the individual experiment is not given, but the text mentions that all
537
experiments resulted in a shear failure
538
Pmax maximum load in experiment
539
Rg geometry factor from Yakoub [63]: 0.83 for crimped fibers, 1.00 for hooked fibers, and 0.91 for
540
round fibers
541
S fiber spacing
542
S shear failure
543
SC shear –compression failure
544
S – FL shear-flexure failure
545
ST shear-tension failure
546
V sectional shear force
547
Vc concrete contribution to shear capacity
548
Vcd design value of concrete contribution to shear capacity