Dynamic Response of a Cable Stayed Bridge under Blast Loading Page 303
Dynamic Response of a Cable Stayed Bridge
under Blast Loading
Lahiri S. K, Pandey A.D, Bhattacharya K, Sinha A, Vishukanth B, Ravichandra I.V.P.
Department of Earthquake Engineering, Indian Institute of Technology Roorkee, Roorkee, 247667, INDIA
ABSTRACT
The consideration of blast loading is gaining interest for the design of crucial structures (nuclear reactors, dams, bridges etc.). Bridges are vulnerable under blasts because of their immense strategic importance and easy accessibility. The dynamic response of a representative long span cable stayed bridge in terms of displacement, shear force and bending moment at critical sections under plausible blast situations is evaluated. The variation of the responses has been examined with variation of the parameters relating to the standoff distance, the position of blast, quantum of charge and the dynamic impact factor (DIF) of different component materials of the bridge to assess the vulnerabilities inherent in the bridge configuration.
KEY WORDS:
Dynamic Response of a Cable Stayed Bridge under Blast Loading Page 304
INTRODUCTION
After recent incidents all around the world there has been renewed emphasis on design and construction of critical infrastructures (buildings, bridges, power plants, pipelines, water supply systems, dams and chemical process facilities etc.) to resist blast loading. Bridges are the lifeline of the transportation system. Collapse of such structures will lead to disaster. Since a long time, different kinds of configurations have been used for bridges based on feasibility and requirement. Cable–stayed bridges are now gaining their importance as these provide efficient solution from stability and economical point of view for a certain span range. The aesthetic appearance becomes superior along with economical utilisation of materials and simpler construction procedures.
Several research papers have dealt with the issues related to modelling of cable stayed bridges and their behaviour under blast loading. Fleming et al. [3] suggested that though there was significant nonlinear behaviour under dead load (static load case) the effect of geometrical nonlinearities was not critical under static and dynamic loading if deformation is considered from the dead load deformed shape. Kumar N. [7] later on suggested that the consideration of geometrical nonlinearity did not result in significant change in bridge displacements due to dynamic loads. A 3D nonlinear static analysis was recommended to incorporate the torsional behaviour of a cable stayed bridge due to eccentric loading after Karoumi R. [6] studied the behaviour of a 2-D cable stayed bridge using two approaches i.e. an Euler-Bernoulli beam idealisation supported on elastic supports with varying stiffness and a more general approach using nonlinear finite element method taking consideration exact cable behaviour and geometrical stiffness. Although taking lesser computational
effort the first approach of modelling was unable to represent exact dynamic behaviour of the bridge due to the effect of the cable mass, pretension and damping of the structure. The ultimate resistance of a cable stayed bridge is highly dependent on the load pattern and load increment to reach failure and the deck slab girder connection flexibility had a minor influence on the failure load of the structure as suggested by Oliveira P. et al. [11] after performing a nonlinear analysis of a representative composite cable stayed bridge considering both material and geometrical nonlinearities under service load conditions.
The behaviour of different materials under high strain rate of loading like in case of blasts is also a prime issue. Zhu F. et al. [16] documented a review of blast and its impact on response of different structures where the important characteristics of the structural response included the mode of deformation and fracture, transfer of impulse and energy absorption in plastic deformations. Different constitutive models (e.g. Johnson-Cook Model [15], Cowper-Symonds Model [15]) had been mentioned to relate material strength with strain rate and plastic strain.
Dynamic Response of a Cable Stayed Bridge under Blast Loading Page 305 removing the damaged portion and
detaching the cables showed failure of main span was not likely to occur and collapse of back span did not induce progressive collapse of the structure. Blast load simulation consumes large memory space and rigorous computation. An advanced approach for better estimation of bridge responses was suggested by Son J. et al. [12]. Implicit solution scheme was used for static load case and the results were the initial condition for the explicit method without sacrificing the accuracy of the solution to reduce the simulation time. It also suggested to utilize the high strain effects on materials and to extend the simulation time to consider destabilizing effect of blast loading on the structure.
BRIDGE MODEL
Figure 1 shows the geometry of the bridge model indicating the critical sections where the responses are studied in the analysis. The critical nodes have been shown in the figure. A linear static analysis was performed under self weight of the structure prior to the blast load analyses. Geometrical nonlinearities in the cables were not considered for the static analysis as the cables are pretensioned. Any compressive force coming on the cables results in loss of the pretension force already provided. The maximum displacement at the centre of the bridge span is 1.03 m under the self weight of the structure. The contour plots of the vertical
displacement and rotation vector sum are shown in the figure 2 and 3.
MATHEMATICAL IDEALISATION
1. The bridge girder, pylons and piers are modelled as equivalent beam elements.
2. The cable members are idealised with beam elements with very low value of moment of inertia to represent proper behaviour of the cables.
3. The connections between the cables and the deck and tower are considered to be pinned.
4. The cables are assumed to be pretensioned. Any compression in cables is taken as loss of pretension. Thus no compression is considered in cables.
5. The effect of soil is taken into account by using equivalent springs.
MATERIAL PROPERTIES
The materials are assumed to be linear isotropic and homogeneous in nature. Steel is used for the cable stays and the rest of the structure (bridge deck, pylons piers etc.) is made of reinforced concrete. The material properties are as follows
Table 1 Material Property of Different Components of the Bridge
Concrete Steel
Density 2.5 Ton/m3 Density 8.0 Ton/m3
Young’s Modulus 27.4E+6 kN/m2 Young’s Modulus 200E+6 kN/m2 Poisson’s Ratio 0.3 Poisson’s Ratio 0.3
Dynamic Response of a Cable Stayed Bridge under Blast Loading Page 306 Figure 1 Geometry of the Bridge indicating the critical sections
Figure 2 Contour plot of vertical displacement (m)
86.22 m
44.23 m
10 m 13
78 19 68
83 Water Level
182.88 m 457.2 m 182.88 m
Dynamic Response of a Cable Stayed Bridge under Blast Loading Page 307 Figure 3 Contour plot of rotation sum (radian)
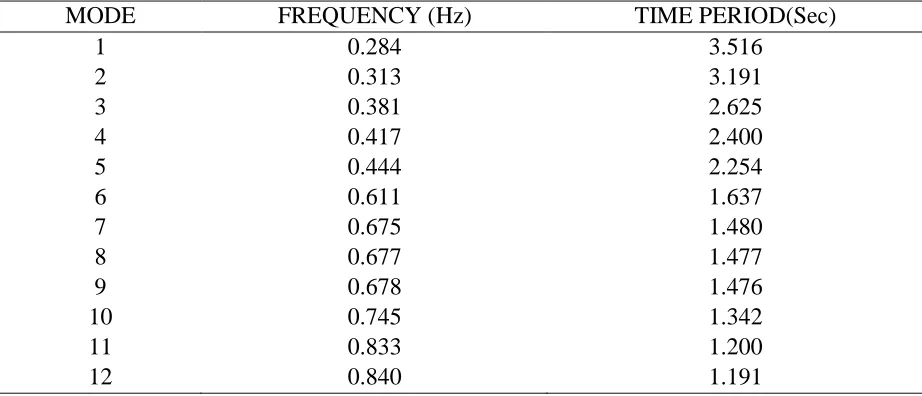
MODAL ANALYSIS
The modal analysis of the bridge model was carried out. The frequencies and time periods corresponding to first 12 modes are listed in the table 2.
Table 2 Modal Frequencies of the structure
MODE FREQUENCY (Hz) TIME PERIOD(Sec)
1 0.284 3.516
2 0.313 3.191
3 0.381 2.625
4 0.417 2.400
5 0.444 2.254
6 0.611 1.637
7 0.675 1.480
8 0.677 1.477
9 0.678 1.476
10 0.745 1.342
11 0.833 1.200
12 0.840 1.191
3.3. QUANTIFICATION OF BLAST LOAD
Dynamic Response of a Cable Stayed Bridge under Blast Loading Page 308 blast is usually very short. The loading on
the structure (Overpressure – the pressure above normal atmospheric pressure) and the duration of overpressure vary with the Stand-off distance (the distance between the explosive and the structure). Usually the size of the explosive is quantified in terms of an equivalent weight of TNT. The
air shock wave produces an instantaneous increase in pressure over the ambient atmospheric pressure at a point some distance from the source. This is commonly referred to as overpressure. A typical pressure-time profile of blast wave in free air is shown in figure 4 and 5.
Figure 4 Distribution of blast over pressure with distance at any instant [1]
Figure 5 Variation of blast over pressure and dynamic pressure with time at any fixed point [1]
Dynamic pressure (
p
d) generated due to explosion is governed by the equation [1]2
2 1ρν = d
p (1)
Where,
p
d is the dynamic pressure, ρ is air density,v
is the velocity of the air particles.Blast wave front velocity [1] depends only on peak over pressure as
o so s o p p U U 7 6 1+
= (2)
o
U
is the blast wave front velocity,U
sis velocity of sound,p
ois atmospheric pressure,p
sois the peak over pressure. Peak over pressure (p
so) value depends on scaled distance (z) that isexpressed as [8]
3 7 . 6 1 Z
Ps = +
P
s≥
10
bar (3)019 . 0 85 . 5 455 . 1 975 . 0 3
2 + −
+ =
Z Z
Z
Ps
0
.
1
≤
P
s≤
10
bar (4)3 1
W R
Z= m/kg1/3 (5)
Z is the Scaled Distance, R is the Distance of any point from the point of
Dynamic Response of a Cable Stayed Bridge under Blast Loading Page 309 variation at a certain distance is described
by an exponential function; the Friedlander equation [9]
s T bt s s
e
T
t
P
t
P
−−
=
[
1
]
)
(
(6)
s
T
is the duration of positive over pressure and b is wave form parameter.Different models have been suggested to quantify exactly the blast overpressure and the blast positive overpressure time based on several experimental data. In a review of blast wave parameter Dass M. G. et al. [2] listed some models to compute peak blast over pressure. For the calculation of blast over pressure as per Kinney & Grahm [2] model following expressions are used + + + + = 2 2 2 2 0 ) 35 . 1 ( 1 ) 32 . 0 ( 1 ) 048 . 0 ( 1 ) 5 . 4 ( 1 808 z z z z p
ppos bar (7)
R W tpos 6
2 . 1
= milli seconds (8)
Where,
p
posis the peak positive blast overpressure,
p
0is the ambient air pressure (taken as 1.01325 bar) andt
posis thepositive blast over pressure duration. Blast wave parameter (b) has been taken as per
the following equation suggested by Larcher[12] 1975 . 1 2777 . 5 − = z b (9) Table 3 Position of placing of detonations
Case number Coordinate (m) Position of detonation
1 (411.48,11.524,-13.75) Below the mid span of bridge at the water level 2 (411.48,41.724, 16.98) At an angle of 450 along the height of the bridge 3 (411.48,54.23,28.958) At an angle of 90
0
along the height of the bridge almost at the same level of the bridge deck
4 (411.48,139.45,-13.75) Mid way Between the top of the towers
5 (468.63,11.524,-13.75) At the water level at a distance of 57.15 m along the length of the bridge from the first position 6 (525.78,11.524,-13.75) At the water level at a distance of 57.15 m along
the length of the bridge from the second position 7 (582.93,11.524,-13.75) At the water level at a distance of 57.15 m along
the length of the bridge from the third position
The top of the tower, mid span of the bridge and the piers are considered to be critical for the structural response of the bridge. The different positions of the detonations are listed in the table 3. Maximum bending moments, displacements, shear and displacements at
Dynamic Response of a Cable Stayed Bridge under Blast Loading Page 310 moments at different parts of the bridges are shown in the figure 6-13.
Table 4 Critical Sections at the Bridge
Critical Sections Node no
Mid section of the bridge deck 13
Top of the Tower 68
Connection Between Deck & Pier 19
Nearby Main span Pier 78
Back span Pier 83
BLAST LOAD ANALYSIS
The strain rate of blast loading is usually very high (102-104 per sec). The material in high strain rate behaves very rigidly due to increase in material strength.
The increase in material strength depends on the rate of strain, quasi-static strain rate and type of material. Several models have been suggested for quantification of the dynamic impact factor (DIF) i.e. increase in the material yield strength for different materials. The range of dynamic impact factor of concrete lies in between 10 and 15 [8] whereas for steel the increase in dynamic strength is within 2 to 5 times the static strength. The bridge consists of two different kind of materials i.e. steel (cables-stays) and concrete (rest of the structure). DIF values are considered as 12 for concrete and 4 for steel so that the structural system behaves rigidly during blast loading period. The effect of high strain rate is considered only up to the blast overpressure period. In steady state condition original material values are
considered for analysis. Rayleigh damping coefficients (αand
β
) [1] are calculated assuming the damping of the structural system to be 2% and 2.5% for the first two modes as per the following formulation (10)i i
i
ω
ζ
βω
α
+ 2 =2(10)
Dynamic Response of a Cable Stayed Bridge under Blast Loading Page 311 Table 5 Variation of Maximum Positive Bending moment (My) at Critical Sections of the
bridge in different load cases (Linear Analysis)
Node 13 68 78 83 19
My(KNm) max(+ve) max(+ve) max(+ve) max(+ve) max(+ve)
1 106.70 80642.66 5.34 15.12 220.20
2 356.05 445839.50 16.08 57.30 1025.67
3 341.42 449729.80 21.44 55.98 1125.16
4 210.86 360237.80 23.61 35.20 883.67
5 89.89 119040.40 5.95 12.66 286.97
6 66.45 143313.30 4.83 9.46 344.17
7 47.28 160033.00 3.63 6.79 317.80
Table 6 Variation of Maximum Positive Bending moment (Mz) at Critical Sections of the bridge in different load cases (Linear Analysis)
Node 13 68 78 83 19
Mz(KNm) max(+ve) max(+ve) max(+ve) max(+ve) max(+ve)
1 259.63 9741.89 0.10 26.89 674.59
2 744.77 21356.69 30.40 112.11 698.60
3 665.14 21896.68 6.13 131.73 387.76
4 4536.05 15376.33 0.24 113.23 264.21
5 220.31 5400.72 0.10 16.85 897.85
6 164.94 3211.50 0.08 10.96 1258.68
7 119.13 1743.50 0.06 7.57 2520.59
Table 7 Variation of Maximum Negative Bending moment (My) at Critical Sections of the bridge in different load cases (Linear Analysis)
Node 13 68 78 83 19
My(KNm) max(-ve) max(-ve) max(-ve) max(-ve) max(-ve)
1 -372.83 -16794.70 -2.68 -34.98 -163.55
2 -2181.68 -81864.50 -3.98 -96.85 -715.46
3 -2286.93 -83618.80 -4.97 -97.52 -721.02
4 -1263.79 -58116.50 -6.11 -71.57 -484.17
5 -177.62 -13521.30 -2.67 -20.64 -138.88
6 -110.42 -10906.00 -2.01 -15.68 -105.69
Dynamic Response of a Cable Stayed Bridge under Blast Loading Page 312 Table 8 Variation of Maximum Negative Bending moment (Mz) at Critical Sections of the
bridge in different load cases (Linear Analysis)
Node 13 68 78 83 19
Mz(KNm) max(-ve) max(-ve) max(-ve) max(-ve) max(-ve)
1 -9385.51 -0.01 -8.24 -0.30 -97.44
2 -27499.80 -0.01 -0.53 -1.14 -317.96
3 -12845.40 -0.02 -2.78 -1.12 -301.48
4 -645.93 -0.02 -9.41 -0.70 -1047.39
5 -3223.25 -0.01 -7.65 -0.25 -86.99
6 -858.82 -0.02 -7.11 -0.19 -68.37
7 -1049.14 -262.34 -5.67 -0.14 -52.89
Table 9 Variation of Maximum Shear forces (KN) at Critical Sections of the bridge in different load cases (Linear Analysis)
Element 13 68 78 83 19
Fy(kN) Fy(kN) Fy(kN) Fy(kN) Fy(kN)
1 -285.04 -405.72 -0.54 1.99 16.57
2 -909.85 -1003.96 2.30 8.21 27.94
3 -430.72 -1106.63 0.51 9.63 -28.00
4 123.62 -891.99 0.02 8.23 -47.02
5 -30.93 -145.01 -0.50 1.26 22.54
6 -20.43 -111.63 -0.47 0.82 40.11
7 -14.07 -275.03 -0.37 0.56 98.90
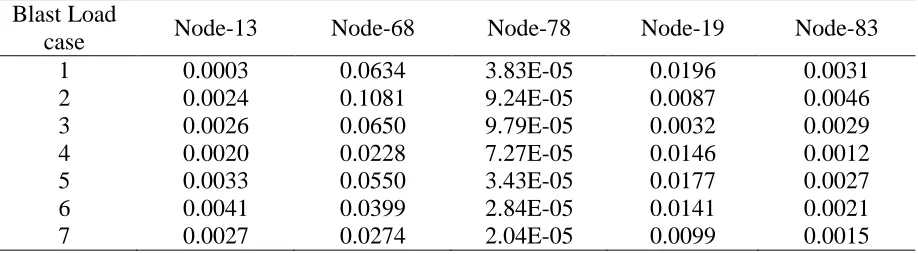
Table 10 Variation of Maximum Longitudinal Displacements (ux) (m) at Critical Sections of the bridge in different load cases (Linear Analysis)
Blast Load
case Node-13 Node-68 Node-78 Node-19 Node-83
1 0.0003 0.0634 3.83E-05 0.0196 0.0031
2 0.0024 0.1081 9.24E-05 0.0087 0.0046
3 0.0026 0.0650 9.79E-05 0.0032 0.0029
4 0.0020 0.0228 7.27E-05 0.0146 0.0012
5 0.0033 0.0550 3.43E-05 0.0177 0.0027
6 0.0041 0.0399 2.84E-05 0.0141 0.0021
Dynamic Response of a Cable Stayed Bridge under Blast Loading Page 313 Table 11 Variation of Maximum Vertical Displacements (uy) (m) at Critical Sections of the
bridge in different load cases (Linear Analysis)
Blast Load
case Node-13 Node-68 Node-78 Node-19 Node-83
1 0.3075 0.0115 5.76E-05 0.0043 1.86E-05
2 0.5753 0.0258 7.05E-05 0.0152 2.07E-05
3 0.3472 0.0177 3.12E-05 0.0144 7.43E-06
4 0.1499 0.0096 3.7E-05 0.0093 2.84E-05
5 0.2486 0.0104 5.49E-05 0.0042 4.0E-05
6 0.1706 0.0072 7.70E-05 0.0033 2.9E-05
7 0.1170 0.0047 2.71E-05 0.0027 1.8E-05
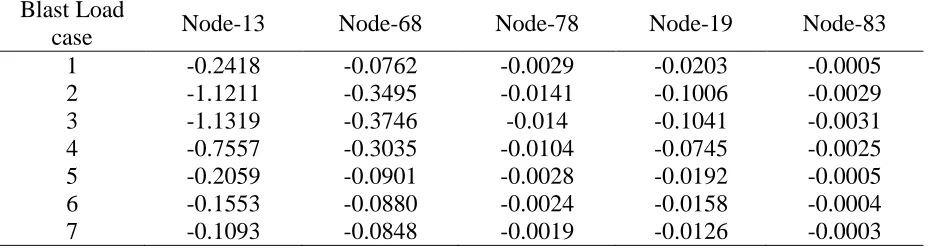
Table 12 Variation of Maximum Transverse Displacements (uz) (m) at Critical Sections of the bridge in different load cases (Linear Analysis)
Blast Load
case Node-13 Node-68 Node-78 Node-19 Node-83
1 -0.2418 -0.0762 -0.0029 -0.0203 -0.0005
2 -1.1211 -0.3495 -0.0141 -0.1006 -0.0029
3 -1.1319 -0.3746 -0.014 -0.1041 -0.0031
4 -0.7557 -0.3035 -0.0104 -0.0745 -0.0025
5 -0.2059 -0.0901 -0.0028 -0.0192 -0.0005
6 -0.1553 -0.0880 -0.0024 -0.0158 -0.0004
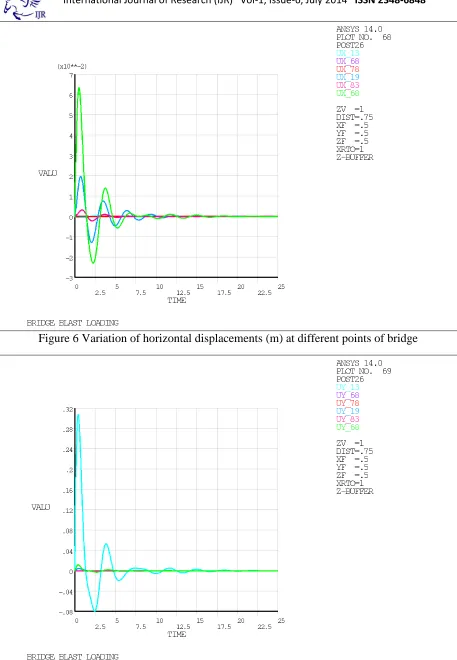
Dynamic Response of a Cable Stayed Bridge under Blast Loading Page 314 Figure 6 Variation of horizontal displacements (m) at different points of bridge
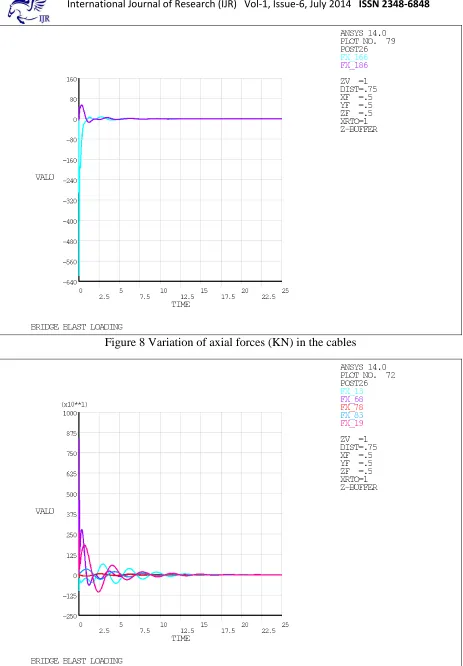
Dynamic Response of a Cable Stayed Bridge under Blast Loading Page 315 Figure 8 Variation of axial forces (KN) in the cables
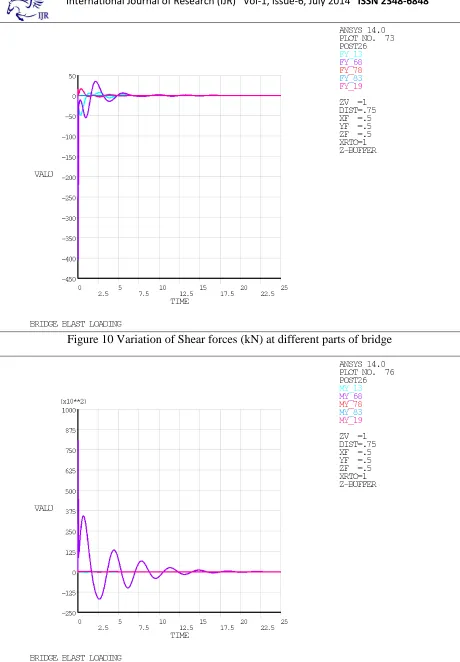
Dynamic Response of a Cable Stayed Bridge under Blast Loading Page 316 Figure 10 Variation of Shear forces (kN) at different parts of bridge
Dynamic Response of a Cable Stayed Bridge under Blast Loading Page 317 Figure 12 Variation of Bending Moment Mz (kNm) at different parts of bridge
Dynamic Response of a Cable Stayed Bridge under Blast Loading Page 318
DISCUSSION OF RESULTS
The mid section is subjected to maximum vertical deformation whereas the top of the pylons are subjected to maximum rotation under self weight of the bridge as shown in the figures 2 and 3.
Direct stresses at the cables (element 166) connected to the mid span of the deck from the top of the tower are very high under the self weight of the bridge. These cables are most vulnerable under blast loads. None of the cables were expected to fail under the chosen amount of discharge as the axial forces are within the limit of the yield strength of the cables.
Direct stresses at the connection between the towers and the deck (node-13) is maximum when the charge mass is placed symmetrically below the mid span of the bridge at the water level (blast load casae-1) compared to other parts of the bridge (figure 13).The peak responses at the critical sections lag behind the external loading. Once the loading finishes the bridge vibrates with its fundamental frequency. Due to the incorporation of damping in the model the response gradually diminishes as time progresses. The top of the pylons (node 68) are subjected to maximum horizontal displacements (Figure 6). The shear forces and bending moments are also very high at those regions(Figure10,11,12). However the vertical displacements at the mid span are more crucial than other parts of the bridge(figure 7).
The mid span (node13) is subjected to maximum vertical displacements( Table 11) where as top of the towers (node 68) were subjected to maximum horizontal displacements under all the blast cases (Table 10) The pylons are subjected to maximum bending moments and shear forces under all the selected blast load cases ( Table 5, 6,7,8,9). Due to the consideration of dynamic impact factors for different materials to incorporate the effect of high strain rate of blast loading, the peak displacements are reduced.
CONCLUSION
The tower top is one of the most vulnerable portions of a cable stayed bridge. Under the blast loading the displacements, shear forces and bending moments at the pylons are very high. Special precautionary measures are required to take care of such high forces and moments coming at pylons. Precautions are also required at the pier sections subjected to high forces and moments when the detonations are placed near the piers at the water level as yielding of piers may lead to progressive collapse of the whole bridge under self weight as well as imposed loads. Cables behave almost linearly under gravity load analysis as they are pretensioned. Hence any compressive force in the cables cause a loss in the pretension already provided. However consideration of geometric nonlinearities may be significant in case of blast load analysis.
REFERENCES
[1] Biggs John M., ‘Introduction to Structural Dynamics’, McGrew-Hill, Inc., New York, 1964
Dynamic Response of a Cable Stayed Bridge under Blast Loading Page 319 [3] Fleming J.F., Egeseli E.A., 1980, ‘Dynamic Behaviour of a Cable-Stayed Bridge’, Earthquake Engineering and Structures, Dynamics, 8,, pp, 1-16.
[4] Hao, H. & Tang, E.K.C., 2010. Numerical simulation of a cable-stayed bridge response to blast loads, Part II: Damage prediction and FRP strengthening. Engineering Structures, 32(10), pp.3193–3205.
[5] Jose J., Oliviera Pedro, Antonio J. Reis, 2009, ‘Nonlinear Analysis of Composite Steel-Concrete Cable-Stayed Bridges’, Engineering Structures
[6] Karoumi R., 1998, ‘Response of Cable-Stayed and Suspension Bridges to Moving Vehicles’ Doctoral Thesis, Department of Structural Engineering, Royal Institute of Technology
[7] Kumar N., 1987, ‘Dynamic Analysis of Cable Stayed Bridge’, M-Tech Thesis, Department of Earthquake Engineering, Indian Institute of Technology, Roorkee
[8] Malvar L. J. & Crawford J. E., august 1998, ‘Dynamic Increase Factor’,28th DDESB Seminar, Orlando
[9] Martin H. C., & Carey F.G., 1975, ‘Introduction to Finite Element Analysis’ McGraw-Hill, Inc., New York
[10] Mays G.C., and Smith P.D., 2003, ‘Blast Effects on Building, Design of Buildings to optimize resistance to Blast Loading’, Thomas Telford, London, 2003
[11] Oliveira Pedro, J.J. & Reis, A.J., 2010. ‘Nonlinear analysis of composite steel– concrete cable-stayed bridges’, Engineering Structures, 32(9), pp.2702–2716
[12] Son J. & Lee, H.-J., 2011. Performance of cable-stayed bridge pylons subjected to blast loading. Engineering Structures, 33(4), pp.1133–1148.
[13] Suthar, K., 2007, The Effect of Dead, Live and Blast Loads on a Suspension Bridge. Master’s Thesis, Department of Civil and Environmental Engineering, University of Maryland, College Park
[14] Tang, E.K.C. & Hao, H., 2010. Numerical simulation of a cable-stayed bridge response to blast loads, Part I: Model development and response calculations. Engineering Structures, 32(10), pp.3180–3192.

![Figure 5 Variation of blast over pressure and dynamic pressure with time at any fixed point [1]](https://thumb-us.123doks.com/thumbv2/123dok_us/7836047.1298596/6.595.336.560.215.326/figure-variation-blast-pressure-dynamic-pressure-fixed-point.webp)