Trends in KCPE Performance: Their Function in School
Effectiveness and Improvement in Gitugi Education Zone
Murang’a County, Kenya
Ms. Karongo Violet Wanjiru
Doctorate student in Department of Educational Management, Policy and Curriculum Studies, Kenyatta University, Kenya. [email protected]
Prof. John A. Orodho
Department of Educational Management, Policy and Curriculum Studies, Kenyatta University,Kenya Email:[email protected] or [email protected]
Abstract
This research sought to find out whether and how the analysis of the mean scores as utilized in Gitugi zone impact on the schools’ effectiveness and improvement with regard to performance in KCPE. The research had three objectives, namely) to determine whether there is any significant difference between the KCPE mean scores among the schools,ii) to determine whether there is any significant difference between the KCPE mean scores among cohorts and,iii) to find out whether or how summative and formative evaluation can be used to improve performance in KCPE in Gitugi education zone. Nine out of the fifteen schools were chosen through systematic random sampling. Document analysis was done for both the summative KCPE results and the formative evaluation in class eight, 2011. Piloting was done in one school in the zone. The data collected is presented in tables and graphs and, analyzed using inferential statistics using one-way analysis of variance (ANOVA) and Spearman’s Rank correlation coefficient. The schools show a downward trend in performance in KCPE in the zone except two from 2007 to 2011. There is significant difference in the KCPE means among the nine schools, while there is no significant difference across cohorts. This ANOVA results point to differences between schools which need further investigation to explain the observed consistent differences in KCPE performance. Annual calculations of mean scores and ranking continue to generate anxiety without addressing the causative agents. It is recommended that analysis of trends in KCPE performance should be embraced as a useful tool in examining the differences among schools and cohorts and also used to develop strategies to raise schools’ effectiveness geared towards enhancement of KCPE scores in Gitugi education zone, Murang’a County, Kenya. [281 words]
Keywords: trends in KCPE performance, ranking of schools, schools’ effectiveness, schools’ improvement I. INTRODUCTION
Background of the study
The high premium attached to the quality of education measured using academic and no-academic indicators in secondary education in Kenya is neither achievable nor sustainable without the continuous assessment of these indicators on how they influence the delivery of quality education by school systems in the country (Republic of Kenya/UNESCO, 2012). Demand for educational quality is also increasing, as the Government of Kenya views the satisfactory performance of her basic education systems not only instrumentally but also strategically in relation to economic development and international competitiveness (Orodho,2014).
Internationally, schools’ effectiveness is deduced most often from performance in national examinations. The standards that are set by stakeholders for the schools are rarely met thereby generating misunderstanding between the schools and the stakeholders (Kellaghan & Greaney, 2003; The Open Institute, Dec. 2013; Chantanavich,A et al, 1995). In Africa, low performances in national examinations have raised great concern over the years. In Ghana between 1992 and 1996 more than fifty percent of candidates failed the national criterion-referenced tests. More than forty percent in Ethiopia fail grade eight annually while in Mozambique, more than half fail national examinations (Kellaghan & Greaney, 2003).
Institute, Dec, 2013).
Not surprising then, performance in KCPE is of utmost concern to all stakeholders in the Kenya education system. The demand to improve mean scores weighs heaviest on school heads and the teachers. The demand from parents and the government for teachers and schools to improve their performance, and for the government to provide sufficient teaching human, material and physical resources reverberates across the country every year after the results are released (Nyangosia, 2011; Daily Nation, Dec. 2010).
In Gitugi education zone with most schools posting very low KCPE mean scores every consecutive year, the education office in the zone faithfully analyses the results, discusses them with the school heads and with the teachers, and organizes subject workshops in an effort to stimulate improvements in the schools. Often the school heads are transferred from one school to another within the same zone. A detailed study of the possible cause or causes of the resultant poor performance is not done, neither are attempts made to study the past experiences that may be influencing the observed present performance. The school, the head teacher and the teachers are assumed to be wholly responsible for the poor performance.
Literature review
The education production function postulates that quantities of measured inputs to a school should map onto an equivalent measure of student outputs like test scores (Hanushek, 2007; Krueger, 1999). A school that conducts self study regularly would be able to identify desired students’ achievement outcomes thus continue to adjust policies and practices that hamper attainment of the desired outcomes. This would ensure increased effectiveness and continued improvement in the school (Barnes, 2004).
According to Haris & Bennet (2001), school effectiveness is premised upon measurement of school outcomes which often focus on performance in examinations. It also focuses on quantifying differences in performances of different schools. An effective school is one whose performance in examinations is high, while an ineffective school posts low grades in examinations.
School improvement addresses the different ways that can be used to raise the outcomes so to raise the effectiveness of a school. Comparison of performance between different schools in common examinations, and in all other characteristics of the schools would highlight what one school has that is presumed to facilitate better performance. It is presumed that the poorer performing school would improve if it is provided with similar facilities (Haris & Bennet, 2001; Onderi & Croll, 2008).
In an effort to provide all schools with adequate teaching and learning resources for effectiveness, the government introduced Free Primary Education (FPE) in 2003. This was meant to ensure equity and thus equality in performance in all public schools. Projects like SPRED (Strengthening Primary Education), KESSP (Kenya Education Sector Support Program), SMASE (Strengthening of Mathematics and Science Education), capacity building for all staff, review of the Education Act and continuous review of the curriculum are some of the efforts made to raise effectiveness and improvement in public schools.
Despite these efforts, performance in KCPE has remained below average for the larger percentage of candidates every year. Public schools’ performance remains persistently below that of private schools, girls’ performance continues to be below the boys’ (except in languages) and the dissatisfaction among many stakeholders continues an abated (Daily Nation, Dec. 29th & 30st, 2010).
Assessment is often regarded as an important tool to measure the progress of individual learners. It also allows communities and countries to track the quality of schools and education systems (Brann et al, 2006). They point out that if there are no consequences attached to a test, it will do little to motivate healthy change within the education system. If the consequences are too high, it may result in negative undesirable outcomes like narrowing of the curriculum and teaching for tests. This unfortunately is a current practice in schools in Kenya today (Daily Nation,Dec, 2010). Such practice may eventually lead to undermining the integrity of the assessment system as well as the education system itself (Brann et al, 2006; Barnes, 2004).
Test scores when used to gauge effectiveness of schools and education systems are premised on the assumption that all schools operate under the same conditions .It is also assumed that learners in the schools and in all years across which the tests are taken are similar. This is often not the case since it observed that there are differences regionally, in types of schools (public and private) and in availability of resources (Chantanavich et al 1995; Haris & Bennet, 2001). Chinagah, (2000) points out that inequalities in opportunities to learn among different groups are reflected in corresponding disparities in performance. He observes that differences in the language of instruction, language of assessment and the native language are factors that influence test outcomes in nations with many language groups.
Greaney (1992). They however caution that public examinations intended to raise quality cannot be the same as those for selection. This is because examinations for selection into careers, secondary or higher education often do not take into account the needs of the majority who do not proceed to the next level. The authors also point out that teachers are not adequately equipped with skills to use the examinations results data analysis for improvement of teaching and learning.
Data available from the Kenya National Examinations Council (KNEC) is detailed with trends in enrolments, absent candidates, gender parity, cheating in exams, county populations and analysis of the examination appropriateness. No data was found showing performance trends over any span of years. In this study all the schools studied being public schools are presumed to have similar resources and have learners with similar economic backgrounds. It is also contended that if the schools regularly analyse their performances in all examinations they should be able to develop strategies that would enhance performance in KCPE.
Statement of the problem
Performance in KCPE in Gitugi education zone has been poor consistently for many years. Despite the introduction of Free Primary Education (FPE) by the government in 2003, performance in the majority of the schools has remained poor. The primary objective of FPE is to allow all Kenyan children access education, ensure quality education by providing requisite resources to all schools equitably and thus allow for performance that is commensurate with the inputs therein (Republic of Kenya, 2005). Since performance in national examinations is the common denominator across all schools in the country, it becomes equally effective at assessing performance nationally when it is assumed that all schools operate under the same conditions through FPE.
In Gitugi when this condition is assumed to be true, the 15 schools (all of which are public schools with one being private) in the zone should show similarity in performance, which they do by the majority performing below the zonal mean. Three of the schools (one of which is the private school) however consistently perform better with mean scores above the zonal mean. An increase or decrease in the mean scores in consecutive years does not seem to alter the ranking. This creates the problem of what the schools need to do to improve their performances thereby develop effectiveness in teaching and learning.
Purpose and objectives of the study
The purpose of this study was to analyze trends in students KCPE performance with a view to examine their function in school effectiveness and improvement in Gitugi Education Zone, Murang’a County, Kenya. Since KCPE performance is analyzed every year in Gitugi education zone this study sought to analyse the trends in performance over a span of five years and use the same to assess their usefulness in stimulating improvement through increased effectiveness at school level. The analysis was fashioned to ascertain whether there are underlying differences among the schools that result in the continued similarity in performance which results in maintenance of similar ranking across the years.
The study had three fold objectives, namely:
1. To determine whether there is any significant difference between the KCPE mean scores attained by the schools in the zone for five consecutive years, 2007 to 2011
2. To determine whether there is any significant difference between the KCPE mean scores attained by the different cohorts in five consecutive years.
3. To establish whether or how trends in summative and formative evaluation performances can be used to raise schools’ effectiveness and trigger schools’ improvement.
Research hypotheses
Three hypotheses were proposed as predictive statements highlighting the relationship between KCPE mean scores of the schools across the five years and across the cohorts in the schools. The independent variable is the KCPE examination that is administered to all candidates in all the schools in the five years, while the dependent variable is the resultant performance indicated by the mean scores for every school
H01: There is no significant difference between the KCPE mean score performances among the schools in Gitugi education zone for five consecutive years 2007 to 2011.
H02: There is no significant difference between the KCPE mean scores across cohorts in Gitugi education zone between 2007 and 2011.
H03: There is no significant relationship between KCPE evaluation mean scores and formative evaluation scores in Gitugi education zone to impact on effectiveness and improvement in the schools.
RESEARCH METHODOLOGY
division of Mathioya sub-county, Murang’a County. There are fourteen public primary schools and one private school in the zone. The schools are evenly spread across the 51.2 square kilometers.
Nine out of the fourteen public schools were used as the sample which represents sixty percent (60%) of the total number of schools in the zone. A cohort in the study was regarded as the group of learners that sat the KCPE exam each year, and whose results are the ones posted as the mean scores for that year. The trend in performance in the schools is presented in graphs and compared against the national performance between the years 2007 to 2011.
One-way Analysis of Variance (ANOVA) was used to test whether there is any significant difference between the KCPE mean scores of five years, 2007 to 2011, among schools and across the years. The Spearman’s Rank correlation coefficient rs was used to test the significance of 2011 KCPE performance with formative evaluation. The formative evaluation examinations used were the mock examination, 2011 and end-of-year examination 2010. These three formative examinations were thus done by the same candidate.
FINDINGS AND DISCUSSIONS
Figure 1 graphically depicts the trend in national mean score performances in KCPE from 2007 to 2011 in the study locale.
Figure1: The National examination performance profile in Gitugi Division
An examination of the performance profile in the study locale indicates that the performance sharply increased from the first to second year and suddenly dropped during the the third year under study. The poor performance has remained consistently low over the years, especially from 2009 to 2011.
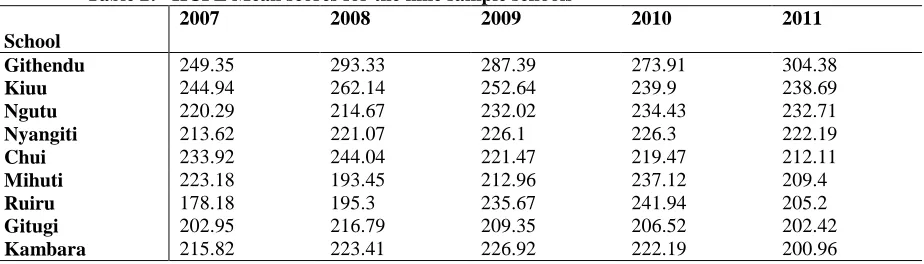
Table 2 carries data on the KCPE mean scores for the nine sampled schools from 2007 to 2011 in the study locale of Gitugi Division, Murang’a County. A part from only two schools that have recorded some remarkable improvement over the years, the rest of the schools have either remained constantly low or dropped drastically over the period under review. The schools have generally performed below the national average over the period under review.
Table 2: KCPE Mean scores for the nine sample schools
School
2007 2008 2009 2010 2011
Githendu 249.35 293.33 287.39 273.91 304.38
Kiuu 244.94 262.14 252.64 239.9 238.69
Ngutu 220.29 214.67 232.02 234.43 232.71
Nyangiti 213.62 221.07 226.1 226.3 222.19
Chui 233.92 244.04 221.47 219.47 212.11
Mihuti 223.18 193.45 212.96 237.12 209.4
Ruiru 178.18 195.3 235.67 241.94 205.2
Gitugi 202.95 216.79 209.35 206.52 202.42
Kambara 215.82 223.41 226.92 222.19 200.96
The study also posited three hypotheses , namely:
H02: There is no significant difference between the KCPE mean scores across cohorts in Gitugi education zone between 2007 and 2011.
H03: There is no significant relationship between KCPE evaluation mean scores and formative evaluation scores in Gitugi education zone to impact on effectiveness and improvement in the schools.
The test on the significance of the differences in the KCPE mean scores between 2007 and 2011 produced an F ratio of 10.80. The critical value from the table, Fc= F8;36;0.05 =2.21 . Since the calculated F value of 10.804 is greater than the critical value of 2.21, we reject the null hypothesis H01 that there is no significant difference in the KCPE mean scores among the schools for the five years. We thus conclude that at least one mean differs from the others.
The calculated F value for the second hypothesis H02 that there is no significant difference between the KCPE mean scores for the different cohorts between 2007 and 2011 was 0.117 The critical value from the table, Fc
=F4;40;0.05 =3.40 . Since the calculated value is less than the critical value, the null hypothesis that there is no significant difference between the KCPE mean scores across the cohorts in the five years studied is not rejected. On the third null hypothesis H03, the Spearman rank correlation coefficient rs calculated for KCPE 2011 and mock exam 2011 was 0.85. The critical value at a significant level ᾳ=0.05 and degrees of freedom (df) of 9 is 0.7.
The calculated coefficient for KCPE scores and 2010 entry exam is 0.733. Since the two calculated values of significance are greater than the critical value of 0.7, the null hypothesis H03 that there is no significant relationship between KCPE performance and formative evaluation is rejected. We conclude that there is significant relationship between performance in KCPE and formative evaluation.
Discussions
Gitugi education zone appears to portray similarity in trends with national performance in KCPE from 2007 to 2011. There was a marked improvement from 2007 to 2008 both nationally and at the area of study. The next three years show a downward trend nationally and in the zone. Two schools in the zone however marked improvements in the two years which may explain the statistical test result that there is difference in at least one of the means.
The findings show that there is significant difference in the KCPE mean scores among the nine schools in the zone. This implies that there is a greater difference between the different schools than within each individual school itself. If it is presumed that the schools operate under similar conditions then it can be surmised that there are other underlying differences among the schools that result in the observed differences in performance in KCPE. The fact that ranking across the years remains almost unchanged may point to the maintenance of similar practices in individual schools thereby resulting in little or no competition among the schools. Nevo (1995) indicates that the function of students’ evaluation is to provide information for the improvement of learning. These findings can thus provide a basis upon which inquiries can be made into how strategies can be developed that increase effectiveness in teaching and learning.
Across cohorts the low significance value indicates that the difference in performance across cohorts is less than within individual cohorts. This agrees with the first observation since performance within a cohort includes performance among the different schools in that year. This strengthens the supposition that there are differences among the schools that result in the differences in performance in KCPE in Gitugi education zone.
According to Barnes (2004), analyzing students’ performance creates habits of inquiry, reflection and actions that fuel continuous school improvement. A report for the Ministry of Education (2012) in the Netherlands explains the critical importance of analyzing assessment and evaluation scores for improvement of the school systems and student achievement scores.
The Spearman rank coefficient indicated that there is significant relationship between performance in KCPE and formative evaluation in the schools. According to Chiarellot (1994) and Renner (1978), formative evaluation provides feedback for improvement. It indicates a student’s relative position at the time so that the students’ efforts can be directed more profitably.
In a report to UNESCO, it is emphasized that school improvement strategies that are based on analysis of students’ evaluation data are the most effective (UNESCO, 2004). It would thus be helpful if schools developed effective formative assessment and evaluation policies that would more effectively address their unique circumstances. The analysis of such evaluation would highlight more clearly what the school needs to change to facilitate improvement in test scores.
CONCLUSION AND RECOMMENDATIONS
unearthed to help explain the observed poor performance, and the differences that result in maintenance of near the same ranking.
There are many impediments to progress towards improving performance in schools. Limited resources and facilities, insufficient capacity, inefficient resource allocation and wastage are possible hindrances towards improvement (Brann,2006). Although the trends in Gitugi seem similar to those posted nationally, it is important for the stakeholders in the zone to compare favorably locally. The zone has a mean far below that of the province and district in all the five years which were 250.25 and 234.11 respectively in 2010.
The inconsistence in performance may also be studied to highlight the issues that oscillate within the community or the schools. This would lead to inquiries on how best to protect schools against any adverse external or internal occurrences, thus improve effectiveness. It may also persuade stakeholders to analyze each examination for each year, and the characteristics of each cohort that sits the exam to understand the dynamics that influence their performance as they prepare the next cohort for the next examination.
The posting of annual KCPE results generates anxiety which most often produces knee-jack reactions without addressing the past from which the results derived. Equally comparing learners from different cohorts using different examinations may result in distortion of how schools should improve.
In conclusion analysis of trends in KCPE performance in gitugi education zone is helpful as it points out that there are differences in the schools, that some schools are not doing as well as they should across the years and, that there is continued decline in performance at the final stage of learning in class 8. Effective use of formative evaluation analysis would help to improve performance. There is need to conduct detailed studies on what may be the influencing factors that result in the prevailing trends in KCPE performance observed in the zone. Performance in examinations is only one indicator of the state of a school.
REFERENCES
Barnes, D.F. (2004). Inquiry and action: Making school improvement part of daily practice.
annerberginstitute.org
Brann, H., Kanjee,A., Bettinger,E. & Kremen, M. (2006). Improving education through assessment , innovation and evaluation. Cambridge: American Academy of Arts and Sciences. www.amacad.org
Chantanavich,A., Chantanavich,C., & Fry, G.W. (1995). Evaluating Primary education: Qualitative and quantitative policy studies in Thailand. Ottawa: International Research Centre.
Chinapah, V., H’ddigui, M., Kanjee, ., Falayojo, W., Fomba,C.O., Hamissou,O., Rafalimanana, A. and Byamugisha,A. (2000). Wjth Africa for Afric: Towards quality education for all. Pretoria: Human Science Research Council. www.amacd.org .
Chiarellot,L., Davidman,L &Ryan, K. (1994). Lenses on teaching: developing perspectives on classroom life. London: Harcourt Brace College Publishers.
Daily Nation, 29th December, 2010. ‘Overall KCPE grades decline for yet another year.’ At [email protected]
Daily Nation, 30th Dec. 2010. “How schools rank” at [email protected]
Hanushek, E.A. (2007). Education production function. Palgrave encyclopedia. Stanford University.
Haris, A. & Bennet, N. (2001). School effectiveness and school improvement: Alternative perspectives. London: Continuum Publishers.
Kellaghan, T. & Greaney, V. (2003). Monitoring perfomance: Assessment and examination in Africa. ADEA, Mauritius.
Krueger, A.B. (1999). “Experimental estimates of education production functions”.Quarterly journal of economics 114, no. 2 (May): 497 – 532.
Ministry of Eduction, Netherlands. (2012). OECD Review on evaluation and assessment frameworks for improving school outcomes. www.oecd.org/edu/evluationpolicy.
Nevo, D. (1995). School-based evaluation:A dialogue for school improvement. Israel: ElsevierScience Ltd Nyangosia, P.A. (2011). Kenya Certificate of Primary Education (KCPE): Exam results analysis, Provincial
Education Board, Central Province.
Onderi, H. & Croll, P. (2008). Factors associated with differential school performance in Gucha District of Kenya. Research in education: an interdisciplinary research journal. No. 80 pp 15 – 25. University of Bradford, Bradford.
Kampala: Uganda Bookshop Press.
Orodho,A.J.(2014).Policies on Free Primary and Secondary school Education in East Africa: Are Kenya and Tanzania on course to attain education for All (EFA) Goals by 2015? International Organization of
Scientific Research( IOSR) Journal of Humanities and Social
Sciences.Vol.19,Issue1,Ver.V(Jan,2014),pp11-20 www.iosrjournals.org
International Journal of Education and Research.Vol.1.No.11 November2013.www.ijern.com
Renner, J.W., Shepherd, G.D. & Bibbons, R.F. (1973). Guiding learning in the elementary school. New York: Harper and Row Publishers.
Republic of Kenya, (2005). MoEST, Sessional paper No. 1, 2005. Policy framework for education, training and research: Nairobi, Government printer.
Republic of Kenya .(2013). The Basic Education Act 2013 No.14 0f 2013. Nairobi.
Republic of Kenya/UNICEF( 2012).Education for All (EFA) End of Decade Assessment (2001-2010). Ministry Of Education and INICEF. Nairobi.
The Open Institute. (2013). The state of primary education in Kenya. At http://globalopendatainitiative.org UNESCO (2004). School evaluation for quality improvement. http://www.unesco.org/iiep.
UNESCO (1996). A Report on Study of Education Sector in Rwanda. Kigali: UNESCO.
Woodford, K., Jackson, G., Gillard, P., Harley, A., Cranz, D. and Glennon, D (Eds.). (2003) Cambridge
Advanced Learners’ Dictionary. Cambridge: Cambridge University Press.
Young, B. L. (1982). Teaching Primary Science (4th Ed.). London: Longman Press.
Wasanga, P.M. & Kyalo, F. (2007).National assessment initiatives and their impact on quality of education. Kenya National Examinations Council.