COGNITIVE SKILLS, INNOVATION AND
TECHNOLOGY DIFFUSION
GEORGE MESSINIS AND ABDULLAHI AHMED
George Messinis
†and Abdullahi D. Ahmed
Centre for Strategic Economic Studies,
Victoria University
Australia
Abstract
This paper examines the Benhabib and Spiegel (2005) model of technology diffusion using a new latent index of human capital and competing indicators that include the Barro and Lee (2010) estimates. The new index is a measure of education quality for seventy nations in 1970-2003. Analysis utilises both cross-section and dynamic panel GMM estimation and extends beyond the Cobb-Douglas production technology. The new evidence indicates that (i) the new index is most consistent with the model; (ii) the skills-education gap has widened in Africa and advanced OECD countries, and (iii) capital-skill complementarities and skill-biased-technical-change have become global phenomena.
Keywords:Education; Skills; Human capital; Growth; Innovation; Diffusion; CSC; SBTC
JEL Classification: I2, O1, O3, O4
†
CSES Working Paper No. 48 3
1.
Introduction
Human capital1 is considered to be the engine of economic growth2 and there exist
several models that seek to explain this. Nelson (2005) has condensed these into two
schools of thought: accumulation theories and assimilation theories. The first envisage
a direct effect of human capital on labour productivity as an explicit factor of
production embodied in effective labour. This approach suggests that it is new
investment in human capital that matters for growth. The second school of thought
explores the relation between the level of human capital and total factor productivity
growth or technological change; the emphasis here is on the link between human
capital and disembodied knowledge as manifested in technology. The accumulation of
human capital is highlighted by the former school while it is the stock of human
capital that is important in the latter; what Dowrick (2003) calls growth effects and
level effects respectively.
Assimilationist theories have emerged as a synthesis of two ideas. One is that
greater understanding of the role knowledge and skills play can shed light on the
process of technology growth. This draws on earlier insights on the link between
R&D, innovation and market value in Schumpeter (1934) and Griliches (1981) and is
central in models of endogeneous growth highlighting the role of innovation and
sustainable growth (Romer 1990; Aghion and Howitt 1998).3
The second idea highlights knowledge externalities as the source of spillovers
from technology leaders to less developed countries. However, the adoption of
foreign technology depends on the ‘absorptive capacity’ of the imitator (Wolff, 2001;
Falvey, Foster, and Greenaway 2007). Human capital is a key determinant of
absorptive capacity since it enables workers to understand and assimilate new
technology; a particular formulation of the convergence process whereby less
developed economies catch-up with the developed world.4 The idea originates in
Nelson and Phelps (1966) who assessed education to be a catalyst in the diffusion of
1
Although human capital has been defined as the ‘knowledge, skills, competencies and other attributes’ that are relevant to economic activity (OECD, 1998), the empirical growth literature has overwhelmingly utilised educational attainment as a proxy.
2
See Nelson and Phelps (1966), Aghion and Howitt (1998), Barro (2002), Nelson (2005), Hanushek and Wößmann (2007), and Ehrlich (2007).
3
There are also attempts to reconcile these two traditions in a unified growth theory. Examples are Aghion, Howitt and Murtin (2010), Galor and Weil (2000) and Galor (2005).
4
CSES Working Paper No. 48 4
new technologies. Their model rests on two key assumptions: the further away an
economy is from the technology frontier, the greater the potential rate of catching up;
and the larger the human capital the bigger is the capability to learn and adopt the new
technology.
Benhabib and Spiegel (1994) integrate the two ideas in a generalised model that
attempts to explain both innovation and technology diffusion. The model builds on
the intuition that the two views of human capital are complementary, for they explain
different stages of economic development; i.e., nations closer to the technology
frontier have accumulated high levels of human capital that could support innovation
while countries far from the frontier focus on technology diffusion.5
Although intuitively appealing, the original Nelson-Phelps hypothesis, suggests
that the imitation of foreign technology is always beneficial since workers can ‘follow
and understand new technological developments’ (Nelson and Phelps 1966, p.69).
Moreover, the hypothesis implies that a backward economy could develop rapidly by
simply relying on human capital and imitation. As acknowledged by Benhabib and
Spiegel (2005), this seems to ignore barriers to free-riding and absorption of new
technology. In particular, it contradicts Schumpeter (1934) and economic intuition
that emphasise the role of intellectual property rights.
New evidence in the 1990s motivated further progress in assimilationist theory.
First, the Solow ‘residual’ or total factor productivity (hereafter TFP) explained most
of the cross-country differences in growth rates. Second, per capita incomes for a
number of countries seemed to diverge rather than converge.6 Third, substantial
investment in education failed to insulate less developed countries (LDCs) from
stagnation (Pritchett, 2001). In order to account for the above limitations, Benhabib
and Spiegel (2005) extend the Nelson-Phelps model7 by considering a logistic
diffusion process that allows for impediments to imitation and divergence in world
income. In a cross-sectional empirical application, the authors find the logistic
diffusion model to be superior to the exponential model of Benhabib and Spiegel
(1994) in explaining world income growth patterns. Further, the authors identify a
number of countries at risk of falling into poverty traps.
5
This has been empirically confirmed by Vandenbussche, Aghion and Meghir (2006).
6
As summarised in Temple (1999) and Easterly and Levine (2001).
7
CSES Working Paper No. 48 5
The principal objective of this paper is to re-examine the Benhabib and Spiegel
(2005) model of logistic diffusion with two key innovations. First, the paper utilises a
new measure of human capital that focuses on the complementarity between skills
acquired through schooling and IT equipment related facilitating the application of
cognitive skills. In brief, the new human capital index is a composite latent index of
three key indicators: the share of the adult population who have completed secondary
education; per capita scientific research output in science, and per capita trade in IT
educational equipment. This rests on the idea that technological growth requires both
cognitive skills and their application at the workplace. IT educational equipment
reveals the degree to which cognitive skills are employed by the adult population.
Second, we account for model uncertainty by considering alternative forms of
production technology,8 alternative estimates of human capital, and alternative
estimation techniques. Thus, in testing the Benhabib and Spiegel (2005) hypothesis,
we run the new index in a horse race against competing measures of human capital.
Also, we relax the assumption of a Cobb-Douglas production function to consider two
alternative forms: the constant-elasticity of substitution (CES) function of Duffy,
Papageorgiou, and Perez-Sebastian (2004), and the translog production function of
Papageorgiou and Chmeralova (2005). These extentions are motivated by mounting
evidence in favour of capital-skill complementarities (CSC) and
skill-biased-technical-change (SBTC). Finally, the paper employs both dynamic panel data and
cross-sectional data econometrics to gain insights on the dynamic relation between
human capital and growth, and to address concerns associated with measurement
errors.9
The paper is structured as follows. Section two traces the evolution of technology
diffusion theory and outlines three key models. Section three presents the new latent
index of human capital and tests its reliability. Section four reports the estimation
results in testing the logistic diffusion model of Benhabib and Spiegel (2005). Section
five conducts sensitivity analysis and section six and concludes.
8
By convention, the term ‘production technology’ refers to the form of the production function, in contrast to the term ‘technology’ that stands for total factor productivity, TFP.
9
CSES Working Paper No. 48 6
2.
Knowledge Diffusion: Three Models
In general, theories of human capital and growth define output, Y, to be of the
general functional form: Y j t, F (Aj t, (H j t, ) , X1 ,j t, ...,X n j t, )where Yj, t is
per capita output in country j in period t, A represents technology being a function of
human capital, H, and X1, …, Xn are n factors of production that may also include H.
Assimilationist theories focus on A. Here, we outline three models of technology
diffusion with a Cobb-Douglas production function, as first proposed. For brevity, we
drop the country indicator that is implicit. We begin with the Benhabib and Spiegel
(1994) model with the production function:
0
t t t t
Y A K L (1)
where A0, K, L and represent initial technology, physical capital, labour and an
error term respectively. Note that technology cannot be seen independently of human
capital (i.e., the idea of human capital being the ‘engine of growth’ in endogeneous
growth theory). Combining the role of human capital and technological development
– where a country’s level of human capital enhances absorption of its own and foreign
technology – Benhabib and Spiegel (1994) specify technological progress, a, as:
max max
( )
t t t
t t t t t t
t t
A A A
a gh mh g m h mh
A A
(2)
Here, ht is the natural logarithm of Ht, and g, m >0.10 In this equation, the first term
represents domestic innovation and the second term is the Nelson and Phelps (1966)
idea of technological diffusion being the product of a country’s level of human capital
(i.e., absorptive capacity) and the ‘distance to the frontier’ (i.e., the gap between the
technological level of a leading country,Atmax, and that of the home country, At). Benhabib and Spiegel (1994) take the log difference of (1) and substitute for (2) to
arrive at the growth equation:
10
Benhabib and Spiegel (1994) specify Ht instead of ht and then equate Ht with educational attainment.
We draw on Krueger and Lindahl (2001) and adopt the Mincer approach to specifying human capital as an exponential function of schooling. The end result is the same since in this study it is ht that equates
CSES Working Paper No. 48 7
max
( ) ( )
c k
t t t t t t t t
y
l g m h mh A A u (3)
where yt, kt and lt are Yt, Kt and Lt in logs respectively. Equation (3) predicts that,
in addition to growth in physical capital and labour, k and l, economic growth will also depend on the stock of human capital and the distance to the frontier; ut is a
serially correlated error term. Note, technology diffusion is an exponential process;
i.e., countries further away from the frontier catch-up faster than those closer, and any
country in some distance from the frontier could specialise in imitation without any
R&D effort (Jones, 2008). Further, the model also implies that imitation could be
more beneficial than innovation for countries closer to the frontier, as long as the
distance to the frontier is greater than (g-m)/m.
In a second model, Dowrick and Rogers (2002) propose a model that is different
to Benhabib and Spiegel (1994) in three ways. First, it accounts for growth effects by
allowing human capital to enter as a direct factor of production. Second, although it
maintains Nelson and Phelps’ (1966) original idea of diffusion, it does not admit a
human capital effect in local innovation. Third, it controls for neoclassical
convergence; that is, initial per worker output, Y0, enters as an independent factor.
More formally, their empirical specification is of the type:
0
max
ln(Y ) ln( ) k
t t t t t t t
y mh A A
h u (4)
Dowrick and Rogers (2002) define yt as the growth rate of real GDP per worker. The first two terms in (4) represent a hybrid model of technological catch-up:
neoclassical convergence to the steady state of y, and technology diffusion. Note the
fourth term allows for growth effects as in Lucas (1988).
A third model is that of logistic diffusion as proposed by Benhabib and Spiegel
(2005). They modify (2) to acknowledge the potential for poverty traps due to barriers
to assimilation of foreign technology. Logistic diffusion again emphasises the
interaction of human capital and the technology gap except that the rate of adoption of
foreign technology is further moderated by the inverse of the distance to the frontier11
11
CSES Working Paper No. 48 8
due to technology clusters or an incompatibility with domestic technology or social
values (Rogers, 2005). More formerly, logistic diffusion takes the following form12:
max
max ( ) max
t t t t
t t t t t t
t t t
A A A A
a gh mh g m h mh e
A A A
(5)
Compared to the exponential model in (2), diffusion in (5) is moderated by the
inverse of the distance to the frontier, also known as ‘backwardness’, (A/Amax). As a
result, the innovation effect of human capital is relatively larger and the catch-up
process is slower when the country is very far or very close to the frontier.
3.
A New Index of Human Capital
3.1 Background
Due to data limitations, existing international studies on the role of human capital
in technology diffusion have overwhelmingly adopted educational attainment as a
proxy for human capital.13
Benhabib and Spiegel (2005, 1994) and Dowrick and Rogers (2002) abstract from
measurement issues and utilise educational attainment measures of human capital.14
However, these measures are highly problematic in international studies for several
reasons.15 First, they are poor indicators of education quality. Second, they ignore
factors other than formal education that impact on skill formation, and fail to measure
the level of skills that are actually employed at the workplace.16 Last but not least
12 max
( c) t c t( t/ t )s
a g h h A A s s
is the more generalised model proposed by Benhabib and Spiegel
(2005). It nests two limiting cases: the exponential diffusion model of Benhabib and Spiegel (1994) when s=-1, and the logistic model when and s=1. On the basis of the evidence in Benhabib and Spiegel (2005), this study considers only these two scenarios.
13
It is only recently that alternative, broader definitions have surfaced in the empirical literature. Hanushek and Wößmann (2009; 2007) and Jones (2008) emphasise cognitive skills while Aghion, Howitt and Murtin (2010) highlight the role of health.
14
Note, existing panel studies employ data that pre-dates 1990 and so do other diffusion models such as Acemoglu, Aghion and Zilibotti (2006). The study by Aghion, Howitt and Murtin (2010) is an exception, though it does not employ educational attainment as a measure of human capital and only OECD countries are considered in system GMM estimation.
15
For a review of measurement errors in the estimation of educational attainment, see Cohen and Soto (2007). This literature is beyond the scope of this study.
16
CSES Working Paper No. 48 9
important, they often evolve in correlation with other macroeconomic variables that
introduces endogeneity biases in estimation.
More recently, the literature has searched for qualitative measures of human
capital. One possibility is the relaxation of the Nelson and Phelps (1966) assumption
that all education is useful for technology diffusion. Thus, Acemoglu, Aghion and
Zilibotti (2006), Ciccone and Papaioannou (2005), and Vandenbussche, Aghion, and
Meghir(2006) decompose education and suggest that primary or secondary education
is more suitable for adoption while higher education is best for innovation.17 Although
higher education can intuitively contribute to economic innovation (Romer 2000), the
variable is also susceptible to reverse causality (Bils and Klenew 2000) and
appropriate instruments are hard to find at the national level (Vandenbussche, Aghion,
and Meghir 2005; Aghion et al. 2009).
An alternative account invokes the Mincerian approach to human capital that
seeks to decipher two key insights. One is that human capital is a composite index of
cognitive skills acquired at school, and the net effect of work experience, training and
skill depreciation. Moreover, the current market value of these skills can vary over
time and across nations.18 This is the general methodology employed here at the
macro-level to account for the quality of education (i.e., cognitive skills).
The potential discrepancy between education and skills has been emphasised in
various forms. One expression is Sen’s (1997) distinction between ‘human capital’
and ‘human capability’ where the latter emphasises ‘functionings’ (i.e., outcomes and
achievements) that enable people to participate in markets and adapt to change (Lanzi,
2007). Another is the ‘knowing-doing gap’ that Joss (2001) describes as the ‘ability to
implement what is known’ and not abstract knowledge. The innovation literature also
pays attention to a balance between the ‘body of practice’ and the ‘body of
understanding’ as key to explaining knowledge transfer (Nelson, 2005). Finally, the
gap between schooling and skills is implicit in the literature of job training (Borghans
and Heijke, 2005; Nordman and Wolff, 2007; Destre, Levy-Garboua, and Sollogoub,
2008; Robst, 2007).
17
Hanushek and Wößmann (2007) and the skill decomposition approaches are two interpretations of why education failed to stimulate growth in less developed countries (Pritchett 2001). The latter approach suggests that a single indicator of human may be limiting when assessing the human capital-diffusion nexus.
18
CSES Working Paper No. 48 10
Hanushek and Kimko (2000) depart from quantitative measures of education to
jointly consider quantitative and qualitative indicators in growth equations. They find
that international test scores of student achievement in mathematics and science,
TIMSS, are significant predictors of growth. Coulombe, Tremblay, and Marchand
(2004) and Hanushek and Wößmann (2009, 2007) confirm a link between test scores
and economic performance19. The latter study suggests that the skills-education deficit
is greater in developing countries20 and quality indicators are less susceptible to
estimation problems such as endogeneity, although recent evidence suggests that
selection and endogeneity biases remain (Glewwe, 2002; Paxson and Schady, 2007).21
3.2 A New Human Capital Index
In this section, we consider human capital as a composite index that jointly
accounts for the following key dimensions of human capital: cognitive skills acquired
at school, cognitive skills used in scientific research, and the employment of modern
educational IT equipment as complementary to cognitive skills. Hence, the new index
seeks to measure cognitive skills as currently employed by the adult population.22
In an exhaustive literature survey on the history of human capital measurement,
Folloni and Vittadini (2010) strongly recommend the search for human capital as a
latent variable. They maintain that the approach is in the spirit of Schultz’ (1961)
emphasis on ‘knowledge and skills that have economic value’. The emphasis on value
is in the light of (a) time-varying returns to education (Psacharopoulos and Patrinos,
2004; Hartog and Oosterbeek, 2007); (b) the importance of skill obsolescence
(Alders, 2005; Gorlich and de Grip, 2007; Pfeiffer and Reuß, 2007), and (d) evidence
of skill-job mismatch and overeducation (Cheng and Ghulam, 2007; Korpi and
19
In contrast, Jones and Schneider (2006) and Jones (2008) utilise the cross-section international IQ test scores published by Lynn and Vanhanen (2002).
20
An early but brief observation of the skills deficit in developing countries was by Tsoukalas (1976). His data clearly show that less developed Southern European countries in 1960 had markedly lower rates of tertiary student enrolments in applied sciences and technology than the more advanced OECD economies.
21
Lévy-Garboua et al. (2004) challenge the idea that test scores are good indicators of human capital. They call for a return to the notion of ‘market value of school outputs’.
22
CSES Working Paper No. 48 11
Tahlin, 2007). Further, several studies have also proposed the latent factor approach
as a strategy in dealing with measurement errors and endogeneity.23
We exploit new data not available to Hanushek and Kimko (2000) and Dagum and
Slottje (2000) in order to estimate a new index of human capital as an unobservable
latent factor that measures the level of skills acquired in secondary education that are
employed by the adult population; we maintain that this composite index measures the
level of cognitive skills employed by the adult population. Hanushek and Kimko
(2000) utilise international test scores in maths and science (TIMSS) to impute
cross-section measures of cognitive skills from regressions, assuming that quality of
schooling evolves slowly over time. Dagum and Slottje (2000) estimate human capital
as a latent variable using household survey data. However, none of these indicators
are direct measures of intelligence or education quality (Le, Gibson, and Oxley 2003).
We utilise a multiple-indicator model with one latent common factor:
, S ,
k jt k k jt k jt
I h e (6)
Ik,jt is the log of indicator k=1,…,n of country j at time t, h S
is the common factor,
k is the factor loading, and ek is an idiosyncratic error term. The common factor is the unobserved characteristic of cognitive skills that drives the n indicators. In search for
appropriate indicators, we consider variables that proxy several dimensions of applied
cognitive skills by the adult population. We select the following three series, in logs:
the share of the adult population who completed secondary education, SECO, per
capital scientific publications in science, SciP, and per capita trade in research IT
equipment, RITE.24 The use of secondary education as a key indicator is suggested by
Rogers (2008) and is highly relevant in this study where the emphasis is on research
skills. Persons who have completed secondary education are expected to have
acquired basic research skills that are critical for frontier research as well as
understanding new technology. It also seems intuitive that the SciP bibliometrics
measure would reflect the quality of human research capital. Gault (2005) argues that
the process of knowledge creation - closely interlinked with technological progress -
by academic scientist can be measured by academic publications. Finally, RITE is to
23
See, for instance, Temple (1999), Durlauf, Johnson and Temple (2005), and Heckman, Stixrud, and S. Urzua (2006).
24
CSES Working Paper No. 48 12
acknowledge the importance of information technology as key in the application of
cognitive skills and research. The focus on educational IT also rests on economic
intuition of a link between trade and skilled human capital (Galor and Weil, 2000) and
the importance of trade as a means to technology transfer (Apergis, Economidou, and
Fillipidis, 2009; Madsen, 2007). Here, however, we focus on trade of IT equipment
that directly relates to cognitive skills, research capacity and, thus, the quality of
education.
SECO and SciP contain information on cognitive skills while RITE contributes
information on the level of applied research skills. The existence of a single principal
factor common to all three indicators is likely to measure cognitive skills that have
economic value. We acknowledge that the single index approach adopted here may be
limiting if the role of human capital in innovation and diffusion can only be captured
by multiple measures of human capital. Also, to the extent that the new single latent
factor captures an effect other than human capital, our approach would be an
imperfect measure of human capital. However, both of these claims are still an
empirical question. We maintain that the selected indicators are essential components
of the human capital index targeted here.
These three indicators (i.e., SECO, SciP, and RITE) enter in iterated
principal-component factor analysis. Table 1 presents the factor score estimates for the three
indicators. Not reported here are eigenvalues and model selection information criteria
(AIC and BIC) that clearly indicate the existence of a single factor. The estimated
factor scores suggest that per capital trade in IT research equipment, RITE, is the most
important indicator of the three with a weighting of 0.61 in the early 1970s that rises
to 0.74 in the late 1980s and back to 0.66 in the most recent period. Scientific
publications contribute about 20% to the principal factor but secondary education
seems to play a very small part towards cognitive skills. Not reported due to space
limitations, factor loading estimates suggest that secondary education and scientific
research are important ingredients in the formation of human capital. Morever, the
resuls suggest that it is cognitive skills that associate with IT equipment that is the
most important component of human capital.
CSES Working Paper No. 48 13
The new human capital index, henceforth denoted as SKILLS25, may be measured
with error. In reliability tests, we compare the new index to the following alternatives:
average years of education by Barro and Lee (2010), EDU; average years of education
of Cohen and Soto (2007), EDU_CS; and TIMSS tests scores.26 Assume h1 and h2 are
two alternative estimates of the true series, h*. Following Krueger and Lindahl
(2001), the reliability ratio of series h1 with respect to h2 is R(h1,h2)=cov(h1,
h2)/var(h1). If the measurement errors of h1 and h2 are uncorrelated, the probability
limit of R(h1,h2) is var(h*)/[var(h1)+ var(e1)] where e1 isthe measurement error of h1.
Thus, the reliability ratio ratio represents the fraction of the variance of h1 that is due
to the true variance of h*. Given that R(h1,h2) is the coefficient estimate of h1 in a
bivariate regression with h2 as the explained variable, Table 2 presents reliability
ratios for the four measures in levels, and conditional on the log of per capital real
GDP in 1970-73. These are bivariate bootstrap quantile regression coefficient
estimates.27 When compared to EDU, the reliability ratio of SKILLS in levels is 1.03
while that of EDU is 0.73. The new index also seems to perform better against
EDU_CS and TIMSS. Table 2 shows that SKILLS also outperforms all three
alternatives in conditional regressions.28 Overall, we conclude that the new latent
index of ‘cognitive skills’ performs better than existing measures.
- Table 2 about here -
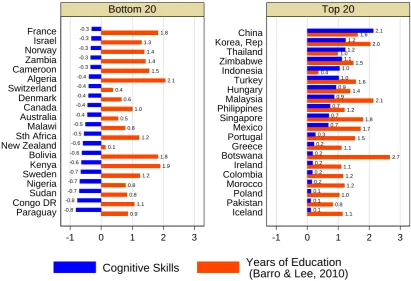
Figure 1 compares the performance of individual countries over time in terms of
months of education, EDU, and cognitive skills, SKILLS. It measures the average
annual change over the period of 1975-2003. Clearly, some countries that experienced
growth in educational attainment were amongst the bottom 20 in terms of employable
cognitive skills, SKILLS. Sweden, Nigeria, Sudan, Congo Democratic Republic and
Paraguay were amongst the worst performers. In contrast, applied cognitive skills
surged in China, the Republic of Korea, Thailand, Zimbabwe and Indonesia. For
example, the SKILLS index in Indonesia has recorded an annual average increase of
25
Data, programs and panel estimates of the SKILLS index are available on request.
26
The Appendix has more details. Note, for comparability, EDU_CS, TIMSS and SKILLS were rescaled into equivalent years of education, EDU, using robust panel FGLS, for Lane (2002) shows that GLS estimation minimises the bias in random variable transformations.
27
Similar results were obstained when robust regressions were employed.
28
CSES Working Paper No. 48 14
(education equivalent) one month. Most striking is China with a record change of 2.1
months increase although it has recorded only an annual 1.6 months rise in years of
education, EDU.
- Figure 1 about here -
Figure 2 illustrates the education-skill gap for six regional groups: advanced
OECD20 countries, South America, Asia (excluding Japan and South Korea), Africa,
transitional economies in Europe and South Europe.29 The results confirm the
Hanushek and Wößmann (2007) finding of a ‘skills deficit’ in developing economies;
i.e., developed countries are further behind on measures of cognitive skills than they
are with respect to average years of formal education, EDU, that has surged in most
regions. Further, the new SKILLS index suggests that the stock of employable
cognitive skills has been on a secular downward trend since 1970-74 in Africa, it has
improved through to 1980s but fell in the 1990s in South Europe, and it has been
volatile without any long-term trend in East Europe and in South America. More
surprising, the index has declined sharply in OECD20 countries since the 1980s. In
addition, Asia has witnessed the greatest gains in cognitive skills over the whole
period, although it remains behind the levels recorded in Europe and OECD countries.
- Figure 2 about here -
4.
Panel and Cross-section Estimation Results
This section re-examines the logistic diffusion model of Benhabib and Spiegel
(2005) in (5) using three alternative measures of human capital are utilised to test. In
order to account for heterogeneity and the potential for endogeneity, we employ the
System GMM panel estimator of Arellano and Bover (1995).30 Although lagged
variables are not a full proof strategy against endogeneity, lags 2-4 are used to
29
The OECD20 group comprises of Austria, Australia, Belgium, Canada, Denmark, Finland, France, Germany, Iceland, Ireland, Japan, Korea, Mexico, Netherlands, New Zealand, Norway, Sweden, Switzerland, UK and the USA. Italy, Greece, Portugal and Spain form the ‘South Europe’ group.
30
CSES Working Paper No. 48 15
instrument human capital stock, h, and technology diffusion, h(A/Amax). The ceiling
on the number of instruments is intended to limit the problem of proliferation of
instruments that can overfit endogenous variables (Roodman 2009a).
We utilise the new latent index of cognitive skills, SKILLS, in system GMM
regressions to estimate the three models of technology diffusion outlined above. For
comparison, we express the Benhabib and Spiegel (1994) and Dowrick and Rogers
(2002) models in terms of a as the dependent variable. It can be shown that the results clearly point to the logistic model of diffusion as the model most consistent
with the data.31
Below, we focus on the main objective of this paper which is to re-examine the
Benhabib and Spiegel (2005) model of logistic technology diffusion utilising three
alternative measures of human capital: the average years of education series of Barro
and Lee (2010), EDU; the original TIMSS series (TIMSS), and the new latent index
of cognitive skills, SKILLS.32
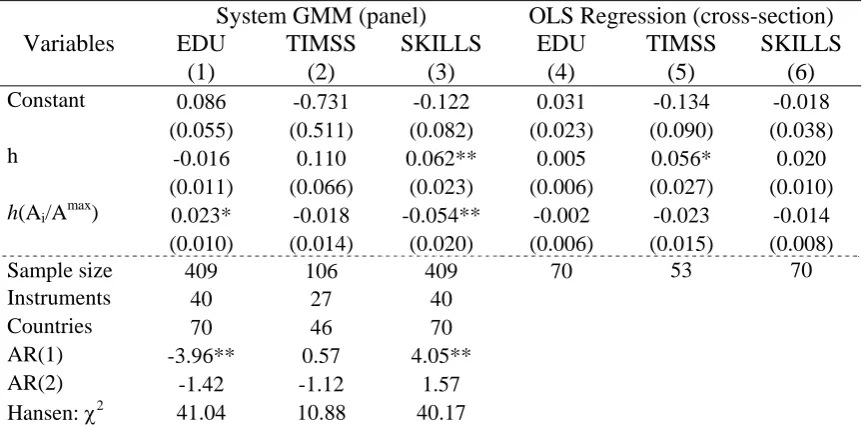
Columns 1-3 in Table 3 present system panel GMM estimates of the Benhabib and
Spiegel (2005) model. Note that the data reveal that USA is the technology leader.33
Regression (1) utilises years of education, EDU, regression (2) uses TIMSS test
scores, and regression (3) utilises the new cognitive skills measure, SKILLS. The
results indicate that only when the SKILLS series is used as a measure of human
capital we obtain statistically significant coefficients that have the expected sign. The
coefficient estimates in column (3) suggest that SKILLS contribute to both domestic
innovation and technology diffusion. The net effect of human capital on total factor
productivity growth depends on how far from the frontier a country is. For the leader,
the net productivity growth effect of one (education equivalent) year of cognitive
skills is 0.008 (=0.062-0.054), the domestic innovation effect. For the median country,
the net effect would be 0.035 (=0.062 - 0.5*0.054).
Table 3 also reports the number of instruments used, the number of panel units, the
Arellano-Bover AR(1) and AR(2) tests for autocorrelation, and the Hansen test of
over-identifying restrictions. While the AR(1) is expected to be significant at 5%
31
Details are available upon request.
32
An earlier draft also used the Cohen and Soto (2007) estimates of years of education and the log of secondary education attainment, SECO, from Barro and Lee (2010) in all regressions. The results were similar to those reported for EDU here. Estimates are available on request.
33
We follow Benhabib and Spiegel (2005) to estimate the log of TFP or ln(At) as a residual by
CSES Working Paper No. 48 16
level, AR(2) is a specification test. In all regressions the AR(2) and Hansen statistics
are not significant, the latter confirming the validity of the instruments used.
- Table 3 about here -
Benhabib and Spiegel (2005) also explore the implications of the logistic diffusion
process for developing nations and their capacity to catch up with the developed
world. That capacity, they argue, depends on a critical threshold level of human
capital. Nations with human capital levels below that threshold stagnate and can
remain behind for decades. They derive this threshold or ‘catch-up condition’ to be:
max
* ln( )
exp t
t
sg h
h
sg m
(7)
In the case of logistic diffusion, s=1, htmaxis human capital in the leading country in period t (see footnote 12), and g and m are parameter estimates of the human capital
stock and diffusion parameters in model (5). Condition (7) reflects the challenges of
cathing up with the technology leader: the higher g or hmax the harder it is to catch up
while the reverse holds when m is large.
Benhabib and Spiegel (2005) used the Barro and Lee (2001) estimates of average
years of education as a proxy for human capital. They estimated h* to be 1.78 in 1960,
and 1.95 in 1995. In 1960, there were 27 countries with EDU being below the
threshold. By 1995, the number of nations at risk had declined to 4. We emulate their
approach using the new index of human capital and the empirical estimates in
regression (3) in Table 3. Figure 3 summarises the results by human capital and
distance to the frontier in 1970, D1970, for three sub-groups using h* and the top 25%
quartile of D1970 (i.e., the frontier, that happens to be the USA) as thresholds.
Using the new index of human capital, we find that there were 13 countries that
were unable to meet condition (7) in 1970. Three decades later, that number had risen
to 15 in 2000-03.34 This finding contrasts with that of Benhabib and Spiegel (2005)
34
CSES Working Paper No. 48 17
reported above and calls for greater attention to skills that matter in development
policy. Intuitively, the main cause of the inability of countries at risk to catch up with
the rest of the world is the low level of h in the context of a relatively low diffusion
effect (i.e., 0.054) – as compared to the local innovation effect of 0.008 – which is not
sufficient to offset the local innovation gains in advanced economies. The result is
consistent with Hulten and Isaksson (2007) who find that the gap between rich and
poor is likely to persist for some time.
- Figure 2 about here –
The top panel of Figure 3 illustrates the fact that nations that failed to meet the
‘catch-up condition’ (top left) experienced minimal TFP productivity growth since
1970-74. On the other hand, countries that were far from the frontier and met
condition (7) grew faster than others (see top centre). As a result, economies with very
low levels of human capital stock in 1970-74 failed to catch-up; that is, they witnessed
little change in terms of their level of backwardness in 2000-03 (bottom left). In fact,
in this group, small improvements in human capital associate with divergence. In
contrast, nations far from the frontier in 1970-74 seem to have improved their relative
position substantially in 2000-03 as a result of investment in cognitive skills (bottom
centre). Developed nations closest to the frontier (bottom right) have benefited little
from diffusion but are still leading (i.e., close to the frontier) as a result of the
combination of a positive local innovation effect and a high cognitive skills stock.
So far, empirical work has explored panel data in an attempt to expand the sample
size and control for reverse causality. However, panel data estimators can magnify
measurement errors (Hauk and Wacziarg, 2009; Durlauf, Johnson and Temple, 2005).
Thus, we next turn to cross-country regressions using total sample period averages of
the key variables. Regressions (4)-(6) in Table 3 present the estimation results which
suggest that only the TIMSS coefficient estimate of h in regression (5) is statistically
significant and with the expected sign. However, the estimate is implausibly large
when compared to that of h(A/Amax),35 although the limited observations in regression
(5) make comparisons difficult.
35
This is the context of poverty traps and equation (7) above. It can be shown that the large h
CSES Working Paper No. 48 18
The evidence presented here highlights the importance of a latent approach to
measuring human capital, as advocated by Folloni and Vittadini (2010). Moreover, the
new evidence calls for a policy shift towards cognitive skills, especially skills that
complement new technology. The case in favour of cognitive skills is strengthened by
the fact that only the cognitive skills measures, i.e., TIMSS and SKILLS, are most
consistent with the Benhabib and Spiegel (2005) model.36
The results reported here are also important for they provide both dynamic panel
and cross-section evidence of the important contribution human capital makes in local
innovation and in technology diffusion. Using cross-section data, Hanusheck and
Wößmann (2009, 2007) have already shown that there is a causal relationship between
the cognitive skills of young students (i.e., TIMSS test scores) and economic growth
in the world. The evidence here supports the view that cognitive skills can also
explain growth in technology and technology diffusion. The latter is particularly
crucial for it provides hope that less developed nations can benefit from new
technology. However, the empirical evidence clearly shows that schooling is not
enough. What is required is a mix of schooling, research capacity and IT tools that can
employ cognitive skills towards the expansion of human capital.
5.
Sensitivity Analysis
In this section, we examine the sensitivity of system GMM and cross-section OLS
regression results to the number of lagged instruments and to alternative production
technologies. First, we examine the robustness of the estimation results to a reduced
number of lagged instruments. Roodman (2009a) showed that results can be highly
sensitive to the number of instruments used and emphasised the importance of this.
Thus, we reduced the number of instruments to 2-3 lags for each explanatory variable.
It can be shown that both system GMM and cross-section OLS regression results are
almost identical to those reported in Table 3.37
Further, we tested the sensitivity of the empirical results to alternative production
functions given that the growing evidence in favour of production functions that
36
Of course, this is not ipso facto evidence that the cognitive skills measures are absolutely superior to the Barro and Lee (2010) measures of educational attainment. The latter may very well be important in different analyses or different growth models, as seems the case with the model considered by Barro and Lee (2010).
37
CSES Working Paper No. 48 19
account for capital-skill complementarities (CSC) and skill-biased-technical-change
(SBTC).38 Nelson and Phelps (1966) and Benhabib and Spiegel (1994, 2005) briefly
discussed the former but never abandoned Cobb Douglas technology.
We seek to test the robustness of the logistic diffusion model, equation (5), when
we allow for CES and translog production technologies. This is particularly important
in the light of Lopez-Pueyo, Barcenilla and Sanau (2008) who show that TFP growth
and the identification of knowledge spillovers are sensitive to the form of production
function assumed. Furthermore, we wish to examine whether the results in Table 3
stand when we account for CSC and SBTC, especially in view of the proposed idea of
a direct link between cognitive skills and human capital.
5.1 CES Production Technology: Calibration
First, we consider the CSC hypothesis. We adopt the two-level CES production
function of Duffy, Papageorgiou and Perez-Sebastian (2004) but allow technology
growth to be endogeneous, as proposed by Benhabib and Spiegel (2005). More
formally, we define the log of TFP, lnAt, as follows:
/
lnAt yt (1 / ) ln
a bK( t (1 b S) t (1 a N) tet (8)
Here, ytis again the log of per capital GDP, St is skilled labour, Nt is unskilled
labour, is the Allen intra-class elasticity-of-substitution parameter between K and S,
is Allen inter-class elasticity-of-substitution between K and N. We calibrate (8) based on evidence in Krusell et al. (2000); i.e., we set a=1/3, b=0.5, =-0.4 and =0.5.
Duffy, Papageorgiou, and Perez-Sebastian (2004) ponder about the definition of
skilled labour, S, and experiment with various measures. Here, we define S=s*POP
where s is equal to the share of the adult population who has completed secondary
education and POP stands for population.39 Columns (1)-(3) in Table 4 display the
system GMM estimates that are very similar to those observed in Table 3. Again, with
38
See papers by Krusell et al. (2000), Duffy, Papageorgiou, and Perez-Sebastian (2004), Caselli (2005), Papageorgiou and Chmeralova (2005), and Kneller and Stevens (2006).
39
CSES Working Paper No. 48 20
the exception of EDU, the coefficient estimates have the right sign but are statistically
significant only when the new human capital index, SKILLS, is employed. Also, the
size of the estimates and the gap between domestic innovation and technology
diffusion human capital effects are lower higher in absolute value than those in Table
3 when SKILLS is considered. Thus, it appears that human capital defined as a latent
index of cognitive skills also contributes to innovation and diffusion under CES
production with capital-skill complementary.
In contrast, the cross-section OLS regression coefficients estimates are not
statistically significant. These cross-section results cast doubt on the validity of the
model or the form of the production technology. Thus, we reserve judgment until we
consider a translog production function that allows both the CSC and SBTC
hypotheses to be nested.
- Table 4 about here -
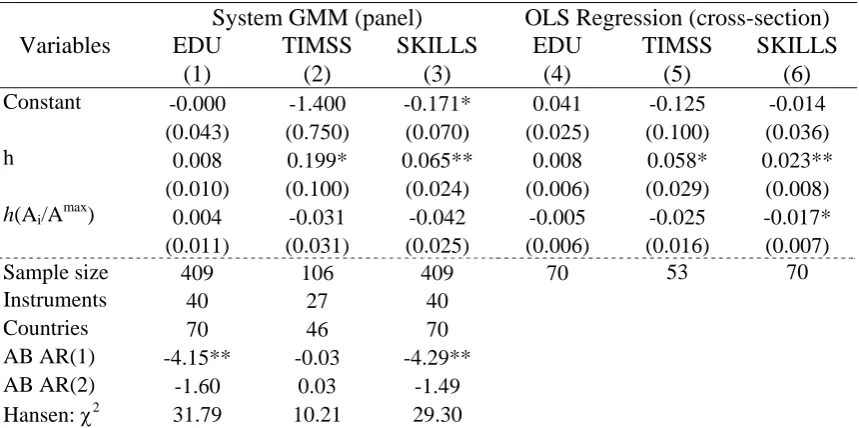
5.2 Translog Production Technology: Calibration
The translog production function is a more flexible functional form that allows us
to disentangle capital-skill complementary (CSC) effects from
skill-biased-technical-change (SBTC) effects. We adapt Papageorgiou and Chmeralova (2005) who take the
physical capital stock to be a quasi-fixed factor but we also draw on Young (1992)
and Mazumdar and Quispe-Agnoli (2004) to include technology in the translog
variable cost function:
0
2 2 2
2
ln ln ln ln ln ln ln
1
(ln ) ln ln (ln ) (ln )
2 1
ln ln (ln ) ln ln ln ln
2
i
j
j j
Y i i K A YK
YY i i j KK AA
i
ij i j AA Yi i AK
i
C Y W K A Y K
Y W W K A
W K A Y W A K
(9)
Wi is the price of variable production input i (where i = S, N), K is physical capital,
and Ai is technology. Using Shepard’s lemma, we obtain an expression for the share
CSES Working Paper No. 48 21
ln
ln ln ln ln
ln
S S Y S j j K A
j S
C
Y W K A
P
(10)
Assuming homogeneity of degree one in variable input prices (i.e., S + N =0) we have
ln( / ) ln( / ) ln( / ) ln
S
S
K K Y
S WS WN
Y Y L
A A (11)
Model (11) says that the share of skilled labour in the wage fund, S, is a function of the capital-output ratio, (K/Y), the relative price of skilled labour, (WS/WN), real
output per worker, (Y/L), and technology, A; all in logs. It nests the following
hypotheses: (a) complementarity (substitutability) between K and S: K>0 (K<0); (b) complementarity (substitutability) between S and N: S>0 (S<0); (c) homothetic production: Y=0; and (d) skill-biased technical change (SBTC) in favour (at the expense) of skilled labour: A>0 (A<0).
Following Young (1992) with constant returns to scale, lnA can be expressed as
lnAlnY
ln( )K (1
) S ln( )S (1 S) ln( )N (12)We construct a measure of lnA in the following steps: (a) we utilise estimates of
(WS/WN) in Papageorgiou and Chmeralova (2005, column five, Table A.1); (b) we
impute (WS/WN) for all countries,40 and (c) calculate S as in Papageorgiou and Chmeralova (2005, p.64).41 The latter facilitates a translog measure of lnA as in (12)
and the estimation of models (5) and (11). Once again, we define skilled labour, S, as
above: S=s*POP. We follow Papageorgiou and Chmeralova (2005) to involve ln(Y/L)
as a regressor in order to account for a non-homothetic production function. Columns
(1)-(3) in Table 5 summarise the system GMM coefficient estimates. Again, the
evidence is similar to that reported above where the SKILLS index is most consistent
40
The imputed measure of (WS/WN) was on the basis of simultaneous quantile regressions of the
Papageorgiou and Chmeralova (2005) estimates of (WS/WN) on secondary education (SECO), and
dummy variables for Sub-Saharan Africa, Eastern European transitional economies and South American nations.
41
CSES Working Paper No. 48 22
with the model, except that now the null hypothesis of technology diffusion is rejected
only at 10% significance level.
Furthermore, the cross-section OLS regression estimates in columns (4)-(6) are
now statistically significant for SKILLS and its coefficients seem to be of plausible
value and with the right signs. Again, the local innovation coefficient for TIMSS is
again extremely large when compared to the h(Ai/Amax) coefficient, as in Tables 3-4.
Overall, the magnitude of the coefficient estimates in Table 5 compare to those in
Table 3 rather than those in Table 4.42 The evidence indicates that the new latent
index of cognitive skills plays a significant role in innovation and technology
diffusion. However, only under a translog production technology the cross-section
evidence is consistent with the system GMM findings.
- Table 5 about here -
Finally, we utilise the new estimates of S, (K/Y) and (WS/WN) to test the validity of model (11), and the results appear in Table 6. In order to compare our results with
Papageorgiou and Chmeralova (2005), we employ simultaneous quantile regressions
(i.e., simultaneous estimation of the lowest and highest quartiles) to account for
nonlinearities and report results for the early 1980s, 1990s and 2000s. The results
indicate that the CSC hypothesis, once a unique feature of developed economies, has
become a global phenomenon since the early 1990s. Further, we find limited evidence
of skilled-unskilled labour complementarity. Further, the SBTC effect seems to have
increased since the 1990s. Finally, our findings suggest that the production function is
non-homothetic, as in Papageorgiou and Chmeralova (2005).
- Table 6 about here -
42
CSES Working Paper No. 48 23
Hence, the evidence in this section provides support for the CSC and SBTC
hypotheses and suggests that these effects, once exclusively developed-world effects,
have become global phenomena.43
6.
Conclusion
This paper develops a new index of human capital as a latent unobservable factor
of cognitive skills that are employed by the adult population. It also examines the
performance of this new index in a horse race against two alternative measures of
human capital in the logistic model of technology diffusion proposed by Benhabib
and Spiegel (2005). The robustness of the empirical results with respect to alternative
assumption is tested by sensitivity analysis. This includes reducing the set of
instrument variables in system GMM estimation and going beyond the Cobb-Douglas
production function to consider CES and translog production functions.
Overall, the evidence shows that the new cognitive skills index outperforms
existing measures of human capital. Moreover, it is the only measure that is consistent
with the logistic model of diffusion in dynamic panel data analysis. Thus, we
conclude that cognitive skills facilitate innovation and technology diffusion.
This new measure of human capital also reveals that long-term income disparities
persist in countries that pay little attention to cognitive skills. We find that the number
of countries that are susceptible to poverty traps is much larger than previously
thought. Many of these countries have remained stagnant and incapable of catching
up over a thirty-year period. Although Africa and advanced OECD economies have
invested heavily on education, they have witnessed a decline in cognitive skills in
recent times, in sharp contrast to Asian and South European nations who have
invested heavily in skills. The new evidence calls for a re-think of development policy
to pay more attention to the cognitive skills of the working population.
Finally, it would be insightful to extend the analysis in future reseach to other
growth models and test their performance using the new index of human capital. For,
example, it would be important to examine whether the new index of cognitive skills
proposed here can bridge the gap between assimilation and accumulation theories. Put
43
CSES Working Paper No. 48 24
differently, will the new human capital index assist towards a unified theory whereby
the quality of education remains the key driver of world economic growth?
Appendix: Variables Definitions and Sources.
Variable Definitions and Sources
Di,t Distance to the frontier in country i in period t, also expressed as (A/A
max
). A is TFP
and Amax is TFP in the leading country (USA) for the period.
EDU Average years of schooling of the total population aged 25 years and over.
Estimates for Ethiopia and Nigeria are based on Cohen and Soto (2007). Source:
Barro and Lee (2010), http://www.barrolee.com,and Cohen and Soto (2007).
EDU_CS Revised estimates of average years of schooling of the total population aged 25
years and over by Cohen and Soto (2007). Given that these estimates are 10-year periods, mid-decade estimates were linearly interpolated.
IQ IQ scores. Source: Lynn and Vanhanen (2002)
K Net physical capital stock. Following Benhabib and Spiegel (2005), the initial 1960
value of capital stock, K1960, is calculated as:
1960
1960
I
K Y
Y n
where I, , and n represent real investment (constant prices), growth in real GDP
per capita, depreciation rate of capital (fixed at 3%), and the rate of population growth respectively. The net capital stock for subsequent years is calculated as:
1 1960
1
(1 )t t (1 )t i
t i
i
K K I
Source: Penn World Tables (PWT 6.2).
POP Population. Source: PWT 6.2.
RITE The log of per million of people trade (i.e., sum of exports and imports) in IT
equipment ($US) relating to research activity. We use the NBER-UN world trade dataset. IT equipment consists of typewriters, word-processing machines,
calculating machines, photocopying apparatus, office machines, data processing machines and equipment, and storage units for data processing. In terms of SITC
Rev. 2 (4-digit) codes in Feenstra et al. (2005), we used classes 7511-7529. Note,
Botswana was merged with South Africa and 2000 imports estimates for India were missing. South Africa estimates (merged with Botswana) were re-distributed on the basis of manufactured trade as a share of merchandise trade. The 2000 figures for India were extrapolated on the basis of growth trends between 1997 and 1999. Eighty per cent of estimates for the former USSR were attributed to Russia and the 1991-92 trade shares were extrapolated backwards for the former Czechoslovakia
and distributed to Slovakia appropriately. Source: Feenstra et al. (2005) and WDI.
S Skilled labour set equal to exp(SECO)*POP/100. Sources: Barro and Lee (2010),
Cohen and Soto (2007) and PWT 6.2.
SciP The log of scientific journal article publications in sciences per million of people.
We added 0.1 to original data. Source: ISI Web of Knowledge.
SECO The log of the percentage of the total population aged 25 years and over who
completed secondary education. We added 0.01 to original data and estimates for
Ethiopia and Nigeria are based on Cohen and Soto (2007). Source: Barro and Lee
(2010) and Cohen and Soto (2007).
TIMSS The log of TIMSS (trends in international mathematics and science study): average
CSES Working Paper No. 48 25
period. For 1970 to 1995, we use averages of mathematics and science for students aged 13-14 years in Barro and Lee (2001) for the periods 1970-72; 1982-84; 1988; 1990-91 and spliced at 1995. TIMSS data for pupils aged 13-14 years old in maths and/or science are available for 16 countries in 1970-72, 18 countries in 1982-84, 7 in 1988, 18 in 1990-91, and 37 in 1993-98. We use the mean of the two test scores
and the latter estimates for the period 1995-99. Sources: Barro and Lee (2001) and
International Association for the Evaluation of Educational Achievement (IEA) 1995, 1999, and 2003.
Y Real GDP (constant prices: Chain series). Source: PWT 6.2.
References
Abowd, J. M., J. Haltiwanger, R. Jarmin, J. Lane, P. Lengermann, K. McCue, K. McKinney and K. Sandusky (2005). “The Relation Among Human Capital, Productivity and Market Value: Building up from Micro Evidence.” In Corrado, C., Haltiwanger, J. C. and Sichel, D. E. (eds.),
Measuring Capital in the New Economy, 153-204, Studies in Income and Wealth, 65, Cambridge: National Bureau of Economic Research (NBER).
Acemoglu, D., P. Aghion and F. Zilibotti (2006). “Distance to Frontier, Selection, and Economic Growth.” Journal of the European Economic Association, 4(1), 37-74.
Acharya, R. C. and W. Keller (2007). “Technology Transfer Through Imports.” NBER Working Paper 13086, Cambridge, MA: NBER.
Aghion, P. and L. Boustan, C. Hoxby and J. Vandenbussche (2009). “The Causal Impact of Education on Economic Growth: Evidence from U.S.”, Havard University, mimeo.
Aghion, P., P. Howitt and F. Murtin (2010). “The Relationship Between Health and Growth: When Lucas Meets Nelson-Phelps.” NEBR Working Paper 15813. Cambridge: NBER.
Aghion, P. and P. Howitt (1998). Endogenous Growth Theory. Cambridge, MA: MIT Press.
Alders, P. (2005). “Human Capital Growth and Destruction: The Effect of Fertility on Skill Obsolescence.” Economic Modelling, 22(3), 503-520.
Apergis, N., C. Economidou, and I. Fillipidis (2009). “Innovation, Technology Transfer and Labor Productivity Linkages: Evidence from a Panel of Manufacturing Industries.” Review of World Economics, 144(3), 491-508.
Arellano, M. and O. Bover (1995). “Another Look at the Instrumental Variable Estimation of Error-Components Models.” Journal of Econometrics, 68(1), 29-52.
Barro, R. J. (2002). “Education as a Determinant of Economic Growth.” In Lazear, E. P. (ed.),
Education in the Twenty-first Century, 9-24, Stanford: Hoover Institution Press.
Barro, R. and J. Lee (2010). “A New Data Set of Educational Attainment in the World: 1950-2010.” NBER Working Paper 15902, Cambridge: NBER.
Barro, R. and J. Lee (2001). “International Data on Educational Attainment: Updates and Implications.” Oxford Economic Papers, 53(3), 541-563.
Benhabib, J. and M. Spiegel (1994). “The Role of Human Capital in Economic Development: Evidence from Aggregate Cross-country Data.” Journal of Monetary Economics, 34(2), 143-174.
Benhabib, J. and M. Spiegel (2005). “Human Capital and Technology Diffusion.” In Aghion, P. and Durlauf, S. N. (eds.), Handbook of Economic Growth, 1A, 935-966, Handbooks in economics, 22, Amsterdam and San Diego: Elsevier, North-Holland.
Bils, M. and P. J. Klenow (2000). “Does Schooling Cause Growth?. American Economic Review,
90 (5), 1160-83.
Borghans, L. and H. Heijke (2005). “The Production and Use of Human Capital: Introduction.”
Education Economics, 13(2), 133–142.
Caselli, F. (2005). “Accounting for Cross-country Income Differences.” In Aghion, P. and Durlauf, S. N. (eds.), Handbook of Economic Growth, 1A, 679-741, Handbooks in economics, 22, Amsterdam and San Diego: Elsevier, North-Holland.
CSES Working Paper No. 48 26 Ciccone, A. and E. Papaioannou (2005). “Human Capital, the Structure of Production, and
Growth.” European Central Bank, Working Paper Series: 623.
Coe, D. T. and E. Helpman (1995). “International R&D Spillovers.” European Economic Review,
39(5), 859-887.
Cohen, D. and M. Soto (2007). “Growth and Human Capital: Good Data, Good Results.” Journal of Economic Growth, 12(1), 51-76.
Coulombe, S., J. Tremblay, and S. Marchand (2004). “Literacy Scores, Human Capital and Growth in Fourteen OECD Countries.” Human Resources and Skills Development Canada, Statistics Canada, Minister of Industry, Catalogue 89-552-MIE.
Dagum, C. and D. J. Slottje (2000). “A New Method to Estimate the Level and Distribution of Household Human Capital with Application.” Structural Change and Economic Dynamics, 11
(1-2), 67-94.
Destre, G., L. Levy-Garboua, and M. Sollogoub (2008). “Learning from Experience or Learning from Others? Inferring Informal Training from a Human Capital Earnings Function with Matched Employer-Employee Data.” The Journal of Socio-Economics, 37 (3), 919-38.
Dowrick, S. (2003). “Ideas and Education: Level or Growth effects?” NBER Working Paper 9709, Cambridge, MA: NBER.
Dowrick, S. and M.L. Rogers (2002). “Classical and Technological Convergence: Beyond the Solow-Swan Growth Model.” Oxford Economic Papers, 54 (3), 369-385.
Duffy, J., C. Papageorgiou, and F. Perez-Sebastian (2004). “Capital-Skill Complementarity? Evidence from a Panel of Countries.” Review of Economic and Statistics, 86 (1), 327-344. Durlauf, S. N., P. A. Johnson, and J. R. Temple (2005). “Growth Econometrics.” In Aghion, P. and
Durlauf, S. N. (eds.), Handbook of Economic Growth, 1A, 555-677, Handbooks in economics,
22, Amsterdam and San Diego: Elsevier, North-Holland.
Easterly, W. and R. Levine (2001). “It’s not Factor Accumulation: Stylized Facts and Growth Models.” The World Bank Economic Review 15 (2), 177-219.
Ehrlich, I. (2007). “The Mystery of Human Capital as Engine of Growth, or Why the US Became the Economic Superpower in the 20th Century.” NBER Working Paper 12868.
Falvey, R., N. Foster, and D. Greenaway (2007). “Relative Backwardness, Absorptive Capacity and Knowledge Spillovers.” Economics Letters, 97, 230–234.
Feenstra, R.C., R.E. Lipsey, H. Deng, A.C. Ma, and H. Mo (2005). “World Trade Flows: 1962-2000.” NBER Working Paper 11040, Cambridge, MA: NBER.
Folloni, G. and G. Vittadini (2010). “Human Capital Measurement: A Survey.” Journal of Economic Surveys, 24(2), 248-279.
Galor, O. (2005). “From Stagnation to Growth: Unified Growth Theory.” In Aghion, P. and Durlauf, S. N. (eds.), Handbook of Economic Growth, 1A, 935-966, Handbooks in economics,
22, Amsterdam and San Diego: Elsevier, North-Holland.
Galor, O. and D.N. Weil (2000). “Population, Technology and Growth: From Malthusian Stagnation to the Demographic Transition and Beyond.” The American Economic Review, 90 (4), 806-828.
Gault, F. (2005). “Measuring Knowledge and its Economic Effects: The Role of Official Statistics.” Advancing Knowledge and the Knowledge Economy Conference, National Academies of Science, Washington D. C.
Gorlich, D. and A. de Grip (2007). “Human Capital Depreciation During Family-related Career Interruptions in Male and Female Occupations.” Kiel Institute for the World Economy, Working Paper 1379.
Griliches, Z. (1981). “Market Value, R&D, and Patents.” Economic Letters, 7, 183-187.
Hanushek, E. A. and D. D. Kimko (2000). “Schooling, Labor-force Quality, and the Growth of Nations.” American Economic Review, 90 (5), 1184-1208.
Hanushek, E. and L. Wößmann (2009). “Do Better Schools Lead to More Growth? Cognitive Skills, Economic Outcomes, and Causation. NBER Working Paper 14633.
Hanushek, E. and L. Wößmann (2007). “The Role of School Improvement in Economic Development.” NBER Working Paper 12832.
CSES Working Paper No. 48 27 Hauk W.R. and R. Wacziarg (2009). “A Monte Carlo Study of Growth Regressions.” Journal of
Economic Growth, 14(2), 103-147.
Heckman, J., J. Stixrud, and S. Urzua (2006). “The Effects of Cognitive and Noncognitive Abilities on Labor Market Outcomes and Social Behaviour.” Journal of Labor Economics, 24
(3), 411-482.
Hulten, C. R. and A. Isaksson (2007). “Why Development Levels Differ: The Sources of Differential Economic Growth in a Panel of High and Low Income Countries.” NBER Working Paper 13469, Cambridge, MA: NBER.
Jones, G. (2008). “Cognitive Ability and Technology Diffusion: An Empirical Test.” American Economic Association Annual Meeting, January 2008.
Jones, G. and W. J. Schneider (2006). “Intelligence, Hapital, and Economic Growth: A Bayesian Averaging of Classical Estimates (BACE) Approach.” Journal of Economic Growth, 11 (1), 71-93.
Joss, R. L. (2001). “Management.” Australian Journal of Management, 26 (Special Issue), 89-103. Kneller, R., and P.A. Stevens (2006). “Frontier Technology and Absorptive Capacity: Evidence
from OECD Manufacturing Industries.” Oxford Bulletin of Economics and Statistics68 (1), 1-21.
Korpi, T. and M. Tahlin (2007). “Educational Mismatch, Wages and Wage Growth: Overeducation in Sweden, 1974-2000.” Swedish Institute for Social Research (SOFI), Stockholm University, Working Paper 10/2007.
Krueger, A. and M. Lindahl (2001). “Education for Growth: Why and for Whom?” Journal of Economic Literature, 39 (4 ), 1101-1136.
Krusell, P., L.E. Ohanian, J. Rìos-Rull, and G.L. Violante (2000). “Capital-Skill Complementarity and Inequality: A Macroeconomic Analysis.” Econometrica, 68 (5), 1029-1053.
Lane, P.W. (2002). “Generalized Linear Models in Soil Science.” European Journal of Soil Science,53(2), 241-251.
Lanzi, D. (2007). “Capabilities, Human Capital and Education.” The Journal of Socio-Economics,
36(3), 424-435.
Le, T., J. Gibson, and L. Oxley (2003). “Cost and Income-based Measures of Human Capital.”
Journal of Economic Surveys, 17 (3), 271-307.
Lévy-Garboua, L., N. Damoiselet, G. Lassibille, and L. Navarro-Gomez (2004). “An Economist’s View of Schooling Systems.” In Sofer, C. (ed.), Human Capital Over the Life Cycle, 53-68, London: Edward Elgar.
Lopez-Pueyo, C., S. Barcenilla, and J. Sanau (2008). “International R&D Spillovers and Manufacturing Productivity: A Panel Data Analysis.” Structural Change and Economic Dynamics, 19(2), 152-172.
Lucas, Robert E. Jr. (1988). “On the Mechanics of Economic Development.” Journal of Monetary Economics, 22(1), 3-42.
Lynn, R. and T. Vanhanen (2002). “IQ and the Wealth of Nations.” Westport, CT: Praeger Publishers.
Madsen, J. (2007). “Technology Spillover Through Trade and TFP Convergence: 135 Years of Evidence for the OECD Countries.” Journal of International Economics, 72(2), 464-480. Mazumdar, J. and M. Quispe-Agnoli (2004). “Can Capital-Skill Complementarity Explain the
Rising Skill Premium in Developing Countries? Evidence from Peru.” Working Paper 2004-11, Federal Reserve Bank of Atlanta.
Nelson, R. and E. Phelps (1966). “Investment in Humans, Technology Diffusion, and Economic Growth.” American Economic Review, Papers and Proceedings, 56 (2), 69-75.
Nelson, R. (2005). Technology, Institutions and Economic Growth. Cambridge, Mass.: Harvard University Press.
Nordman, C. J. and F. Wolff (2007). “On-the-job Learning and Earnings in Benin, Morocco and Senegal.” Institut de Recherche Pour le Developpement, Working Paper DT/2007-09.
OECD (1998). Human capital investment: An international comparison, OECD Centre for Educational Research and Innovation, Paris.
Papageorgiou, C. and V. Chmeralova (2005). “Nonlinearities in Capital-Skill Complementarity.”
Journal of Economic Growth, 10 (1), 59-89.