INTRODUCTION
Nickel is an essential element for many archea, bacteria and plants and may yet be found to play a role in the metabolism of higher organisms1-6. Ni(II) crosses cell membranes via calcium channel and probably competes with Ca2+ for specific intracellular receptors7-16. The transition metal complexes formed with amide ligands have attracted much interest over the past decade because of their important role in various industrial and biological processes. Copper and nickel amide complexes are used in enantioselective catalysis17-24 and metal ion therapeutics25-30. Studies of complexes with amide moieties are also of fundamental interest in order to understand the role of metalloproteins in the control of cell metabolism31-34. In most complexes , amino acids behave as bidentate ligands through NH2 and COO -ends35-37. This paper reports the interaction of Ni(NO3)2 with glycinamide (I=0.2molL-1 in NaClO
4) at various temperatures using Uv-Visible absorption technique. The binding constants were determined by analyzing optical absor ption spectra of
Study of Ni(II)-glycinamide complex formation by
spectrophotometric method at various
temperatures with pH=4.0 and I=0.2
NILOUFAR TAJDINI¹* and ALI MOGHIMI²
¹Department of Chemistry, Varamin(Pishva) Branch Islamic Azad University, Varamin, (Iran). ²Department of Chemistry, East Tehran(Ghiam Dasht) Branch Islamic Azad University, Tehran, (Iran).
*Corresponding author: [email protected] (Received: June 24, 2010; Accepted: July 21, 2010)
ABSTRACT
The formation constants of Ni(II)-glycinamide system were determined in buffer solution, pH=4.0 (I=0.2 mol L-1 in NaClO
4 at 10.0, 15.0, 20.0, 25.0, 30.0
oC) using UV-Visible spectrophotometric
method. The optical absorption spectra of Ni(II)-glycinamide system were analyzed in order to obtain formation constants and stoichiometries based on SQUAD software. Determining the formation constants at various temperatures enabled us to calculate some thermodynamic parameters as K, ∆Go, ∆Ho and ∆So related to the considered complexes.
Key words: Glycinamide, SQUAD, Optical absorption, Formation constants, Thermodynamic parameters.
complexes at various glycinamide concentrations using SQUAD software38. In par ticular, we deter mined the standard free energy (∆G0), enthalpy(∆H0)and entropy(∆S0)for the binding of mentioned complexes to glycinamide. Comparison of thermodynamic data leads us to understand the mechanism of interaction.
EXPERIMENTAL Materials
Ni(NO3)2,6H2O, nickel nitrate hexahydrate (Merck), HCl, hydrochloric acid (Merck), C8H5O4K, potassium hydrogen phthalate, (Merck), sodium perchlorate, NaClO4, (Merck), glycinamide hydrochloride, H2N-CH2-CONH2,HCl, (Fulka) were used without further purification In all experiments double –distillated water with special conductivity has been used equal to (1.3±0.1) µs cm-1. Apparatus
optical-pathway quartz cell with a thermostat controlling the cell compartment temperature by precision of ±0.1oC.
Methods
All experiments were carried out in double distillated water at pH=4.0 potassium hydrogen phthalate ,hydrochloric acid buffer and 0.2M NaClO4. In all experiments, the complex solutions were freshly prepared before spectral analysis. In typical experiment, 2ml of Ni(NO3)2 solution 0.03M in 0.2M NaClO4 (ionic strength) was titrated by glycinamide 0.24M solution.UV-Vis spectra of combinations were recorded in range of 200-800nm in 10 minutes after adding 50µl glycinamide solution.about 15 adds were taken place.about 50 wavelengths showing suitable variations by adding glycinamide solution were chosen and their absorbance rate was recorded.
RESULTS AND DISCUSSION
Absorption spectroscopy and SQUAD software analysis
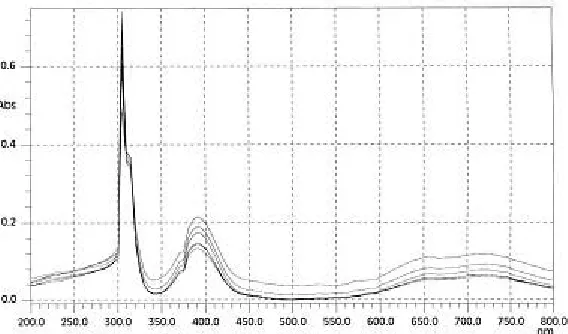
The figures (1-5) show typical titration spectras of Ni(NO3)2 upon increasing addition of glycinamide at 10.0, 15.0, 20.0, 25.0, 30.0oC. The obser ved spectral changes were used for determining the combining constants due to by using SQUAD program which was developed to empower the evaluation of the best combining constants due to absorbance measurements by using a non-linear least-square method39,40. The input data consist of (a) the absorbance values(b) the total glycinamide and Ni(NO3)2 concentrations. The Gauss-Newton non-linear least-squares algorithmis is used for making minimum total residual squares,calculating of eq.no.1.
...(1)
Where Ai,k is the absorbance value of ith solution at kth wavelength,give atotal of I solutions and a grand total of NW wavelength (in our experiments I=15 and NW=50).The output data are the logarithm of macroscopic binding constant (Ki,j) for formation of NiiGaj, where Ni is Ni(NO3)2 and Ga is glycinamide corresponds to the following
equilibrium.
...(3)
The values of U and percent of error represent uncertainty for logKij calculating of program. The absorption data were analyzed by assuming 1:1 or 2:1 and/or simultaneous 1:1 and 2:1 molar ratios of Ni(NO3)2 to glycinamide. Fitting of the experimental data (15 points), to the propsed stoichiometric models was evaluated by the sum of squares of the calculated points by the model.The results show that the most suitable case is corresponded to 1:1 and 2:1 combining models at range of studied temperatures with total residual squares ,and range of U was between 10-3 and 10-4. The combining constants are given in table (1, 2, 3). As it can be seen in this table, The combining constants are increased by increasing temperatures. It can be described as an increase of complex stability which results in higher values of combining constants. A prerequisite for a deeper insight in to the molecular basis of Ni(NO3)2-glycinamide interactions is thorough characterization of the energetic governing complex formation. The energetic of Ni(NO3)2-glycinamide equilibrium can be conveniently characterized by thermodynamic parameters such as standard Gibbs energy, ∆Go, standard molar enthalpy change, (∆Ho) and standard molar entropy change, ∆So. The standard Gibbs energy change is usually calculated due to equilibrium constant (K) of the reaction, by the following relationship
...(2)
Where R and T are the gas constant and the absolute temperature, respectively. Since the activity coefficients of the reactions are not known, the usual procedure is to assume them unity and to use the equilibrium concentrations instead of the activity.
Fig. 1: The titration absorption spectra of Ni(NO3)2 (0.03M) by Ga (0.24M) in NaClO4 0.2M at 283K
Fig. 2: The titration absorption spectra of Ni(NO3)2 (0.03M) by Ga (0.24M) in NaClO4 0.2M at 288K
Fig. 4: The titration absorption spectra of Ni(NO3)2 (0.03M) by Ga (0.24M) in NaClO4 0.2M at 298K
Fig. 5: The titration absorption spectra of Ni(NO3)2 (0.03M) by Ga (0.24M) in NaClO4 0.2M at 303K
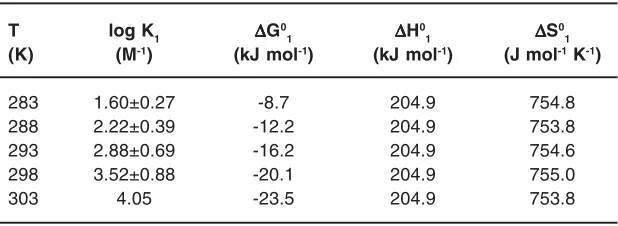
Table 1: Thermodynamic parameters and binding constants for binding of Ni(NO3)2 to Glycinamide
T log K1 ∆∆∆∆∆G0
1 ∆∆∆∆∆H 0
1 ∆∆∆∆∆S 0
1 (K) (M-1) (kJ mol-1) (kJ mol-1) (J mol-1 K-1)
283 1.60±0.27 -8.7 204.9 754.8
288 2.22±0.39 -12.2 204.9 753.8
293 2.88±0.69 -16.2 204.9 754.6
298 3.52±0.88 -20.1 204.9 755.0
303 4.05 -23.5 204.9 753.8
Table 2: Thermodynamic parameters and binding constants for binding of Ni(NO3)2 to Glycinamide
T log K2 ∆∆∆∆∆G0
2 ∆∆∆∆∆H 0
2 ∆∆∆∆∆S 0
2 (K) (M-1) (kJ mol-1) (kJ mol-1) (J mol-1 K-1)
283 1.78 -9.6 114.5 438.5
288 2.46 -13.6 114.5 444.8
293 3.00 -16.8 114.5 448.1
298 2.80 -16.0 114.5 437.9
303 3.34 -19.4 114.5 441.9
Table 3: Thermodynamic parameters and binding constants for binding of Ni(NO3)2 to Glycinamide T log βββββ ∆∆∆∆∆G0
1 ∆∆∆∆∆H 0
1 ∆∆∆∆∆S 0
1 (K) (M-1) (kJ mol-1) (kJ mol-1) (J mol-1 K-1)
283 3.38±0.5 -18.3 319.4 1193.3
288 4.68±0.41 -25.8 319.4 1198.6
293 5.87±0.2 -32.9 319.4 1202.4
298 6.32±0.46 -36.1 319.4 1193.0
303 7.39 -42.9 319.4 1195.7
..(4)
This is the so-called vant Hoff enthalpy. The apparent standard entropy change, ∆So’, can be derived from the Eq(5).
...(5) The vant Hoff plot for interaction of Ni(NO3)2 complexes with glycinamide are shown in
Fig. (6, 7) The calculated ther modynamic parameters for binding of Ni(NO3)2 to glycinamide are listed in table (1, 2, 3).
CONCLUSION
ACKNOWLEDGEMENTS
We are grateful to Islamic Azad University,
Varamin Pishva and Science and Research Campus, Islamic Azad University, for their financial support.
REFERENCES
1. R.P. Hausinger, in: Biochemistry of Nickel, Vol 12, Plenum Press, New York, 40 (1993). 2. M.A. Zoroddu, M. Peana, T.
Kowalik-Jankowska, J. Inorg. Biochem., 98: 931 (2004).
3. H. Sigel, R.B. Martin, Chem. Rev., 82: 385 (1982).
4. T.G. Appelton, Coord. Chem. Rev.,166: 313 (1997).
5. E.W. Tipping, H.A. Skinner, J. Chem. Soc. FaradayI., 68: 1764 (1972).
6. A.E. Martell, R.M. Smith, Critical Stability Constants, Vol 2, Plenum Press, New York, p.70(1977).
7. A.P. Brunetti, E.J. Burke, M.C. Lim, G.H. Nancollas, J. Soln. Chem1., 153 (1972). 8. H. Sigel, Angew. Chem., 14(6): 394 (1975). 9. K. Osz, B. Boka, K. Varnagy, Polyhedron.,
21: 2149 (2002).
10. P. Surdy, P. Rubini, N. Buzas, Inorg. Chem., 38: 346 (1999).
11. V.B. Ar ion, P.D. Beer, M.G.B. Drew, P. Hopkins, Polyhedron.,18: 451 (1999). 13. C. Conato, H. Kozlowski, P. Mlynarz,
Polyhedron., 21: 1469 (2002).
14. M.M. Ahmad Mohamed, M.M. Shoukry, Chem. Pharm. Bull., 49: 253 (3)(2001). 15. C. Sousa, P. Gameiro, C. Freire, Polyhedron.,
23: 1401 (2004).
16. J.S. Kim, M.H. Cho, J.H. Cho, J.H. Lee, Talanta., 51: 99 (2000).
17. D. Kong, J. Reinbenspies, J. Mao, Inorg. Chim., Acta 342: 158 (2003).
18. P. Kaczmarek, M. Jezowska-Bojczuk, W. Bal, J. Inorg. Biochem.,99: 737 (2005).
19. M. Asadi, E. Safaei, B. Ranjbar, J. Mol. Struct.,754: 116 (2005).
20. M. Asadi, A.K. Bordbar, E. Safaei, J. Mol. Struct., 705: 41 (2004).
21. C. Conato, S. Ferrari, H. Kozlowski, Polyhedron., 20: 615 (2001).
22. P. Arranz-Mascaros, R. Lopez-Garzon, M.D. Gutierrez-Valero, Inorg. Chim. Acta., 304: 137 (2000).
23. M. Gaber, A.M. Hassanein, A.A. Lotfalla, J. Mol. Struct.,875: 322 (2008).
24. Khlood S. Abu-Melha, Nashwa M. El-Metwally, Spectrochim. Acta A.,70: 277 (2008).
25. Y. Prashanthi, K. Kiranmai, N.J.P. Sabhashini, Shivaraj, Spectrochim. Acta A.,70: 30 (2008). 26. A.A. Shoukry, M.M. Shoukry, Spectrochim.
Acta A.,70: 686 (2008).
27. M.A. Zayed, F.A. Nour El-Dien, G.G. Mohamed, Spectrochim. ActaA., 64: 216 (2006).
28. M.W.A. Steenland, P. Westbroek, I. Dierck, Polyhedron., 18: 3417 (1999).
29. V. Cuculic, I. Pizeta, M. Branica, J. Electroanal. Chem., 583: 140 (2005).
30. B.B. Tewari, J. Chromatogr. A., 1103: 139 (2006).
31. K. Osz, K. Varnagy, H. Suli-Vargha, Inorg. Chim. Acta., 339: 373 (2002).
32. N. Tounsi, L. Dupont, A. Mohamadou, J. Inorg. Biochem., 99: 2423 (2005).
33. F.J. Barros-Garcia, A. Bernalte-Garcia, F.J. Higes Rolando, Polyhedron.,23: 1453 (2004). 34. S. Bandyopadhyay, A. Das, G.N. Mukherjee, A. Cantoni, Inorg. Chim, Acta., 357 (2004) 35. L. Ronconi, C. Marzano, U. Russo, J. Inorg.
Biochem., 91: 413 (2002).
36. C. Jubert, A. Mohamadou, C. Gerard, Inorg. Chem. Commun.,6: 900 (2003).
37. H. Sigel, A. Saha, N. Saha, P. Carloni, J. Inorg. Biochem.,78: 129 (2000).
38. L. Zekany, I. Nagypal, in:D.J. Leggett(Ed.), PESQUAD:A Comprehensive Program for Evaluation of Potentiometr ic and/or Spectrophotometric Equilibrium Data Using Analytical Derivatives, in Computational Methods, Plenum Press, New York, p.100(1991).
39. D.J. Leggett, W.A.E. McBr yde, Anal. Chem.,47: 1065 (1975).