https://doi.org/10.5194/nhess-17-1447-2017 © Author(s) 2017. This work is distributed under the Creative Commons Attribution 3.0 License.
Active fault databases: building a bridge between
earthquake geologists and seismic hazard
practitioners, the case of the QAFI v.3 database
Julián García-Mayordomo1,2, Raquel Martín-Banda1,2, Juan M. Insua-Arévalo2, José A. Álvarez-Gómez2, José J. Martínez-Díaz2, and João Cabral3
1Instituto Geológico y Minero de España, 28003 Madrid, Spain
2Department of Geodynamics, Geology Faculty, Complutense University, 28040 Madrid, Spain 3Department of Geology, Science Faculty, Lisboa University, 179-016 Lisbon, Portugal
Correspondence to:Julián García-Mayordomo ([email protected]) Received: 31 March 2017 – Discussion started: 18 April 2017
Revised: 7 July 2017 – Accepted: 14 July 2017 – Published: 30 August 2017
Abstract. Active fault databases are a very powerful and useful tool in seismic hazard assessment, particularly when singular faults are considered seismogenic sources. Active fault databases are also a very relevant source of informa-tion for earth scientists, earthquake engineers and even teach-ers or journalists. Hence, active fault databases should be updated and thoroughly reviewed on a regular basis in or-der to keep a standard quality and uniformed criteria. De-sirably, active fault databases should somehow indicate the quality of the geological data and, particularly, the reliability attributed to crucial fault-seismic parameters, such as max-imum magnitude and recurrence interval. In this paper we explain how we tackled these issues during the process of up-dating and reviewing the Quaternary Active Fault Database of Iberia (QAFI) to its current version 3. We devote partic-ular attention to describing the scheme devised for classify-ing the quality and representativeness of the geological ev-idence of Quaternary activity and the accuracy of the slip rate estimation in the database. Subsequently, we use this in-formation as input for a straightforward rating of the level of reliability of maximum magnitude and recurrence inter-val fault seismic parameters. We conclude that QAFI v.3 is a much better database than version 2 either for proper use in seismic hazard applications or as an informative source for non-specialized users. However, we already envision new improvements for a future update.
1 Introduction
Active fault databases are both an important managing tool for seismic hazard assessment as well as a convenient way of displaying and sharing scientific information of active faults. Knowledge about the location and activity degree of faults is crucial for seismic hazard and risk assessment, particularly for critical facilities such as nuclear power plants, radioac-tive waste storages and chemical plants, but also for plan-ning anthropic activities that may involve changing the nat-ural stress state in the crust: water reservoirs, underground gas storage, fracking, etc. The importance of active faults is a matter of concern in modern seismic code provisions, for example in Eurocode-8, in which official documents issued by competent national authorities are referred to for the iden-tification of such faults (e.g. Eurocode-8: Part 5; CEN, 2004). Active fault databases are also key for tsunami hazard assess-ments (e.g. Álvarez-Gómez et al., 2011) as well as for early warning systems, which are largely based on precomputed tsunamigenic faulting scenarios derived from information of such databases (e.g. Gailler et al., 2013).
seismo-genic source-zones models, for estimating maximum mag-nitude distributions in each source zone as well as assign-ing the predominant rupture mechanism required for ground motion prediction equations (GMPEs) (García-Mayordomo et al., 2012b; García-Mayordomo, 2015).
However, the seismogenic model did not explicitly con-sider QAFI faults to be seismogenic sources. The National Seismic Hazard Map Committee considered that the infor-mation available at that time (ca. 2011) was not complete enough to homogenously cover all the territory, and that it was affected by large uncertainties that prevented its use for producing an official standard for the country. Besides, a number of tests showed that the most active faults in QAFI (e.g. Eastern Betic Shear Zone) had a lower impact on hazard when modelled as sources than a regular seismogenic-zone for the targeted return periods of the map (475 and 950 year) (García-Mayordomo et al., 2012c).
Interestingly, Rivas (2013) analysed the effect of consid-ering QAFI faults as sources in depth for the same return periods and found that these faults were clearly controlling the spatial distribution and amplitude of hazard. The reason for this is found in the GMPE model used, which considered near-source effects (e.g. Campbell and Bozorgnia, 2013), re-markably increasing the hazard in the vicinity of the fault. Ri-vas (2013) also tested the application of a Brownian passage time renewal model for the Carboneras Fault, a major active fault belonging to the Eastern Betic Shear Zone. Following Rivas (2013) methodology, QAFI faults were modelled as sources to update the seismic hazard map of the region of Murcia (SE Spain), which was the basis for the design of the new civil protection plans for the region after theMw=5.2
Lorca 2011 earthquake (Benito et al., 2015).
Although QAFI is mostly used for seismic hazard calcu-lations, as explained above, the database has also become a primary source of information for both researchers and jour-nalists in the event of an earthquake in Spain. Reference to QAFI is increasing in the frame of engineering projects, a practice that is foreseen to be increased when the application of Eurocode-8 comes into force in Spain.
However, since QAFI v.2 was released it was known that the database presented important shortcomings for direct use in seismic hazard assessment (García-Mayordomo et al., 2012a, d). There was a strong urge to review and update the database in order to make it more complete, uniform and consistent, in such a way that it could provide guidance on the reliability of the seismic parameters of the faults, not just for seismic hazard practitioners but for non-specialist users as well. Fault-source characterization for hazard calculations demands the quality of the geological information on which seismic parameters are eventually derived to be somehow be rated.
This paper summarises the work carried out to update QAFI to v.3, aiming to improve completeness and homog-enizing criteria and consistency across the database. Partic-ular effort has been made to classify the quality of
geologi-cal data in order to provide an objective reliability rating of crucial fault-seismic parameters: maximum magnitude and recurrence interval. As a result, QAFI v.3 is a much better database than version 2, and more appropriate for use by seismic hazard analysts and earth scientists, and even by non-specialized users such as engineers, teachers or journalists.
2 Updating process to QAFI v.3 2.1 QAFI v.2 basic problems
It was well known since QAFI v.2 was released that the database had some problems of completeness and unifor-mity (García-Mayordomo et al., 2012a, d), even though at that time QAFI v.2 was the most informative source of ac-tive faulting in Iberia. On one hand, some important sources of information had not been analysed in detail (e.g. Neotec-tonic Map of Spain: IGME and ENRESA, 1998; other re-gional neotectonic maps: ITGE, 1991) and on the other hand, some records were not properly compiled or not all possi-ble data had been adequately compiled. That was the case for some crucial database fields such as the description of evidence of Quaternary activity, fault geometry parameters (maximum depth, dip) and slip rates. Additionally, the vari-ability range or error of important parameters (e.g. slip rate) was not quoted and indicated in many cases. Hence, it was clear that a thorough revision of existing but not yet com-piled data, as well as a revision of the original sources of information for already compiled data, was much needed.
Uniformity of criteria is of paramount importance in active fault databases, especially when these are open to general and not specialized users. The database fields’ maximum magni-tudes and recurrence intervals, which are crucial in seismic hazard applications, were not always calculated following the same criteria and methods in QAFI v.2. The estimation of the maximum magnitude was calculated using a variety of empirical relationships, which in some cases offered very different results, as was the case, for example, for Wells and Coppersmith (1994) compared to the pre-instrumental equa-tion of Stirling et al. (2002). Addiequa-tionally, the independent variable used in these equations was also different in many cases, for example the length of surface rupture compared to the rupture area. The consideration of equations derived from subsets considering the style of faulting compared to the overall dataset was also a common difference for a num-ber of records. In a similar way, the estimation of the recur-rence interval was approached in different ways, and when information on uncertainty was available, it was not always possible to discern with confidence how it had been calcu-lated.
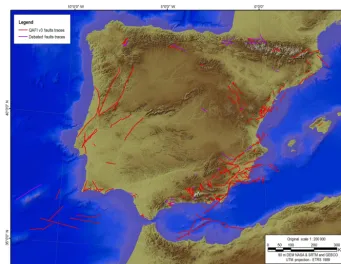
prob-Figure 1.Representation of the QAFI v.3 and Debated Faults databases. Users can query both databases online in http://info.igme.es/qafi/.
lem – elegantly called epistemic uncertainty – is to follow a logic tree procedure in which each of the branches represent different alternatives on which the analyst expresses his/her confidence by assigning particular weights. This procedure may become a difficult issue, particularly if the hazard an-alyst is not acquainted with the active tectonics of the terri-tory under study or simply because they are not specialized in earthquake geology. Hence, it was envisioned that an obvi-ous improvement in a future update of QAFI would consist of devising a system for classifying the reliability of fault seis-mic parameters, not just for hazard analysts but also for any other potential users (e.g. researchers, engineers, journalists, teachers, civil officers).
2.2 Revision and updating
QAFI v.3 was released in September 2015, after thorough revision, updating and adding of new data (Fig. 1). For a complete description of the fields that form the database the reader is referred to QAFI v.3 documentation and guide avail-able on the web (IGME, 2015). The new version contains 299 records, 30 % more than the old v.2. New records come fundamentally after reviewing the complementary material and reports that lead to the publication of the neotectonic maps of Spain (IGME and ENRESA, 1998) and Murcia Re-gion (ITGE, 1991). It is worth mentioning that only those faults that were clearly named and identified in the reports and the accompanying maps were considered for incorpo-ration into the database. Faults failing to meet these
crite-ria were not included as a record in the database, although their cartographic traces can be shown together with QAFI faults in the website. Additional sources of new information were thesis dissertations (e.g. Simón, 1984), the special is-sue on Active Tectonics in Iberia published in the Journal of Iberian Geology (Martínez-Diaz et al., 2012), the pro-ceedings of the Iberfault 2014 meeting (Álvarez-Gómez and Martín-González, 2014) and a number of papers published in earth science journals since 2012.
QAFI v.2 records were revised one by one, verifying the original sources of information referred to by the original compilers and, in many cases, contacting them to help the compiling process or just to get their approval on the up-date of the data compilation. We wanted to keep the same approach as used in QAFI v.2, that whenever possible the main compiler should coincide with a major author on the fault, even though it generally makes the compilation process slower. Particular attention was paid to the database fields scribing the evidence of Quaternary activity, age of last de-formation, geometry and kinematics, and slip rate.
A special effort was made to produce a best estimation of net slip rates (slip along displacement vector) and its uncer-tainty. In many cases, slip rates were not estimated in the original publications and had to be calculated ad hoc search-ing for valuable data included in them. This calculation was done transparently, clearly detailing the data and approach used in a memo field associated with the estimation called “brief comment”. In some cases there was not enough in-formation for such an estimation and so slip rates were esti-mated by expert judgement, usually by comparison to similar faults in the area. In spite of the effort, 22 % of the records still lack a slip rate estimation.
The variability/error field associated with slip rate in QAFI v.3 may show either the range of variation of the es-timation based on uncertainties in geological assumptions or some sort of statistical error based on the randomness of the measurements. An example of the former would be a slip rate determination based on assumptions of the age of a non-dated marker, which could lead to two extreme values; this is usually quoted as a range (e.g. 0.5–1.0 m kyr−1). For the latter, consider for example a variability estimation based on the standard deviation of radiometric dates given by a lab-oratory; this is usually quoted in QAFI v.3 as an error (e.g. ±0.08 m kyr−1).
Finally, the revision and updating process included veri-fying the cartographic traces of the faults against the orig-inal sources of information, georeferencing all them to the same date (ETRS89), and double-checking for a good match with associated landforms as observed in satellite imagery and DTMs. For those faults compiled from the Neotectonic Map of Spain project georeferencing had to be done by hand as the original source is made up of a composite of different paper sheets, none of them properly georeferenced.
2.3 Criteria homogenization
In particular we refer here to the method considered for cal-culating maximum magnitudes and associated recurrence in-tervals. If an active fault database is going to include these parameters, then it is important that they are calculated in a consistent, homogenous way, allowing direct comparison between records. It is up to the hazard analysts to eventu-ally either assume these values or consider different ones for their own purposes. However, for non-specialized users, such as engineers or journalists, it is important that these critical values are consistent and comparable across the database. In QAFI v.3 maximum magnitude and recurrence interval have been calculated consistently in the same way all through the database, except for the latter, for which a few records (#12) had conclusive palaeoseismic data while for #111 (37 %) the available data was simply not enough to draw an estimation. In the case that an estimation for any of these data was al-ready published, we kept and referenced it in the accompa-nying brief comment memo field.
Maximum magnitude is estimated in QAFI v.3 consider-ing the value quoted in the field “length” of the fault, and making use of Stirling et al. (2002) regression equation of moment magnitude on the surface rupture length derived from an updated instrumental dataset after Wells and Cop-persmith (1994). Length is a field that is always accounted for in every record of QAFI v.3 and one of the fields that can be more accurately estimated, compared to rupture area, for instance, for which uncertainties in the variation of dip with depth as well as the maximum brittle depth of the fault itself strongly affect the result. Hence, length was chosen as the independent variable for obtaining moment magnitude con-sidering an equation based on empirical data.
The choice of Stirling et al. (2002) took place along with several working meetings devoted to the intensity-to-moment magnitude conversion equation (I−Mw) in the
frame of the preparation of the Spanish National Hazard Map (IGN-UPM, 2013). In countries with a long historical earthquake record, such as Spain, this conversion is a cru-cial issue as it determines the maximum magnitude of the events in the catalogue. Desirably, these conversion equa-tions have to provide outputs consistent not just with dam-age descriptions in buildings but also with known environ-mental effects, such as those described in the Environmen-tal Seismic Intensity (ESI) scale (Michetti et al., 2007). For instance, in the ESI scale, surface-rupture earthquakes ap-pear from intensity VIII onwards, so it would not be rea-sonable that pre-instrumental events with lower intensities could be converted toMw>6.0. An additional issue is the
estimation of the upper bound of the Gutenberg–Richter dis-tribution when characterizing seismogenic sources. In seis-mic hazard assessment practice this is usually done based on the maximum event recorded in the zone (e.g. adding to it 0.5 magnitude units), and desirably it should be consistent with the maximumMwthat could be derived from the active
faults contained in the zone. Furthermore, for zones show-ing scarce seismicity, the estimation of maximumMwfrom
fault data may be the most reliable approach, if not the only one. Hence, a set of equations available at that time were tested against the outputs of theI−Mw conversion
equa-tion (see García-Mayordomo, 2015 and references therein), and the only two available data on fault ruptures and his-torical earthquakes in Spain (e.g. 1884 Arenas del Rey and 1829 Torrevieja earthquakes, related to Ventas de Zafarraya and Bajo Segura Faults, respectively). It was found that the outcomes of the Stirling et al. (2002) equation were the most consistent. Nevertheless, for the faults located in the Gulf of Cádiz, where thick oceanic crust occur, maximum magni-tudes may be much higher than predicted from that relation-ship. For these records the maximum magnitude brief com-ment memo field describes other alternatives and estimations cited in published literature.
the instrumental dataset. In those cases where uncertainty in length is significant, we use the brief comment memo field to explain and account for this issue in the magnitude estima-tion. For example, the Palomares fault (ES609), a 5–10 km wide N–S shear zone that forms part of the Eastern Betic Shear Zone, is ca. 60 km long, although to estimate maxi-mum magnitude in QAFI v.3 we used 10 km, which is the maximum length of single fault traces inside the shear zone. A hazard analyst may also consider plausible a multisegment rupture comprising 60 km and include this possibility as a branch in a logic tree scheme.
The recurrence interval in QAFI v.3 is estimated consid-ering the maximum magnitude earthquake model (MEM) (Wesnousky, 1986). This model assumes that each fault or fault segment releases a seismic moment in just one maxi-mum event that marks the end/beginning of a seismic cycle. The opposite model considers that the fault releases seismic moment by means of events of all sizes fitting an exponen-tial distribution – i.e. a Gutenberg–Richter relationship. An intermediate model is the characteristic earthquake model (Schwartz and Coppersmith, 1984), in which the fault pro-duces events of all sizes up to a certain maximum, above which the fault only produces maximum events (see Wes-nousky, 1994). QAFI v.3 considers the MEM model since it is a simple and straightforward method that can be invoked by only considering geological data obtained from the field.
In considering the MEM, slip rate (SR) represents the av-erage rate at which maximum earthquakes are released by the fault. Because these maximum earthquakes are all of a sim-ilar size, and so they were produced by a simsim-ilar coseismic displacement (D) on the fault plane, their average frequency (i.e. recurrence interval, RI) can be simply calculated as fol-lows:
RI= D SR.
However, the parameter displacement (D) of such a sin-gle maximum event is very difficult to specify, either from palaeoseismic studies or from empirical regressions on the length of the surface rupture, which so far show tremendous uncertainty. In QAFI v.3 we calculated recurrence intervals considering the ratio between the seismic moment released from a maximum event and the seismic moment rate defined by slip rate. Maximum seismic moment (M0) is calculated
from maximum moment magnitude (Mw) using the Hanks
and Kanamori (1979) equation:
Mw=
2
3logM010.7.
Seismic moment rate (M˙0) is obtained using Aki’s equation
(Aki, 1966), substituting average fault displacement (D) for slip rate:
˙
M0=A·SR·µ.
Recurrence interval (RI) is eventually calculated as follows: RI=M0
˙
M0 =10
1.5Mw+16.05
A·SR·µ .
This procedure means thatMwis not independently derived,
but empirically obtained from the length of the fault, which is a variable included twice when calculating rupture area in the seismic moment equation.
The recurrence interval field in QAFI v.3 accounts for a best estimation, which could result from considering either a preferred value of slip rate or an average slip rate. The vari-ability/error is given as a range, bounded by the maximum and minimum values that result from accounting for the stan-dard deviation of maximum magnitude and the variability of slip rate (either as a range or as a deviation). As mentioned before, for a few records (#12) the recurrence interval quoted in the database is the one originally published in journals, al-beit the brief comment field still accounts for the recurrence interval as calculated with MEM for comparative purposes.
Finally, in order to be as informative as possible for non-specialized users of the database, the brief comment field associated with recurrence interval includes a statement in-dicating that the recurrence interval of smaller but damaging earthquakes may be much shorter than that one for maximum events.
3 Assessing the quality of geological data and the reliability of seismic parameters
One of the most outstanding differences of QAFI v.3 from the previous version 2 is that the reliability of seismic parameters maximum magnitude and recurrence interval is classified ac-cording to the quality of the geological data on which they were derived. We believe this is very relevant progress con-sidering that the use of this database is increasingly widening not just among earthquake science researchers or hazard an-alysts, but government agencies, industry and even mass me-dia. There is an obvious need for any user to quickly grasp how reliable the data are for a particular fault of the database, and particularly sensitive are its maximum magnitude and recurrence interval. These two seismic parameters are funda-mental for modelling a fault as a seismogenic source in seis-mic hazard analysis and, additionally, they are interpreted by the general public as indicators of the potential hazardous-ness of a fault.
To account for the quality and representativeness of the ge-ological data in QAFI v.3, we have added two new database fields named “strength of the Quaternary evidence” and “ac-curacy of the estimation” of slip rate. The former serves to eventually rate the reliability of maximum magnitude and the latter to rate recurrence interval.
When evaluating the reliability of maximum magnitude we refer here to the possibility that the fault could actually produce maximum events – i.e. an event that ruptures the surface for a similar extent to its measured length. We are not evaluating the credibility of the actual value of the mag-nitude. QAFI v.3 rates the epistemic uncertainty of maximum magnitude, conversely to the aleatory uncertainty that results from the natural variability of the fault-rupture parameters or from the use of empirical equations. Hence, our reliability rating is based on whether there is evidence that the fault has produced such events that geologists are able to recognize to-day in the field. In QAFI v.3 this is evaluated in the “strength of the Quaternary evidence” database field.
Rating of recurrence interval reliability is based both on the reliability rating of maximum magnitude and slip rate “accuracy of the determination”. Slip rate is a key parame-ter in fault-source modelling, particularly in modelling earth-quake frequency. In QAFI v.3 we calculate recurrence inter-val assuming a MEM (Wesnousky, 1986), as explained in the precedent section, and so the size of the maximum event is as crucial as slip rate for estimating the average frequency between maximum earthquakes. Furthermore, slip rate and maximum magnitude are also both crucial in other fault be-haviour models, for example for determining the seismic ac-tivity rate of the fault in a Gutenberg–Richter-type model (e.g. Anderson and Luco, 1983; Youngs and Coppersmith, 1985). Hence, the reliability of the recurrence interval, or any other parameter related to fault-earthquake frequency, has to be considered jointly with the reliability of maximum mag-nitude (previously rated considering the strength of the evi-dence) and the accuracy of the slip determination.
We shall now show how we account in QAFI v.3 for the database fields strength of the evidence and accuracy of the slip rate determination, and subsequently explain the details of the procedure followed to rate the reliability of maximum magnitude and recurrence interval.
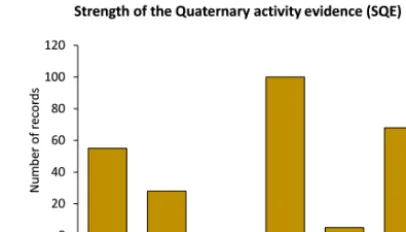
3.1 Strength of the Quaternary activity evidence (SQE) This database field evaluates the quality, significance and representativeness of the information provided in the original bibliographic references from which data in the fields named “geomorphic evidence” and “age of the youngest deposit af-fected by the fault” are compiled (see García-Mayordomo et al., 2012a, d). Please note that we are not rating the quality of published work. The quality of the work is taken for granted, as it is assumed that it reached at least the minimum stan-dards of the journal where the information was published at the time. What is evaluated here are the scale, methods, and
detail of the observations that support the Quaternary activ-ity evidence of the fault. This process was performed record by record once the compiling of new data was finished, and based on the experience gained after the revision of the entire database (see section on updating QAFI).
Strength of the Quaternary Evidence (SQE) is classified in three increasing levels of accumulated evidence: CSQE,
BSQE and ASQE. Differentiation among classes is based on
the scale of the observations and detail involved in obtaining the observations. Table 1 summarizes typical observations, scale and methods that usually characterize the available in-formation at each level of evidence. Note that the classes denote accumulated evidence and increasingly stronger evi-dence. It is convenient to highlight that we are not evaluating the degree of activity of the fault here, but the significance of the evidence of activity in Quaternary times.
Class CSQE encompasses the less significant evidence.
This is inferred from regional-scale observations of the fault trace, from interpretations of general geological maps or broad range geophysical methods to digital terrain mod-els (DTM) (Table 1). At this level, there is usually a lack of field work focused on demonstrating inferred evidence, or the detail of the field work has not proved conclusive so far. Geochronology is usually only known in broad relative terms as Quaternary or in terms of the different stages of the Quaternary Period (Upper Pleistocene, etc.). Similarly, Qua-ternary landforms or deposits are mapped in broad, generic units: terraces, alluvial fans, etc.). Numeric dating of certain deposits is usually lacking or they are very scarce.
Class BSQE assigns faults that, having class CSQE
evi-dence, also have additional observations from larger-scale works, and usually some field work. Quaternary geochronol-ogy is better constrained, although numeric dating of relevant stratigraphic units may still be lacking. The arrangement of Quaternary units is known more precisely and there is a dif-ferentiation of phases or stages inside generic landforms (e.g. differentiation between generations of alluvial fans or fluvial terraces) (Table 1).
Class ASQE faults are those that have class BSQE
(and CSQE) evidence, as well as conclusive observations
ob-tained from field work. In general, Level ASQE evidence
is gained after intensive work at the office (e.g. photo-interpretation, DTM analysis, . . . ) followed by field work fo-cused on confirming the evidence (e.g. trenching) (Table 1). Level ASQE observations indicate the activity of the fault as
a major controlling agent of Quaternary landforms or sedi-mentation, for example fault scarps offsetting Quaternary de-posits. Numeric geochronology may still be lacking, but the refinement reached on the definition of the geomorphic units allows a reliable approximation to their age based on their relative spatial associations.
Table 1.Classification of the strength of the Quaternary activity evidence (SQE) of a fault in three levels of increasing significance, based on the scale of the available observations, type of data and methods used. The classification is not intended to be exhaustive but to furnish the approach and criteria used in QAFI v.3. See text for further information.
Classification of the strength of the Quaternary activity evidence (SQE)
Class C∗– evidence inferred from the following
– Regional-scale geological maps (1/100 000 or smaller) – Terrain/drainage/geomorphic anomalies at broad scale
– Geophysical methods performed at broad scale (e.g. Bouguer anomaly, magnetic anomalies) – Interpretations from poor-quality multichannel seismic lines
Class B∗– additional evidence based on interpretations from the following – Detailed-scale geological maps (1/50 000 or larger)
– Geomorphic indexes indicating relatively recent activity (e.g. mountain front sinuosity, valley width to valley height ratio, stream length-gradient index)
– Drainage network anomalies (e.g. fault-aligned deflections, beheaded valleys, longitudinal profile anomalies, differential dissection, captures)
– Landforms anomalies (e.g. scarps, ponds, ridges, faceted spurs) – Geophysical methods performed at detailed scale
– Good-quality multichannel seismic lines
Class A∗– additional direct evidence from field data: – Fault scarp controlling Quaternary geomorphic landforms – Quaternary sedimentation processes controlled by tectonics
– Fault offsetting or folding Quaternary deposits at surface or subsurface – Interpretations from high-resolution geophysical methods
∗Note that a “+” sign is added to the class when evidence is reported at different locations along the fault trace (e.g. C+).
is consistently reported at different locations. However, this is a difficult issue to evaluate as the evidence of Quaternary activity of a fault may vary along its trace for very differ-ent reasons in addition to its activity degree. For example, it could be due to natural erosion/sedimentation processes, fre-quently in relation to anthropogenic activities, that may have blurred the evidence at some sections and thus biased avail-able studies relative to other parts of the fault.
Distribution of SQE in the QAFI v.3 database shows that the majority of the records belong to class B (39 %, #101), followed closely by classes A (32 %, #83) and C (28 %, #73) (Fig. 2). Note that this distribution does not account for 42 records that were not evaluated, all of them located in Por-tuguese territory. Interestingly, practically all the records that show a+sign in their SQE belong to class A. This situation may suggest that interpretations on the activity of a fault are often based on single location data; however reasonable that statement seems, we cannot reject that it may be an artifi-cial bias from the evaluation process, as the effort was more focused on level A records.
3.2 Accuracy of the slip rate estimation (ASR)
This database field rates an estimation of the net slip rate of a fault on the basis of the accuracy of the parameters involved in its calculation, particularly displacement and age. The slip rate estimation may come from original research published in a journal or may be produced ad hoc as part of the revision
Figure 2.Distribution of level classes of strength of the Quaternary activity evidence (SQE) in QAFI v.3 database. See text for further details.
and updating process performed in QAFI (see previous sec-tion) from data either published in original publications or estimated by expert judgment. Accuracy of the slip rate esti-mation (ASR) differentiates among three increasing levels of accuracy: CASR, BASRand AASR.
Class CASRcorresponds to a slip rate estimation based on
rates are broad approximations that usually lack direct ob-servations of the slip vector and dip of the fault, and it may be assumed from generic considerations on the general kine-matics of the fault (e.g. a rake of−90◦for a 60◦dip normal fault). Furthermore, in many cases slip rates are just assumed from comparison with similar faults in the region. The uncer-tainty of the estimation is very large and strongly depends on the broad controlling age considered.
Class BASRcorresponds to an estimation where one of the
basic parameters, displacement or age, is well constrained. Displacement of the marker may be measured from the in-terpretation of large-scale cartography after some field work and age may be controlled by numeric dating of the marker or by association with similar stratigraphic units dated in the area. The slip vector of the fault and/or its dip are also bet-ter constrained than in class CASR. A net slip rate is
usu-ally estimated in addition to the vertical/horizontal compo-nents. Uncertainties can still be very large, but the range of maximum and minimum values is better constrained than in class CASRestimations. Very often contrasting slip rate
val-ues are obtained when considering different hypothesis on the displacement and age of the marker.
Class AASRdescribes slip rate estimations for which both
displacement and age control are constrained by measure-ments at outcrop scale and age obtained from numeric dating methods or inferred from them. There is also a good knowl-edge on the true slip-vector and dip of the fault and, accord-ingly, net slip rate values are usually produced in the publi-cations. Uncertainties in the estimation still can be large, but conversely to classes CASRor BASR, these depend largely on
the accuracy of the dating results and their interpretation in relation to the true age of the marker. Uncertainties are usu-ally quoted as standard deviations or by similar statistical pa-rameters (e.g. mean error). Age and displacement are clearly stated in the original publication in such a way that any reader could calculate exactly the same values. Typically, there is a discussion on the variation of the slip rate of the fault along different periods of activity.
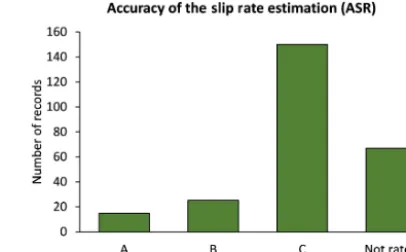
Most of the slip rates in QAFI v.3 have been rated as class CASR(58 %, #150), distantly followed by classes BASR
(10 %, #25) and AASR(6 %, #15) (Fig. 3). As in the previous
section, 42 records belonging to faults located in Portuguese territory were not included in this analysis. For a significant fraction of the dataset (26 %, #67) rating slip rate is not pos-sible simply because such an estimation is not available, not even in terms of “expert judgment”. The accuracy in the de-termination of slip rates has varied considerably in the last 10 years of active tectonics research in Spain. The younger the paper, the higher the effort in obtaining an accurate esti-mation of slip rate, reflecting clearly the increasing interest of Spanish geologists in seismic hazard practice.
Figure 3.Distribution of classes of accuracy of the slip rate estima-tion (ASR) in QAFI v.3 database. See text for further details.
3.3 Reliability of maximum magnitude (RMM)
The reliability level assigned to a maximum magnitude esti-mation for an active fault should be based on the quality and representativeness of the geological information from which the estimation was eventually obtained (see the introduction of the section). However, for hazard analysts who are not par-ticularly specialized in earthquake geology, this is not an ap-parent issue and sometimes neither is it for specialized ones, as analysing and evaluating geological data is usually com-plex and time consuming. Therefore, an objective indication of the reliability level of a maximum magnitude estimation should be a practical and desirable output in any active fault database.
We propose here that the reliability of maximum magni-tude should be determined based upon the SQE (Strength of the Quaternary activity Evidence) classes defined for QAFI v.3 (Fig. 4). As explained in the introduction of the section, here reliability is a concept linked to epistemic un-certainty (i.e. whether it is plausible that a particular fault could produce a maximum event) rather than to aleatory un-certainty, with regards to the value of the magnitude asso-ciated with such an event. Regardless, a reliable estimation of maximum magnitude should always be accompanied by a discussion on the sources of uncertainty and its impact on the expected value. Additionally, such a reliable estimation should be reached by a reader just considering the data and information provided in the paper. QAFI v.3 thus defines a new database field called “reliability of maximum mag-nitude” (RMM), which accounts for four levels of increas-ing reliability: DRMM, CRMM, BRMMand ARMM. These
lev-els are also named speculative, poorly reliable, reliable, and highly reliable.
A highly reliable level (AMM) is assigned only when the
SQE of the fault has been rated A+– i.e. the Quaternary ac-tivity of the fault is clearly evidenced and consistent along its trace. Hence, the occurrence of past earthquakes that rup-tured all the fault or segment trace is very plausible (Fig. 4). An AMM level is usually based on published information
Figure 4.Diagram summarizing the scheme followed in QAFI v.3 for rating the reliability of maximum magnitude (RMM) and recurrence interval (RRI) on the basis of the strength of the Quaternary activity evidence (SQE) and the accuracy of the slip rate estimation (ASR). First, the SQE of the fault is classified based on the detail of the available published observations in three increasing levels of accumulated evidence, varying from C (weak) to A (very strong). A plus sign (+) is assigned when the observations can be extrapolated with confidence all along the fault trace. Second, the ASR is classified based on the accuracy of the information used for its determination, varying from C (rough) to A (accurate). Third, RMM is obtained from SQE class, varying from A (highly reliable) to D (speculative). Fourth, RRI is obtained from both RMM and ASR. The resulting RRI would never be higher than the rated level for RMM, yet it could be lower depending on the ASR (these relationships are not shown on the diagram for the sake of simplicity). See text and Table 1 for a more extensive explanation.
slip rate variations, geometry variations or other related is-sues. Furthermore, the uncertainty in the maximum magni-tude estimation procedure is usually analysed in the publica-tion considering different sources such as variapublica-tion of rupture parameters (length, width, depth), variation of displacement per event at outcrop scale, variation from the use of different empirical equations according to type of faulting or tectonic environment and the nature of the crust. Eventually, the au-thors may prefer a particular maximum magnitude value to another, this choice always being clearly explained in the pa-per in such a way that a reader could calculate the same figure and its associated uncertainty.
A BRMMlevel (reliable) is assigned when the SQE of the
fault is either A or B+(Fig. 4). For these faults there is usu-ally a lack of palaeoseismic studies, but the geological infor-mation is good enough for analysing uncertainties from the variation of rupture parameters, as well as for the variation of style of faulting or tectonic regimen according to different scaling relationships. A general reader is usually able to cal-culate the same maximum magnitude MM value as proposed by the authors based on the data stated in the paper.
A CRMMlevel (poorly reliable) comes from a fault with an
SQE that is either B or C (Fig. 4). An additional lower level
called speculative (DRMM) is considered for rating maximum
magnitude estimations specifically derived from sources in which crucial data regarding to the calculation is missing and so it is impossible for a reader to reach a similar value with-out making speculative assumptions.
Approximately two-thirds of the records in QAFI v.3 database, excluding 42 records in Portugal, show a maximum magnitude estimation rated as poorly reliable (CRMM) or
speculative (DRMM) (41 and 26 %, respectively) (Fig. 5). The
other third are very reliable (ARMM) or just reliable (BRMM)
(21 and 11 %, respectively). This situation highlights the im-portance of being prudent when using these data and trying not to jump to conclusions, without first checking reliability.
3.4 Reliability of recurrence interval (RRI)
accu-Figure 5.Distribution of rating levels for the database field relia-bility of the maximum magnitude estimation (RMM) in QAFI v.3 database. See text for explanations.
racy of the slip rate determination (ASR) (Fig. 4). Similarly to RMM, an estimation of recurrence interval should always include an uncertainty analysis and its impact.
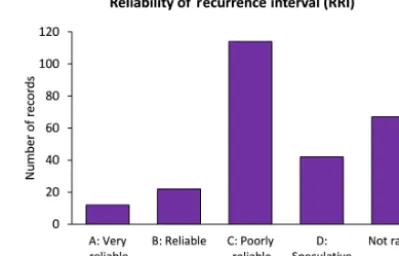
QAFI v.3 defines a database field called reliability of re-currence interval (RRI), which accounts for four levels of in-creasing reliability: DRRI, CRRI, BRRI and ARRI. Similarly
to RMM these levels are also named speculative, poorly re-liable, rere-liable, and highly reliable. Although QAFI v.3 has chosen to show recurrence interval calculated following the MEM (see introduction), the rating levels hereby defined for recurrence interval can be easily adapted to rate the reliabil-ity of earthquake frequency parameters in any other model of fault behaviour that relies on maximum seismic moment and seismic moment rate.
A highly reliable level (ARRI) is attributed only when both
RMM and ASR have the highest rating (Fig. 4). Published in-formation on a fault with a ARRIlevel usually thoroughly
dis-cuss uncertainties both from epistemic and aleatory sources. The former at least accounts for the possibility that maximum events happened clustered in time and for the consistency be-tween the size of maximum events derived from single-event displacements in the field and the maximum rupture dimen-sions of the fault. The source of aleatory uncertainty accounts for variations in the number of possible events in a time pe-riod, which also has an associated error in relation to the nu-meric dating results and their interpretation. The authors of the information may prefer a particular recurrence interval value to another, but this is always clearly stated in the paper so an external reviewer could reach the same value, similarly to what is explained in the preceding section for RMM. Un-certainty is usually quoted as a range (maximum to minimum possible values) or using a statistical parameter as standard deviation or mean average error.
Level BRRI(reliable) results from a record in which RMM
and ASR have been rated B and A or B, respectively (Fig. 4). An analysis of the aleatory sources of uncertainty is usu-ally included in the published information and the uncer-tainty is quoted either as a range or an error. A poorly
re-Figure 6.Distribution of rating levels for the database field reliabil-ity of recurrence interval (RRI) in QAFI v.3 database. See text for explanations.
liable level (CRRI) is assigned when RMM has been rated C
and ASR rated B or C (Fig. 4). This level rates the recur-rence interval estimation as highly interpretative. The infor-mation indicates tentative bounds for the range of variation of the parameter. Finally, an additional DRRIlevel (speculative)
is considered to rate recurrence interval estimations derived from information sources that lack sufficient data to pursue the procedure followed to reach the estimation and/or when any source of uncertainty is considered.
More than half of QAFI v.3 records show a recurrence interval estimation rated as poorly reliable or speculative (44 and 16 %, respectively) (Fig. 6). Estimations rated as reliable or highly reliable sum up 14 % of the total (9 and 5 %, respectively). A significant fraction (26 %) corresponds to records in which there was no available information on the slip rate and hence RRI could not be rated. Note that 42 records belonging to faults located in Portugal were not considered in the statistics. Estimations rated highly reli-able (#12) coincide with faults having specific palaeoseismic and active tectonic studies. Interestingly, these faults do not always coincide with the most active of the database but with the most studied.
4 Summary and discussion
Active fault databases are an important source of system-atized knowledge, not just for hazard analysts and earthquake science researchers, but also for engineers following seismic regulations, journalists looking for information for articles, and even for common citizens. In this context, active fault databases should be updated on a regular basis, show unifor-mity of criteria and somehow indicate the quality of the raw information and the reliability of seismic hazard parameters derived from it. By updating QAFI to version 3 we have tried to closely follow those assertions.
in February 2012. QAFI v.3 contains 299 records, which is 30 % more than v.2. All of them have been revised aimed at reaching a minimum quality and homogenous standard for the entire database. It was found that 40 records did not ac-tually show concluding evidence of Quaternary activity or were not yet published and so were excluded from QAFI v.3 and stored in a newly developed database named “Debated Faults”. This database can be downloaded from the QAFI web site (IGME, 2015) and displayed online together with QAFI faults.
The seismic parameters maximum magnitude and recur-rence interval have been calculated uniformly throughout QAFI v.3. For the former we used the length of the fault and Stirling et al. (2002) regression on Mw derived from
an updated instrumental dataset based on Wells and Copper-smith (1994). Our primary interest was to produceMw
esti-mations comparable from fault to fault across the database, using a well-controlled parameter (length) and an equation that have shown consistent outputs with the intensity-to-Mw
relationship used in the official seismic hazard map of Spain (IGN-UPM, 2013). We do not advocate for the use of ei-ther that parameter or that empirical equation for calculat-ing fault-related magnitudes in Iberia. The issue is left to be solved by a seismic hazard analyst, depending on the scope and scale of a particular project. For instance, we warn that for maximum magnitudes of the faults located in the thick oceanic crust of the Gulf of Cádiz an alternative approach should be considered. The recurrence interval is calculated, assuming the maximum magnitude earthquake model (Wes-nousky, 1986) from the ratio between maximum seismic mo-ment (from maximumMw) and seismic moment rate (from
slip rate). Similarly, we do not advocate that this model bet-ter fits the seismogenic behaviour of Iberian faults, but rather that it is a model completely based on geological data and convenient for comparing among faults across the database.
Although final decisions on the expected values and vari-ation of maximum magnitude or recurrence interval are up to the hazard analyst, QAFI v.3 presents a scheme for rating the reliability of these two crucial parameters in a straightfor-ward and objective way based on the quality and representa-tiveness of the available geological information. Reliability is graded in four levels: speculative (D), poorly reliable (C), reliable (B) and highly reliable (A) (Fig. 3). Reliability lev-els are assigned straightforwardly depending on the qualifi-cation obtained in two extra fields that evaluate the geologi-cal data: strength of the Quaternary activity evidence (SQE) and accuracy of the slip rate estimation (ASR). We believe that this scheme is very valuable for any potential user of the database. Hazard analysts can use it to support decision making when building logic trees or managing epistemic un-certainty in general. Furthermore, general users can use it to quickly check the quality of the available information, detect knowledge gaps and learn about to what extent results can be trusted.
Two important shortcomings in QAFI v.3 are the large number of records for which we have no estimation of slip rate (26 %), and the need to thoroughly review 42 (14 %) records belonging to faults located in Portugal. Regarding the former, part of the problem derives from our interest in keeping the v.2 concept in the sense that whenever possible the compiler is also the major author of the fault. This point sometimes leads to compilations that do not make the best use of the available data, depending on the willingness of the author and his/her support of the QAFI project. In other cases, it is because there is simply a lack of sufficient data. Nevertheless, a forthcoming version of the database should address this problem in such a way that every record shows a slip rate estimation, even though many of them will be esti-mated as expert judgment based on slip rates of similar faults in the vicinity or from geodetic data. Additionally, extra ef-fort has to be made to quote slip rate uncertainties, and doing it whenever possible following the same criteria and proce-dure across the database. Finally, the available information about Quaternary faults in Portugal has not yet been thor-oughly analysed. This would be addressed in a future QAFI version. Additionally, in the case of Spain it would be con-venient to explore sources of information older that the Neo-tectonic Map (IGME and ENRESA, 1998), taking advantage of the fact that all Spanish territory has been mapped geolog-ically at 1 : 50 000 scale (MAGNA National project: IGME, 2017).
5 Conclusion
QAFI v.3 is a much better source of information for seis-mic hazard analysts of active faults in Iberia than version 2. The new version is more complete, more uniform and con-sistent. Furthermore, QAFI v.3 serves as a baseline for man-aging epistemic uncertainty in fault hazard analysis. The re-liability of maximum magnitude and recurrence interval of faults is rated based on the quality and representativeness of the geological data from which these parameters are eventu-ally derived. However, it is warned that the QAFI database is a regional-scope project, and hence it should not substitute further geological studies in any way that may be appropri-ate to be carried out for site-specific hazard analysis or local-scale hazard mapping. QAFI database is updated roughly ev-ery 4 years and always after the celebration of the Iberian meetings on Active Faults and Palaeoseismology (e.g. IBER-FAULT, 2014).
Data availability. The QAFI database can be accessed and down-loaded at http://info.igme.es/qafi/ (IGME, 2015).
Competing interests. The authors declare that they have no conflict of interest.
Special issue statement. This article is part of the special issue “Linking faults to seismic hazard assessment in Europe”. It is not associated with a conference.
Acknowledgements. The development of QAFI v.3 has been funded by SISMOGEN project (GESTEC 2279), from Instituto Geológico y Minero de España (IGME), and Civil Protection of the Region of Murcia. The authors are indebted to all the compilers of the database and particularly to J. M. Azañón and A. Azor (Granada University), A. Salazar (IGME), I. Rojas (Alicante University) and a few anonymous researchers, who gave their informed opinions on the QAFI v.3 classification scheme when presented at IBERFAULT 2014. Ángel Prieto (IGME) is particu-larly acknowledged for his great work producing QAFI’s web page. The authors are very grateful for the comments and suggestions provided by N. Litchfield (GNS Science) and M. Cushing (IRNS) that led to an improved version of the manuscript.
Edited by: Bruno Pace
Reviewed by: Nicola Litchfield and Edward Marc Cushing
References
Aki, K.: Generation and propagation of G waves from the Niigata earthquake of June G 16, 1964. II. Estimation of earthquake movement, release energy, and stress-strain drop from waves spectrum, Bull. Earthq. Res. Inst., 44, 23–88, 1966.
Álvarez-Gómez, J. A. and Martín González, F. (Eds.): Una aprox-imación multidisciplinar al estudio de las fallas activas, los terremotos y el riesgo sísmico. Libro de resúmenes de la Segunda Reunión Ibérica sobre Fallas Activas y Paleosis-mología (IBERFAULT), Lorca (Murcia, España), 22–24 de Oc-tubre de 2014, 266 pp., available at: http://www.iberfault.org/ images/docs/Iberfault2014_web.pdf (last access: 1 March 2017), 2014.
Álvarez-Gómez, J. A., Aniel-Quiroga, Í., González, M., Olabar-rieta, M. and Carreño, E.: Scenarios for earthquake-generated tsunamis on a complex tectonic area of diffuse deformation and low velocity: The Alboran Sea, Western Mediterranean, Mar. Geol., 284, 55–73, 2011.
Anderson, J. G. and Luco, J. E.: Consequences of slip rate constants on earthquake recurrence relations, Bull. Seismol. Soc. Am., 73, 471–496, 1983.
Benito, B., Rivas, A., Pérez, M., Quirós, L. E., Barajas, S., Gaspar-Escribano, J. M., and Hernández, R.: Servicio de actualización del análisis de riesgo sísmico (Rismur) en la Región de Mur-cia, Universidad Politécnica de Madrid – Protección Civil de la Región de Murcia, unpublished document, 88 pp., 2015. Campbell, K. W. and Bozorgnia, Y.: NGA-West2
Campbell-Bozorgnia Ground Motion Model for the Horizontal Com-ponents of PGA, PGV, and 5 %-Damped Elastic Pseudo-Acceleration Response Spectra for Periods Ranging from 0.01 to 10 s, PEER 2013/06, Pacific Earthquake Engineering Research Center, Berkeley, California, USA, 2013.
CEN: Eurocode 8: Design of structures for earthquake resistance – Part 5: Foundations, retaining structures and geotechnical aspects (EN 1998-5:2004), 2004.
Gailler, A., Hébert, H., Loevenbruck, A., and Hernandez, B.: Simulation systems for tsunami wave propagation forecast-ing within the French tsunami warnforecast-ing center, Nat. Hazards Earth Syst. Sci., 13, 2465–2482, https://doi.org/10.5194/nhess-13-2465-2013, 2013.
García-Mayordomo, J.: Creación de un modelo de zonas sismogéni-cas para el cálculo del mapa de peligrosidad sísmica de España, Instituto edited by: Geológico y Minero de España, Madrid, 125 pp., available at: http://igmepublicaciones.blogspot.com.es/ 2014/10/riesgos-geologicosgeotecnia.html (last access: 1 March 2017), 2015.
García-Mayordomo, J., Insua-Arévalo, J. M., Martínez-Díaz, J. J., Jiménez-Díaz, A., Martín-Banda, R., Martín-Alfageme, S., Álvarez-Gómez, J. A., Rodríguez-Peces, M., Pérez-López, R., Rodríguez-Pascua, M. A., Masana, E., Perea, H., Martín-González, F., Giner-Robles, J., Nemser, E. S., Cabral, J., and the QAFI Compilers Working Group: The Quaternary Active Faults Database of Iberia (QAFI v.2.0), J. Iberian Geol., 38, 285–302, 2012a.
García-Mayordomo, J., Insua-Arévalo, J. M., Martínez-Díaz, J. J., Martín-Alfageme, S., Jiménez-Díaz, A., Martín-Banda, R., Rodríguez-Escudero, E., Rodríguez-Peces, M. J., Cabañas-Rodríguez, L., and Gaspar-Escribano, J. M.: Seismogenic fault-source characterization in SE Spain: Implications for probabilis-tic seismic hazard assessment, in: Proceedings of the XV World Conference on Earthquake Engineering, 24–28 September 2012, Lisbon, 2012c.
García-Mayordomo, J., Martín-Banda, R., Insua-Arévalo, J. M., Álvarez-Gómez, J. A., Cabañas, L., Cantavella, J. V., Crespo, M. J., Pereira Dias, R., Pascual, G., and Alfageme, S.: La base de datos de fallas activas cuaternarias de Iberia (QAFI v.2): car-acterísticas, aplicaciones y problemas, in: Proceedings of the VII Asamblea Hispano Portuguesa de Geodesia y Geofísica, 23– 28 June 2012, San Sebastián, Spain, 5 pp., 2012d.
Hanks, T. C. and Kanamori, H.: A moment magnitude scale, J. Geo-phys. Res., 84, 2348–2350, 1979.
IBERFAULT: Second Iberian Meeting on Active Faults and Paleo-seismology, available at: http://www.iberfault.org/index.php/en/ (last access: April 2017), 2014.
IGME: QAFI v.3: Quaternary Active Faults Database of Iberia, available at: http://info.igme.es/qafi (last access: 1 March 2017), 2015.
IGME: MAGNA 50 – Mapa Geológico de España a es-cala 1 : 50.000 (2nd Serie), available at: http://info.igme. es/cartografiadigital/geologica/Magna50.aspx, last access: 1 March 2017.
IGME and ENRESA: Mapas Neotectónico y Sismotectónico de Es-paña a escala 1 : 1.000.000, Vol. I, 237 pp. and Vol. II, 167 pp., available at: http://info.igme.es/qafi/Download.aspx/ (last ac-cess: 1 March 2017), 1998.
IGN-UPM: Actualización de Mapas de Peligrosidad Sísmica de Es-paña 2012, Centro Nacional de Información Geográfica, Madrid, 267 pp., 2013.
ITGE: Mapa Neotectónico, Sismotectónico y de Actividad de Fal-las de la Región de Murcia a escaFal-las 1 : 200.000 y 1 : 100.000, Memoria, 99 pp. and Annex V: Fichero de Fallas (Vol. I), 454 pp., available at: http://info.igme.es/qafi/Download.aspx/ (last ac-cess: 1 March 2017), 1991.
Martínez-Diaz, J. J., Masana, E., and Rodríguez-Pascua, M. A. (Eds.): Active Faults in Iberia, J. Iberian Geol., 38, 7–8, 2012. Michetti, A. M., Esposito, E., Guerrieri, L., Porfido, S., Serva, L., Tatevossian, R., Vittori, E., Audemard, F., Azuma, T., Clague, J., Comerci, V., Gurpinar, A., Mc Calpin, J., Mohammadioun, B., Morner, N. A., Ota, Y., and Roghozin, E.: Intensity Scale ESI 2007, in: Memorie Descrittive Carta Geologica d’Italia, 74, edited by: Guerrieri, L. and Vittori, E., Servizio Geologico d’Italia – Dipartimento Difesa del Suolo, APAT, Roma, 53 pp., 2007.
Rivas, A.: Contribución metodológica para incorporar fallas acti-vas en la modelización de la fuente dirigida a estimaciones de peligrosidad sísmica. Aplicación al sur de España, PhD thesis, Universidad Politécnica de Madrid, Madrid, 235 pp., 2013. Schwartz, D. P. and Coppersmith, K. J.: Fault behavior and
char-acteristic earthquakes: examples from the Wasatch and San An-dreas Fault Zones, J. Geophys. Res., 89, 5681–5698, 1984. Simón, J. L.: Compresión y distensión alpinas en la Cadena Ibérica
Oriental, PhD thesis, Instituto de Estudios Turolenses, Teruel, 269 pp., 1984.
Stirling, M., Rhoades, D., and Berryman, K.: Comparison of earth-quake scaling relations derived from data of the instrumental and preinstrumental era, Bull. Seismol. Soc. Am., 92, 812–830, 2002. Wells, D. L. and Coppersmith, K. J.: New empirical relationships among magnitude, rupture length, rupture width, rupture area, and surface displacement, Bull. Seismol. Soc. Am., 84, 974– 1002, 1994.
Wesnousky, S. G.: Earthquakes, Quaternary faults, and seismic haz-ard in California, J. Geophys. Res., 91, 12587–12631, 1986. Wesnousky, S. G.: The Gutenberg–Richter or the characteristic
earthquake model, which is it?, Bull. Seismol. Soc. Am., 84, 1940–1959, 1994.