INTERNATIONAL JOURNAL OF SCIENTIFIC & TECHNOLOGY RESEARCH VOLUME 9, ISSUE 03, MARCH 2020 ISSN 2277-8616
5579
Selection of the most suitable Radiation-based
ET method for Burdwan
Faruk Bin Poyen, Dr. Apurba Ghosh, Dr. Palash KunduAbstract— For an efficient design scheme of water budget planning, irrigation scheduling, developing an efficacious hydrological cycle, it is pertinent to determine the evapotranspirational behaviour of any geographical area. Once we are able to correctly deter mine the water loss, it is easieer for the agriculturist and environmental engineer to compensate for the same and/or to supply required amount of water so that optimal agricultural requirements can be met. It also prevents loss of water in forms of excess run-off and inundation. However, there is till date no concrete procedure to evaluate the loss of water as several parameters are involved in this process. Penman Monteith equation is one of the most widely acceptable method. Other than this method, there are temperature based methods, radiation based methods and mass – trasfer methods which again have plethora of equation under them. The choice of picking up the most suitable formula is largely based on the geographical and ecological nature of any particular place. While comparing temperautre based methods for determining the evapotranspiration for Burdwan area, West Bengal, India, it is found that Kharrufa method gives the most accurate results when compared with field data. In this article, the most accepted radiation methods has been taken up and compared with Penman Monteith equation and field data to figure out the most suitable radiation based method. It is found after compar ison that Hargreaves method provides the most accurate results in congruence with the field data. Detailed stepwise description of this comparison is provided in subsequent sections.
Index Terms— Evapotranspiration, Radiation-based method, Burdwan, Penman Monteith mehod, Hargreaves, Turc, Kharrufa. —————————— ——————————
1 INTRODUCTION
Evapotranspiration (ET) Evapotranspiration (ET) is the means of loss of water as evaporation and transpiration from the surface of the earth. It is a very vital parameter while designing and planning the water budget schemes, irrigation scheduling and water balance planning. A well-defined water budget prevents wastage of fresh water during the process of irrigation. Also it is capable of providing the optimum conditions for agriculture and farming by maintaining thedesirable moisture conditions for the farm lands.
Evapotranspiration depends on a large number of
environmental parameters like air temperature, relative humidity, atmospheric pressure, wind speed, geographical location, altitude, solar radiation et cetera. Based on these parameters, several scientists have formulated several equations which can be categorized into combined method, radiation-based methods, temperature-based methods and mass- transfer methods. All of these equations are acceptable within certain geographical conditions but out of these, the Penman Monteith (PM) equation which comes under combined method is most acceptable. However, the accuracy percentage is not very satisfactory. The best choice of method hugely depends on the geographical and ecological nature of any particular location. For instance, in determination of the evapotranspiration behavior of Burdwan area in West Bengal, India, from among the temperature based methods, Kharrufa method is the most suitable [1] showing higher accuracy and precision than Penman Monteith equation. The factor for consideration is recalibration of constants subject to a particular location to obtain the best fit values. Reference
Evapotranspiration is defined as the rate of removal of available water from plant and soil surfaces for a specific crop type designated as Reference crop (Doorenbos and Pruitt, 1975, 1977; Wright, 1982; Burman et al., 1990; and Burman et al. 1983) (Jensen et al., 1990) [1].
2 VARIOUS EVAPOTRANSPIRATION MODELS
The generalized expression for the determination of evapotranspiration is as shown in (1).
𝐸𝑇 = 𝐼 + 𝑃 + 𝐶𝑅 − 𝐷𝑃 − 𝑅𝑂 ± 𝐷𝑆𝐹 ± 𝐷𝑆𝑊 (1)
I=Irrigation; P=Rainfall; CR=Capillary Rise; DP=Deep
Percolation; RO=Run Off; DSF=Root zone Subsurface in-flow (nominal); DSW=Root zone Subsurface out-flow (nominal).
2.1 Penman-Monteith Equation
Penman-Monteith (PM) method (combination method) is a very popular and highly accepted method for ET evaluation but it is subject to geographical positioning. After getting modified in the EWRI-ASCE, it is now termed as PM FAO 56 method. This method has a hypothetical surface of reference having a crop height of 0.12 m, a surface resistance of 70 s/m with an albedo value of 0.23 inches (Allen et al. 1998) [2]. The reference surface is extensively covered with green grass, maintaining a uniform contour, actively growth with sufficient water and fully shading the ground. [3],[4].
The PM FAO-56 method is represented analytically as (2).
𝐸𝑇 = (
)
(2)
Considering 𝐶 at 0.34, we get,
𝐸𝑇 = (
)
(3)
The symbol nomenclatures are provided in Table II.
In PM FAO-56 method, evapotranspiration practically is subject to four parameters viz. air temperature wind speed, relative humidity and solar radiation. [4]
————————————————
Faruk Bin Poyen is currently serving in the capacity of Assistant
Professor in the dept. of AEIE at UIT, Burdwan University, INDIA, PH
8697511868, E-mail: [email protected]
Dr. Apurba Ghosh is currently serving as Associate Professor in the dept. of AEIE at UIT, Burdwan University, INDIA. E-mail:
Dr. Palash Kundu is currently serving as Associate Professor in the
Electrical Engineering dept. at Jadavpur University, INDIA, E-mail:
[email protected] gram in electric power engineering in University, Country, PH-01123456789. E-mail: [email protected]
INTERNATIONAL JOURNAL OF SCIENTIFIC & TECHNOLOGY RESEARCH VOLUME 9, ISSUE 03, MARCH 2020 ISSN 2277-8616
2.2 Radiation Based Methods
Among the three principle type of methods, radiation based method is considered to be a significant method for determination of Evapotranspiration. These group of equations are based on energy-balance methods primarily based on solar radiation and the general expression for them is given as [5].
𝜆𝐸𝑇 = 𝐶 𝜔𝑅 𝑜𝑟 𝜆𝐸𝑇 = 𝐶 𝜔𝑅 (4)
λ is the latent heat of vaporization (calories/gram), and ET as the potential evapotranspiration, 𝑅 is the total solar radiation,
𝑅 is the net solar radiation, ω is the temperature and altitude dependent weighing factor, 𝐶 is the coefficient depending on the relative humidity and wind speed.
There exists several methods under the radiation based method but the most popular and most commonly methods used are Makkink method (1957), Turc method (1961), Jensen & Haise method (1963), McGuiness & Bordne method (1972), Priestley & Taylor method (1972), Hargreaves method (1975), Doorenbos & Pruitt method (1977) and Abtew method (1996) [5].
2.2.1 Makkink Method
In 1957, Makkink proposed this radiation based method for estimation of evapotranspiration from grass and expressed the equation as in (5).
𝐸𝑇 = 0 61
− 0 12 (5)
The equation was little modified in 1984 based on further investigation and was formulated as shown in (6).
𝐸𝑇 = 0 7
(6)
= 33 8639 0 05904 0 00738𝑇 + 0 8072 − 0 000342 =
𝜆 = 595 − 0 51𝑇𝑃 = 1013 − 0 1055𝐸𝐿
𝐸𝐿 = 𝑒 𝑒 𝑖𝑜 𝑖
𝑅 = total solar radiation; Δ = slope of saturation vapour pressure curve; γ = psychrometric constant; λ = latent heat.
2.2.2 Turc Method
Considering the general climatic conditions of western Europe, Turc in 1961 formulated the Evapotranspiration model measured in millimeters per day for a period of 10 days as shown in (7) and (8)
𝐸𝑇 = 0 013
𝑅 + 50 𝑓𝑜𝑟 𝑅𝐻 50 (7)
𝐸𝑇 = 0 013
𝑅 + 50 (1 +
) 𝑓𝑜𝑟 𝑅𝐻 50 (8)
It is seen from the equation that the Turc method is also dependent of temperature as well as relative humidity.
2.2.3 Jensen & Haise Method
Jensen and Haise collected more than 3000 observations over a period of 35 years and formulated the generalized equation for determining Evapotranspiration (ET) is expressed in (9).
𝜆𝐸𝑇 = 𝐶 𝑇 − 𝑇 𝑅 (9)
This equation was further modified to be expressed as in (10)
𝐸𝑇 = 0 0252𝑇 + 0 078 𝑅 (10)
2.2.4 McGuiness & Bordne Method
In 1972, a method was proposed by McGuiness and Bordne for the calculation of potential evapotranspiration that was based on Lysimeter data in Florida, USA. The equation for determination is expressed as in (11)
𝐸𝑇 = { 0 0082𝑇 − 0 19 𝑅 ⁄1500 }2 54 (11)
2.2.5 Priestley & Taylor Method
In 1972, a simpler equation was proposed by these dual scientists for surfaces generally wet and humid and energy component was multiplied whereas aerodynamic component was deleted. The equation holds the expression as in (12)
𝐸𝑇 = 𝛼
(12)
Due to data shortage, Rn is estimated using an equation proposed by Linsley et al. (1982)
𝑅 = 7 14 10 𝑅 + 5 26 10 𝑅 𝑇 + 17 8 − 3 94 10 𝑅 − 2 39 10 𝑅 𝑇 − 7 2 − 1 02
2.2.6 Hargreaves Method
Hargreaves proposed this model in 1975 which depends on the daily average temperature and net solar radiation and it is expressed as provided below as in (13)
𝐸𝑇 = 0 0135𝑅 𝑇 + 17 8 (13)
2.2.7 Doorenbos & Pruitt Method
In 1977, Doorenbos and Pruitt presented a method based on radiation data which is an adapted version of Makkink method. This method is sometimes recommended as better as Penman method and it is expressed as in (14)
𝐸𝑇 = (
𝑅) + 𝑏 𝑏 = −0 3
(14)
INTERNATIONAL JOURNAL OF SCIENTIFIC & TECHNOLOGY RESEARCH VOLUME 9, ISSUE 03, MARCH 2020 ISSN 2277-8616
5581
a = adjustment factor;
2.2.8 Abtew Method
Abtew method is a simple method and advantageous over other methods as it is only dependent of solar radiation. The expression for determining evapotranspiration by this method is shown as in (15)
𝐸𝑇 = 𝐾 (15)
2.3
GENERALIZATION OF THE
RADIATION
BASED
METHODS
All the above mentioned eight methods which are primarily based on solar radiation can be generalized into principally into five forms as the methods of data collection is varied and inconsistent. The five generalized forms are expressed as below [4]
A. 𝐸𝑇 = 𝑏 𝑒 𝑀𝑒 𝑜𝑑 1996 B. 𝐸𝑇 = 𝑇 + 𝑏 𝐻 𝑟𝑔𝑟𝑒 𝑒 1975
𝐽𝑒 𝑒 & 𝐻 𝑖 𝑒 1963 𝑀𝑐𝐺𝑢𝑖 𝑒 & 𝐵𝑜𝑟𝑑 𝑒 1972 C. 𝐸𝑇 =
+ 𝑏
𝑀 𝑘𝑘𝑖 𝑘 1957 𝐷𝑜𝑜𝑟𝑒 𝑏𝑜 & 𝑃𝑟𝑢𝑖 1977
D. 𝐸𝑇 =
+ 𝑏 𝑃𝑟𝑖𝑒 𝑒 & 𝑇 𝑜𝑟 1972
E. 𝐸𝑇 = (
) 𝑅 + 50 𝑓𝑜𝑟 𝑅𝐻 50 𝑇𝑢𝑟𝑐 1961
𝐸𝑇 = 0 013 𝑇
𝑇 + 15 𝑅 + 50 (1 +
50 − 𝑅𝐻
70 ) 𝑓𝑜𝑟 𝑅𝐻 50
3 STUDY AREA
The data recording, monitoring and evaluation were carried out in Bardhaman municipal locality, of Purba Bardhaman district, West Bengal, India. This is a catchment area and the major township of the district.
Geographical coordinates: 23.2557 87.8569. State: West Bengal, India
Category: Agricultural Sub – urban.
Geonames - ID: 1277029; Time Zone: Asia/Kolkata; Total area under monitoring: 59 km²
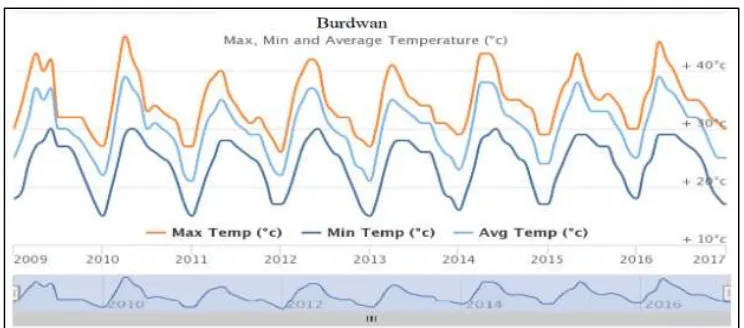
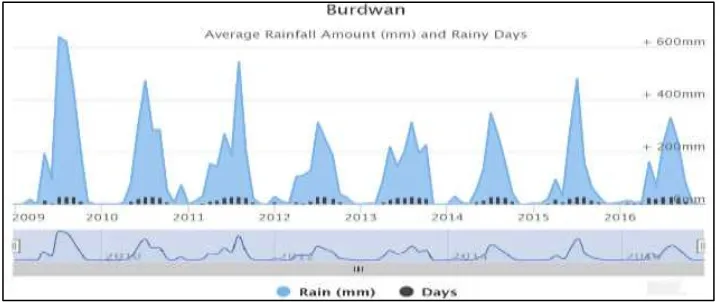
The Climate is tropical in nature with annual average temperature being 26.3 °C, elevation is 36 m. The median variation between the hottest and coldest of temperature annually is 11.5 °C and the precipitation difference between the driest and wettest weathers is 307 mm. The coolest month is January (average temperature 19.4 °C) and the warmest in April (average temperature 30.9 °C). The climatic classification as par Köppen-Geiger is Tropical, Savanna wet. Annual mean rainfall received is 1313 mm with maximum down-pour between July and October.
The population is semi-urban semi-rural.
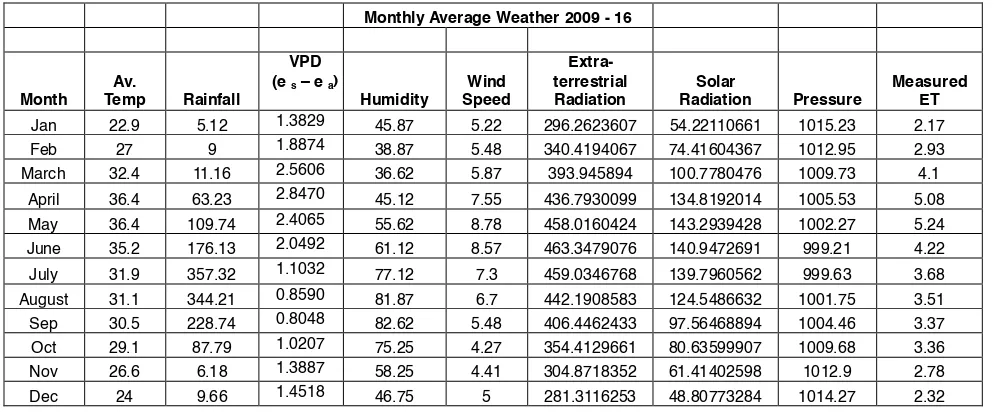
The area is selected as it primarily depends on agriculture, partly depending on rainfall and partly of irrigation. It is the major producer of Paddy, the staple food of eastern India. The geographical placement and climatic parameter variance over the seasons are cited in figures 1-7 and data are
tabulated in Table 1.
4 RESULTS AND DISCUSSION
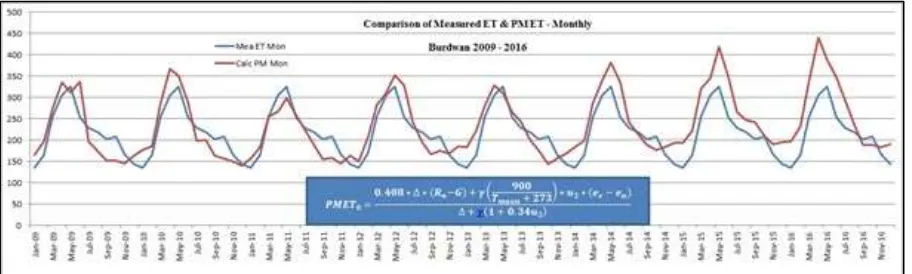
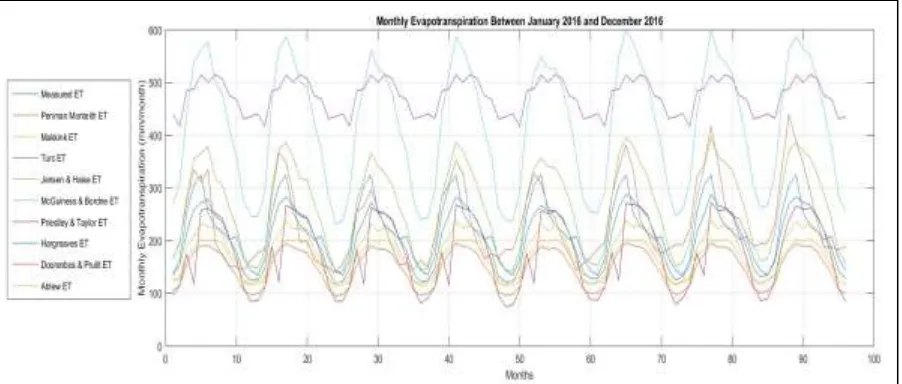
Based on the weather data between January 2009 and December 2016, the eight radiation-based ET methods are evaluated, keeping the original constant values. The parameters on which PM FAO-56 is dependent are tabulated in Table 2. Table 3 summarizes on which methods are dependent on what meteorological parameters. From Table 3, it is evident that all radiation based methods are also largely dependent on the air temperature. The statistical parameters that are picked to compare the results are mean, variance, standard deviation (SD), Mean Squared Error (MSE), Mean Absolute Deviation (MAD), Mean Squared Error (MSE), Mean Absolute Percentage Error (MAPE), Root Mean Squared Error (RMSE), Mean Absolute Error (MAE), , degree of agreement (d), R-squared, Adjusted R-Squared, Sum of Squared Error of Prediction (SSE). All the eight methods along with the Penman Monteith method is compared with the actual measured value of Evapotranspiration as obtained from lysimeter between the period January 2009 and December 2016.
Performance of the nine methods were compared based on RMSE, MAE, MAD, MSE, MAPE, d (index of agreement), SSE and R2 values.
Standard Deviation (SD) σ indicates the deviation of data samples around its mean value and a smaller SD value signifies lesser scattering of data about the mean value.
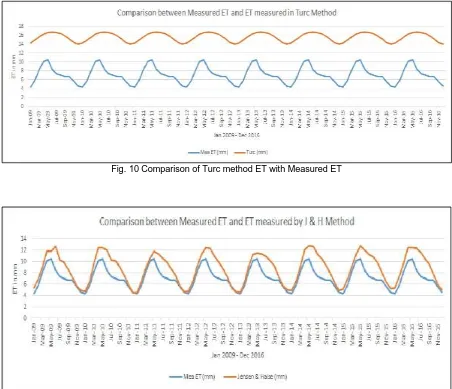
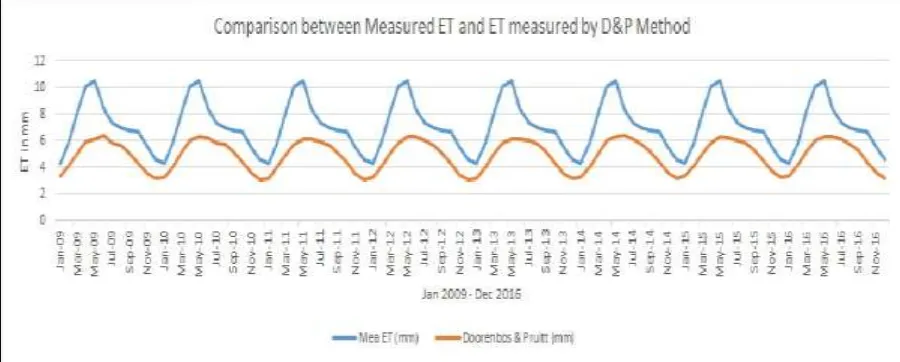
From Table 4 above, it is seen that Hargreaves method gives the best values for RMSE, MAE, MAPE and d (degree of agreement). Turc method produces the best values for MAD, MSE and SSE. Speaking of the R-squared value and adjusted R-squared value, Jensen & Haise method provides the best results whereas Hargreaves method stands in third position and Turc method produces the worst results. Albeit the method deemed fittest is not unanimous but Hargreaves shows the least deviation (0.394) from the actual measured value, it is chosen as the best fit.
5 CONCLUSION
Eight radiation-based methods were compared for
determining evapotranspiration losses based on the
INTERNATIONAL JOURNAL OF SCIENTIFIC & TECHNOLOGY RESEARCH VOLUME 9, ISSUE 03, MARCH 2020 ISSN 2277-8616
R
EFERENCES[1] F. Poyen, P. Kundu and A. Ghosh, "Temperature based ET Method Selection for Burdwan District in WB, INDIA", International Journal of Applied Engineering Research (ISSN 0973-4562), vol. 13, no. 16, pp. 12753-12763, 2018.
[2] R. G. Allen, M. Smith, A. Perrier and L. Pereira, "An update for the definition of reference evapotranspiration", ICID Bulletin, vol. 43, no. 2, pp. 1-34, 1994. [Accessed 8 January 2020].
[3] F. Poyen, A. Ghosh, P. Kundu and K. Sen, "Analysis of Evaluation Stages Involved in Penman Monteith Equation", Sensors & Transducers, vol. 202, no. 7, pp. 83-88, 2020.
[4] F. Poyen, A. Ghosh and P. Kundu, "Review on Different Evapotranspiration Empirical Equations", International Journal of Advanced Engineering, Management and Science, vol. 2, no. 3, pp. 17-24, 2016.
INTERNATIONAL JOURNAL OF SCIENTIFIC & TECHNOLOGY RESEARCH VOLUME 9, ISSUE 03, MARCH 2020 ISSN 2277-8616
5579
Table 1: Weather monthly average between 2009 and 2016 for Burdwan
Monthly Average Weather 2009 - 16
Month
Av.
Temp Rainfall
VPD (e s – e a)
Humidity Wind Speed Extra-terrestrial Radiation Solar
Radiation Pressure
Measured ET
Jan 22.9 5.12 1.3829 45.87 5.22 296.2623607 54.22110661 1015.23 2.17 Feb 27 9 1.8874 38.87 5.48 340.4194067 74.41604367 1012.95 2.93 March 32.4 11.16 2.5606 36.62 5.87 393.945894 100.7780476 1009.73 4.1
April 36.4 63.23 2.8470 45.12 7.55 436.7930099 134.8192014 1005.53 5.08 May 36.4 109.74 2.4065 55.62 8.78 458.0160424 143.2939428 1002.27 5.24 June 35.2 176.13 2.0492 61.12 8.57 463.3479076 140.9472691 999.21 4.22 July 31.9 357.32 1.1032 77.12 7.3 459.0346768 139.7960562 999.63 3.68 August 31.1 344.21 0.8590 81.87 6.7 442.1908583 124.5486632 1001.75 3.51 Sep 30.5 228.74 0.8048 82.62 5.48 406.4462433 97.56468894 1004.46 3.37 Oct 29.1 87.79 1.0207 75.25 4.27 354.4129661 80.63599907 1009.68 3.36 Nov 26.6 6.18 1.3887 58.25 4.41 304.8718352 61.41402598 1012.9 2.78 Dec 24 9.66 1.4518 46.75 5 281.3116253 48.80773284 1014.27 2.32
Table 2: List of acronyms
Symbol Represents
ET Reference Evapotranspiration ( 𝑑 )
𝑅 Net radiation at crop surface
𝑀𝐽 𝑑
G Soil Heat Flux density
𝑀𝐽 𝑑
T Mean daily Air Temperature °C
𝑢 Wind speed at 2 m height ( )
𝑒 Saturation vapour pressure (kPa)
𝑒 Actual vapour pressure (kPa)
𝑒 − 𝑒 Saturation vapour pressure deficit (kPa) Δ Slope Vapour Pressure Curve (𝑘𝑃 °𝐶 )
γ Psychrometric Constant (𝑘𝑃 °𝐶 )
Table 3: Climatic Parameters needed by each of the individual methods
Method Temperature Solar Radiation Relative Humidity Wind Speed Atm. Pressure Sat. Vapour Pressure
PM Y Y Y Y Y Y
Makkink Y Y Y Y
Turc Y Y Y
J&H Y Y
M&B Y Y
P&T Y Y Y Y
Hargreaves Y Y
D&P Y Y
INTERNATIONAL JOURNAL OF SCIENTIFIC & TECHNOLOGY RESEARCH VOLUME 9, ISSUE 03, MARCH 2020 ISSN 2277-8616
Table 4: performance of different temperature methods under different statistical parameters
Method Diff. from Measured
ET
RMSE MAE MAD MSE MAPE d SSE R2 Adj. R2
PM 0.56 1.430 1.183 2.040 5.774 17.370 0.878 554.384 0.703 0.7007 Makkink 1.289 1.616 1.299 1.284 2.022 17.436 0.741 194.151 0.735 0.7325 Turc 8.429 8.514 8.429 0.854 0.902 130.754 -8.833 86.684 0.682 0.6792 J&H 1.656 2.072 1.663 2.328 6.976 22.447 0.779 669.751 0.816 0.8146 M&B 6.589 6.985 6.589 3.399 14.764 92.091 -0.561 1417.008 0.805 0.8032 P&T 1.082 1.6301 1.450 1.966 4.763 21.921 0.825 457.338 0.688 0.6849 Hargreaves 0.394 0.937 0.813 1.586 3.195 11.037 0.930 306.735 0.796 0.7941 D&P 2.227 2.463 2.227 1.004 1.254 30.377 0.278 120.450 0.751 0.7493 Abtew 1.715 2.073 1.715 0.913 1.032 22.186 0.443 99.119 0.691 0.6879
Fig .1. Geographical Satellite Map of Burdwan
INTERNATIONAL JOURNAL OF SCIENTIFIC & TECHNOLOGY RESEARCH VOLUME 9, ISSUE 03, MARCH 2020 ISSN 2277-8616
5580
Fig .3. Average and Max Wind Speed between the period Jan 2009 and Dec 2016
Fig .4. Average Humidity and Cloud cover between the period Jan 2009 and Dec 2016
INTERNATIONAL JOURNAL OF SCIENTIFIC & TECHNOLOGY RESEARCH VOLUME 9, ISSUE 03, MARCH 2020 ISSN 2277-8616
Fig .6. Average Pressure between the period Jan 2009 and Dec 2016
Fig .7. Extra-terrestrial Radiation in 𝑀𝐽 for the period Jan 2009 and Dec 2016
INTERNATIONAL JOURNAL OF SCIENTIFIC & TECHNOLOGY RESEARCH VOLUME 9, ISSUE 03, MARCH 2020 ISSN 2277-8616
5582
Fig. 9 Comparison of Makkink method ET with Measured ET
Fig. 10 Comparison of Turc method ET with Measured ET
Fig. 11 Comparison of J & H method ET with Measured ET
INTERNATIONAL JOURNAL OF SCIENTIFIC & TECHNOLOGY RESEARCH VOLUME 9, ISSUE 03, MARCH 2020 ISSN 2277-8616
Fig. 13 Comparison of P & T method ET with Measured ET
Fig. 14 Comparison of Hargreaves method ET with Measured ET
INTERNATIONAL JOURNAL OF SCIENTIFIC & TECHNOLOGY RESEARCH VOLUME 9, ISSUE 03, MARCH 2020 ISSN 2277-8616
5584
Fig. 16 Comparison of Abtew method ET with Measured ET
Fig .17. Annual ET Values calculated under different methods