IJEDR1703136
International Journal of Engineering Development and Research (
www.ijedr.org
)
966
NOISE LEVEL AT COAL BASED THERMAL
POWER PLANT
1
Milind P. Joshi,
2Pankaj K. Pande,
3Pooja V. Mungantiwar
1Director, 2Scientific Officer [Safety], 3Scientific Officer 1Industrial Health Safety,
1Surya Envirotech, Nagpur, India.
__________________________________________________________________________________________
Abstract— Noise is defined as any unwanted sound that you do not need or want to hear. Loud noise can also create physical and psychological stress, reduce productivity, interfere with communication and concentration, and contribute to workplace accidents and injuries by making it difficult to hear warning signals. There are number of locations in every old Thermal Power Plant who is responsible to create noise. Different Coal based Thermal Power Plants were selected from the decade 1980 to 2011. In thermal power plant, most of the section can create high decibel noise i.e. 90 dB to 95 dB and it is hazardous to human health. Sound becomes undesirable when it disturbs the normal activities such as working, sleeping, and during conversations it can also cause memory loss, severe depression, and panic attacks. ISO 1999 standard describes a model for the prediction of the distribution of the hearing loss at a given frequency, in a population of a given age, after a certain number of years of exposure to a LEX, 8h level. Use of a three Level risk scale provides guidance for the assessment of the Level of risk. Level 1- Daily noise exposure level definitely below 80 dB (A), which has a minimal risk of noise induced hearing loss.
Level 2- Intermediate risk, lying between 80-85 dB (A) having some risk of noise induced hearing losses
Level 3- Daily noise exposure level definitely over 85 dB (A), the value for which it is recommended that Technical measures should be taken to reduce noise exposure.
The Risk evaluation due to Noise generation and the estimation of unaccepted level has been computed.
The potential hazard shall be controlled to eliminate the occupational health effects to the exposed persons either in acute or chronic sense.
Key word— Noise, Hear, Thermal Power Plant, Level of Risk.
__________________________________________________________________________________________
I.INTRODUCTION
Noise related hearing loss has been listed as one of the most prevalent occupational health concerns around the globe for more than 25 years. Thousands of workers every year suffer from preventable hearing loss due to high workplace noise levels. Exposure to high levels of noise can cause permanent hearing loss. Neither surgery nor a hearing aid can help correct this type of hearing loss. Short term exposure to loud noise can also cause a temporary change in hearing (your ears may feel stuffed up) or a ringing in your ears (tinnitus).These short term problems may go away within a few minutes or hours after leaving the noisy area. However, repeated exposures to loud noise can lead to permanent tinnitus and/or hearing loss.
Loud noise can also create physical and psychological stress, reduce productivity, interfere with communication and concentration, and contribute to workplace accidents and injuries by making it difficult to hear warning signals. Noise induced hearing loss limits your ability to hear high frequency sounds, understand speech, and seriously impairs your ability to communicate. The effects of hearing loss can be profound, as hearing loss can interfere with your ability to enjoy socializing with friends, playing with your children or grandchildren, or participating in other social activities you enjoy, and can lead to psychological and social isolation.
How does the ear work?
What are the warning signs that your workplace may be too noisy? How loud is too loud?
IJEDR1703136
International Journal of Engineering Development and Research (
www.ijedr.org
)
967
When sound waves enter the outer ear, the vibrations impact the ear drum and are transmitted to the middle and inner ear. In the middle ear three small bones called the malleus (or hammer), the incus (or anvil), and the stapes (or stirrup) amplify and transmit the vibrations generated by the sound to the inner ear. The inner ear contains a snail like structure called the cochlea which is filled with fluid and lined with cells with very fine hairs. These microscopic hairs move with the vibrations and convert the sound waves into nerve impulses–the result is the sound we hear.Exposure to loud noise can destroy these hair cells and cause hearing loss!
What are the warning signs that your workplace may be too noisy?
Noise may be a problem in your workplace if:
You hear ringing or humming in your ears when you leave work You have to shout to be heard by a coworker an arm's length away You experience temporary hearing loss when leaving work How loud is too loud?
Noise is measured in units of sound pressure levels called decibels, named after Alexander Graham Bell, using A-weighted sound levels (dBA). The A-weighted sound levels closely match the perception of loudness by the human ear. Decibels are measured on a logarithmic scale which means that a small change in the number of decibels results in a huge change in the amount of noise and the potential damage to a person's hearing.
OSHA sets legal limits on noise exposure in the workplace. These limits are based on a worker's time weighted average over an 8 hour a day. With noise, OSHA's permissible exposure limit (PEL) is 90 dBA for all workers for an 8 hour day. The OSHA standard uses a 5 dBA exchange rate. This means that when the noise level is increased by 5 dBA, the amount of time a person can be exposed to a certain noise level to receive the same dose is cut in half.
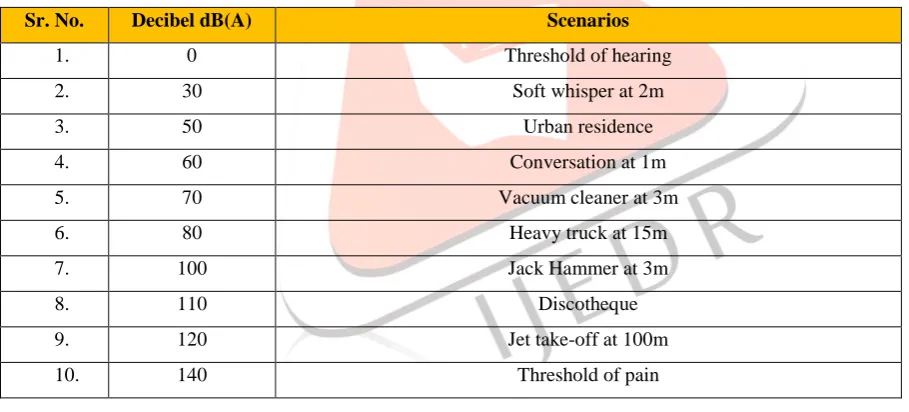
Typical levels of A-weighted sound levels against various scenarios Sr. No. Decibel dB(A) Scenarios
1. 0 Threshold of hearing
2. 30 Soft whisper at 2m
3. 50 Urban residence
4. 60 Conversation at 1m
5. 70 Vacuum cleaner at 3m
6. 80 Heavy truck at 15m
7. 100 Jack Hammer at 3m
8. 110 Discotheque
9. 120 Jet take-off at 100m
10. 140 Threshold of pain
Table I. Typical A-weighted sound levels
IJEDR1703136
International Journal of Engineering Development and Research (
www.ijedr.org
)
968
II.METHODOLOGY AND LOCATION SELECTION FOR NOISE LEVEL SURVEY
All most all Thermal Power Stations (coal based) in India were established in the decade of 1980. Old technology as well as wear and tear in machine parts plays main role in noise creation. Over a period of time, frequent failures and leakages in different parts of machines and pipelines disturb the overall maintenance schedule of the plant. Some machine parts exceed the reliability period declared by manufacturers still did not replaced as they are in position to work. All these factors cumulatively result in hazard to human health. There are number of locations in every such old Thermal Power Plant who is responsible to create noise are listed below -
High Noisy Area Section
Turbine Floor Turbine Basement Boiler Feed Pump Compressor Area Firing Floor Coal Feeder Coal Mill PA Fan FD Fan ID Fan
AHP Compressor Area AHP Pump
GS Pump House CW Pump House Bunker House
Different Coal based Thermal Power Plants were selected from the decade 1980 to 2011, and are tabulated below in the table. units of 210 MW and one of 500 MW with different years of establishing were selected for noise level survey. The noise level survey was done at all the selected location in all the 05 plants for 12 months, monthly monitoring in all 22 sensitive locations in every Plant was done to get noise levels.
Stage
Unit No.
Installed Capacity (MW)
Date of Commissioning
1st 1 210 1989 March
1st 2 210 1990 January
1st 3 210 2000 April
1st 4 210
2001 January
1st 5 500 2011 August
Total Five 1340
IJEDR1703136
International Journal of Engineering Development and Research (
www.ijedr.org
)
969
III.RISK EVALUATION AND ESTIMATION
The ISO 1999 standard describes a model for the prediction of the distribution of the hearing loss at a given frequency, in a population of a given age, after a certain number of years of exposure to a LEX, 8h level. From this standard, Figure below was derived; it gives, as a function of LEX, 8h, the percentage of the population aged 60 years, which, after 40 years of exposure, would develop mean hearing impairments (average 500 Hz, 1 kHz, 2 kHz, 3 kHz) greater than 25 dB. The figure shows that the risk of hearing impairment increases quadratically as a function of LEX, 8h. Therefore, if the risk is to be estimated with a given accuracy (for instance + 2%), the accuracy required for the evaluation of LEX, 8h increases: for instance, 88 + 2 dB (A) but 94 + 1 dB (A).
Use of a three level risk scale provides guidance for the assessment of the level of risk.
Level 1
Daily noise exposure level definitely below 80 dB (A), which has a minimal risk of noise induced hearing loss Level 2
Intermediate risk, lying between 80-85 dB (A) having some risk of noise induced hearing losses Level 3
Daily noise exposure level definitely over 85 dB (A), the value for which it is recommended that Technical measures should be taken to reduce noise exposure.
IJEDR1703136
International Journal of Engineering Development and Research (
www.ijedr.org
)
970
As per the guidelines the permissible noise exposures is given in the table below as follows:
Table II. Permissible Noise as per OSHA guidelines
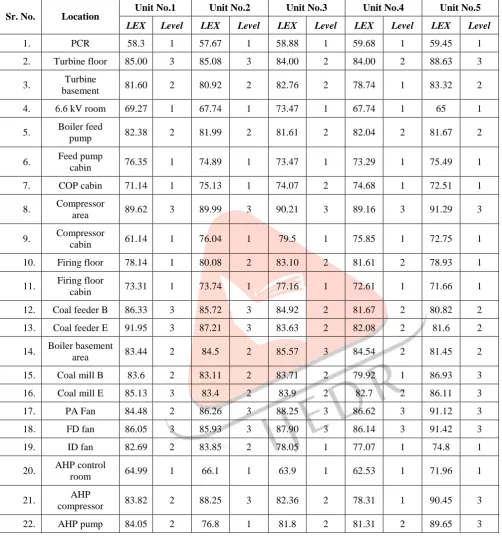
The average level of noise monitoring of all twelve months are represented in the following table and the most significant Noise level is categorized as Level 3.
Sr. No Duration (per Hour) Sound Level (in dB(A))
1. 8 90
2. 6 92
3. 4 95
4. 3 97
5. 2 100
6. 1 ½ 102
7. 1 105
8. ½ 110
IJEDR1703136
International Journal of Engineering Development and Research (
www.ijedr.org
)
971
IV.RESULTANDDISCUSSIONS
Table I – Annual Average of Unit No.1, 2, 3, 4 & 5
Sr. No. Location Unit No.1 Unit No.2 Unit No.3 Unit No.4 Unit No.5
LEX Level LEX Level LEX Level LEX Level LEX Level
1. PCR 58.3 1 57.67 1 58.88 1 59.68 1 59.45 1
2. Turbine floor 85.00 3 85.08 3 84.00 2 84.00 2 88.63 3
3. Turbine
basement 81.60 2 80.92 2 82.76 2 78.74 1 83.32 2
4. 6.6 kV room 69.27 1 67.74 1 73.47 1 67.74 1 65 1
5. Boiler feed
pump 82.38 2 81.99 2 81.61 2 82.04 2 81.67 2
6. Feed pump
cabin 76.35 1 74.89 1 73.47 1 73.29 1 75.49 1
7. COP cabin 71.14 1 75.13 1 74.07 2 74.68 1 72.51 1
8. Compressor
area 89.62 3 89.99 3 90.21 3 89.16 3 91.29 3
9. Compressor
cabin 61.14 1 76.04 1 79.5 1 75.85 1 72.75 1
10. Firing floor 78.14 1 80.08 2 83.10 2 81.61 2 78.93 1
11. Firing floor
cabin 73.31 1 73.74 1 77.16 1 72.61 1 71.66 1
12. Coal feeder B 86.33 3 85.72 3 84.92 2 81.67 2 80.82 2
13. Coal feeder E 91.95 3 87.21 3 83.63 2 82.08 2 81.6 2
14. Boiler basement
area 83.44 2 84.5 2 85.57 3 84.54 2 81.45 2
15. Coal mill B 83.6 2 83.11 2 83.71 2 79.92 1 86.93 3
16. Coal mill E 85.13 3 83.4 2 83.9 2 82.7 2 86.11 3
17. PA Fan 84.48 2 86.26 3 88.25 3 86.62 3 91.12 3
18. FD fan 86.05 3 85.93 3 87.90 3 86.14 3 91.42 3
19. ID fan 82.69 2 83.85 2 78.05 1 77.07 1 74.8 1
20. AHP control
room 64.99 1 66.1 1 63.9 1 62.53 1 71.96 1
21. AHP
compressor 83.82 2 88.25 3 82.36 2 78.31 1 90.45 3
IJEDR1703136
International Journal of Engineering Development and Research (
www.ijedr.org
)
972
Graph 1 Annual Average Noise Level at Unit No. 1
Graph 2 Annual Average Noise Level at Unit No. 2
0 10 20 30 40 50 60 70 80 90 100
Series1 Unit 1
0 10 20 30 40 50 60 70 80 90 100
IJEDR1703136
International Journal of Engineering Development and Research (
www.ijedr.org
)
973
Graph 3 Annual Average Noise Level at Unit No. 3
Graph 4 Annual Average Noise Level at Unit No. 4
0 10 20 30 40 50 60 70 80 90 100
Series1 Unit
3
0 10 20 30 40 50 60 70 80 90 100
Series1
IJEDR1703136
International Journal of Engineering Development and Research (
www.ijedr.org
)
974
Graph 5 Annual Average Noise Level at Unit No. 5
The annual average noise level cumulative values are represented and studies statistically using software “Table” for Units 1,2,3,4 & 5.
Graph 6 Annual Average of Unit No. 1,2,3,4 & 5
0 10 20 30 40 50 60 70 80 90 100
Series1
IJEDR1703136
International Journal of Engineering Development and Research (
www.ijedr.org
)
975
V.RISKREDUCTION&CONCLUSIONS
As with any occupational hazard, control technology should aim at reducing noise to acceptable levels by action on the work environment. Such action involves the implementation of any measure that will reduce noise being generated, and/or will reduce the noise transmission through the air or through the structure of the workplace. Such measures include modifications of the machinery, the workplace operations, and the layout of the workroom. In fact, the best approach for noise hazard control in the work environment is to eliminate or reduce the hazard at its source of generation, either by direct action on the source or by its confinement.
Practical considerations must not be overlooked; it is often unfeasible to implement a global control program all at once. The most urgent problems have to be solved first; priorities have to be set up. In certain cases, the solution may be found in a combination of measures which by themselves would not be enough; for example, to achieve part of the required reduction through environmental measures and to complement them with personal measures (e.g. wearing hearing protection for only 2-3 hours), bearing in mind that it is extremely difficult to make sure that hearing protection is properly fitted and properly worn.
For Thermal power plants, the major noise sources are coal unloading plant, coal crusher plant, compressor, boiler feed pump, turbine, Forced Draft Fan (F.D. fan), Induced Draft Fan (I.D. fan), Demineralized plant (D.M. plant), cooling tower, aerial rope way etc.
Noise control measures are required to be implemented according to the hierarchy of control so far as reasonably practicable.
The Risk evaluation due to Noise generation and the estimation of unaccepted level has been computed and tabulated in Table and graphical representation is done in Graph.
The common Noise generating sources in the Coal Based Thermal Power Plant on the basis of monthly noise level monitoring from April 2016 to March 2017, it is concluded that the following are the most Noise Generating Areas.
Turbine Generators
Fan Intake & Exhaust (PA, ID, FD fans) Motors
Steam Exhaust Centrifugal blowers Compressors Piping and ducts
This potential hazard shall be controlled to eliminate the occupational health effects to the exposed persons either in acute or chronic sense. There are different tools and methods available globally which may be suggested as mitigation measures to reduce the risk to the acceptable level.
Replacement of old machines with modern noise reducing or noiseless machines is highly recommended. Acoustician and using PPEs is the instant solution for getting respite from the situation.
IJEDR1703136
International Journal of Engineering Development and Research (
www.ijedr.org
)
976
VI.INFERENCE
It is concluded that the overall maintenance of the plant and following of the individual maintenance schedule of the equipment is very much helpful in achieving noise level reductions.
The Organization may consider the maintenance schedule with less intervals to get more reduction in noise level. Strict implementation of Engineering and Administrative Controls, Compulsion of using PPEs and Personal Hearing Protectors shall be done.
‘High Noise Level Zone’ Warning Display shall be done at all the areas where LEX Noise Level is 3 and use of
Personal Hearing Protectors shall be made mandatory before entering such zones.
Audiometric Medical Check Up for the persons working in High Noise Level Zone shall be mandatory and special precautions shall be taken to reduce their exposure.
Hazard of noise may be put in safety awareness programs.
VII.REFERENCE
[1] Tandel B.N, and MacwanJem, Assessment and Mlr Modelling Of Urban Traffic Noises at Major Arterial Roads of Surat, India, Journal of Environmental Research and Development. 2013; 7(4A):1703-1709.
[2] Murthy,V.K., Khanal, S.N., Assessment of traffic noise pollution in Banepa, a semi urban town of Nepal, Kathmandu university, Journal of science, engineering and technology, 2007;1:1-9.
[3] Babisch W: Noise and health. Environ Health Perspect, 2005, 113(1):A14-15.
[4] Babisch W: Traffic Noise and Cardiovascular Disease:Epidemiological Review and Synthesis. 2000, 2(8):9- 32.
[5] Ahmad Jamrah, Abbas Al-Omari and RemmSharabi,Evaluation Of Traffic Noise Pollution In Amman and Jordan, Environmental Monitoring and Assessment ,2006;120:499-525.
[6] Edmund Yet Wah Seto, Ashley Holt, Tom Rivard and Rajiv Bhatia, Spatial Distribution Of Traffic Induced Noise Exposures In A U.S City: An Analytic Tool For Accessing The Health Impact Of Urban Planning Decision, International Journal Of Health Geographics 2007; 6(24):1-16.
[7] Patil C.R., J.P.Modak, P.VaishaliChoudhari and D.S.Dhote, Subjective Analysis Of Road Traffic Noise Annoyance Around Major Arterials In Intermediate City , European Journal Of Applied Sciences, 2011; 3(2):58-61.
[8] Subramani.TKavitha.MSivaraj.K.P, Modelling of Traffic Noise Pollution, International Journal of Engineering Research and Applications, 2012; 2(3):3173-3182.
[9] Debasish Bhattacharya, Debashish Pal, A Study Of Road Traffic Noise Annoyance On Daily Life In Agartala City Using Fuzzy Expert System And Multiple Regression Analysis, International Journal Of Scientific And Research Publications 2012; 2(5):1-7.
[10] Lundberg U: Coping with Stress: Neuroendocrine Reactions and Implications for Health. Noise Health 1999; 1(4):67-74.
[11] Li B., Taoa.S, Dawsona. R.W., Caoa. J. and Lamb. K.A. GIS based road traffic noise prediction model, Applied Acoustics, 2002; 63:679–691.
[12] Santosh Chouhan, Ram RatanAhirwal, Yogendra Kumar Jain, Traffic Control Scheme Using Mobile Data Collectors For Wsn, International Journal Of Scientific and Research Publication 2012;2:1-7
[13] Belojevic GA, Jakovljevic BD, Stojanov VJ, Slepcevic VZ, Paunovic KZ: Nighttime road-traffic noise and arterial hypertension in an urban population. Hypertens Res 2008, 31(4):775-781
IJEDR1703136
International Journal of Engineering Development and Research (
www.ijedr.org
)
977
[15] World Health Organization (WHO) (2001) Occupational and Community Noise. Fact sheet Number 258, Revised February 2001, Geneva.[16] Republic of Turkey Ministry of Environment (1986) Turkey Organization Standards, Noise Exposure Regulation.
[17] Ugwuanyi, J.U., Ahemen, I. and Agbendeh, A.A. (2004) Assessment of Environmental Noise Pollution in Markurdi Metropolis, Nigeria. Zuma Journal of Pure and Applied Sciences, 6, 134-138.
[18] Goelzer, B.I.F., Hansen, C.H. and Sehrndt, G.A (Editors) (2001) Occupational Exposure Noise: Evaluation, Prevention and Control. World Health Organisation Special Report, S64, Federal Institute of Occupational Safety and Health, Germany
[19] Öhrström, E. (1989) Sleep Disturbance Psycho-Social and Medical Symptoms a Pilot Survey among Person Exposed to High Levels of Road Traffic Noise. Journal of Sound and Vibration, 133, 117.