UNIVERSITY OF LONDON
GENERIC PRESCRIBING IN
GENERAL PRACTICE
Nicola Jane Davey, BPharm (Hons), MRPharmS
Thesis submitted for Master of Philosophy
School of Pharmacy Brunswick Square
ProQuest Number: 10105117
All rights reserved
INFORMATION TO ALL USERS
The quality of this reproduction is dependent upon the quality of the copy submitted.
In the unlikely event that the author did not send a complete manuscript and there are missing pages, these will be noted. Also, if material had to be removed,
a note will indicate the deletion.
uest.
ProQuest 10105117
Published by ProQuest LLC(2016). Copyright of the Dissertation is held by the Author.
All rights reserved.
This work is protected against unauthorized copying under Title 17, United States Code. Microform Edition © ProQuest LLC.
ProQuest LLC
789 East Eisenhower Parkway P.O. Box 1346
ABSTRACT
The study highlights the need to design new prescribing initiatives to realise remaining savings from generics. This presents a particular challenge: In the absence of demonstrable economic benefits e.g. money released to pay for other treatments, or clinical benefits (for which the evidence is sparse) the advantages of generic prescribing are less easy to promote to GPs already overloaded with information and demands on their time.
The generic prescribing rate in General Practice in the UK increased from 41% in 1991 to 47% in 1993. Despite this large variation remains in the generic rate at Regional, Family Health Service Authority (FHSA) and practice levels. In marked contrast to the detailed information on generic prescribing rate, information on actual and potential savings are not routinely available.
In this thesis a new measure of generic prescribing performance was developed to identify practices where substantial generic savings could be achieved. In addition the relationship between practice characteristics and generic savings potential was examined in order to identify practice characteristics associated with both high and low generic savings profiles. The generic rate was found to be significantly but only weakly correlated with generic savings potential and six practice
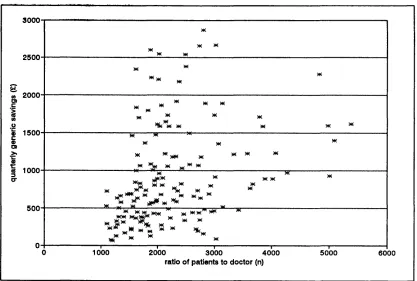
characteristics were found to explain 65 % of the variation in generic savings at practice level. Practices with a larger number of partners, a lower generic rate, a higher patient per doctor ratio, a higher proportion of patients over 65, higher prescribing costs and no computer were associated with higher generic savings potential. Total quarterly generic savings potential for 21 products in the FHSA studied were £146,000, suggesting annual savings of £584,000.
LIST OF CONTENTS Page no.
List of t a b le s ... 7
List of figures ... 8
List of abbreviations ... 10
D eclaratio n ... 11
Acknowledgements ... 12
Overview ... 13
CHAPTER 1: Generic Prescribing - An Historical Perspective... 14
Summary ... 15
1.1 NHS foundation and reforms ... 16
1.1.1 Small changes... 17
1.1.2 Larger c h a n g e s... 18
1.2 Government prescribing reviews until 1983 ... 21
1.2.1 Hinchliffe (1959) ... 21
1.2.2 Sainsbury (1967) ... 23
1.2.3 Greenfield (1983)... 24
1.3 Government prescribing schem es... 26
1.3.1 The Tricker R e p o r t... 26
1.3.2 Limited List ... 26
1.3.3 The development o f PACT data ... 27
1.3.4 The Indicative Prescribing Scheme... 28
1.3.5 Performance indicators ... 31
1.3.6 Resources ... 32
1.4 The development of generic prescribing in general p ra c tic e ... 34
1.4.1 Changes in generic prescribing r a t e s... 34
1.4.2 Responses to reporting the generic prescribing rate . . . . 35
1.5 Discussion and Conclusions... 36
Page no
CHAPTER 2: Measures and Patterns of Prescribing Behaviour ... 37
Summary ... 38
2.1 Prescribing analysis and costs - PACT data ... 39
2.1.1 Prescribing Units ... 40
2.1.2 Number o f item s... 41
2.1.3 The generic ra te... 41
2.2 Weaknesses of the generic rate as a performance indicator ... 43
2.2.1 Behavioural measure o f generic prescrib in g... 44
2.2.2 Economic measure o f generic usage ... 45
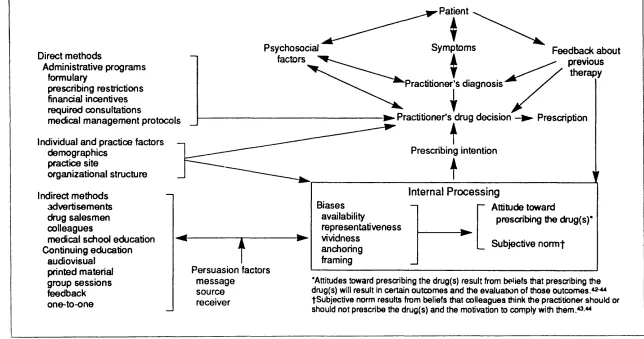
2.3 Models of influences on prescribing behaviour ... 46
2.4 Sources of influence on prescribing decisions ... 52
2.4.1 Indirect methods ... 52
2.4.2 Direct methods ... 60
2.4.3 Individual and practice factors ... 64
2.5 Multiple regression models ... 71
2.6 Discussion ... 72
2.7 Study aims and o b jectiv es... 74
CHAPTER 3: Method ... 75
Summary... ... 76
3.1 Selection of Study Area ... 77
3.2 Selection of GP sam ple... 78
3.3 Generation of the current generic prescribing m ea su re ... 79
3.3.1 The PPA data and generic prescribing statistics ... 79
3.4 Generation of new dependent variable: Generic savings potential (GSPl 82 3.4.1 Programme d e s ig n... 82
3.4.2 Product s a m p le... 83
3.4.3 Calculation o f total product volume and cost ... 85
3.4.4 Processing o f PPA dataset ... 86
Page no
3.5 Selection of dependent variables: Practice/doctor characteristics . . . . 88
3.5.1 Data collection ... 89
3.5.2 Data preparation... 90
3.6 Analytic strategy ... 91
CHAPTER 4: R esults... 93
Summary ... 94
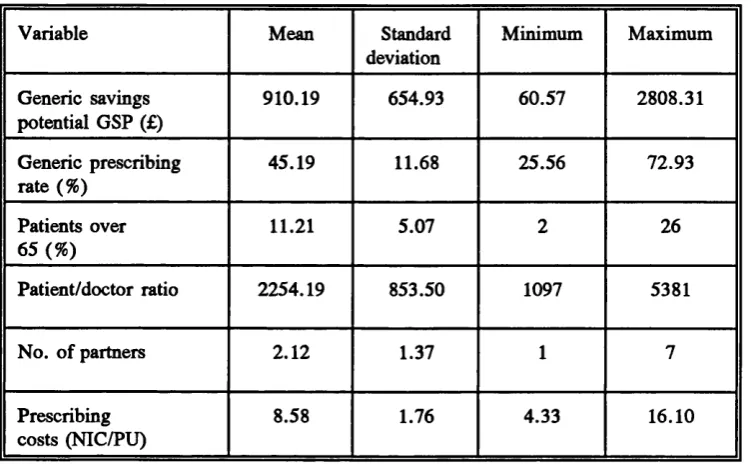
4.1 Practice characteristics... 95
4.2 Practice characteristics and generic savings: preliminary analysis . . . 101
4.2.1 Generic savings and generic rate ... 105
4.2.2 Generic savings and the proportion o f patients over 65 y e a r s... 106
4.2.3 Generic savings and the practice patient/doctor ratio . . . 106
4.2.4 Generic savings and number o f p a r tn e r s...107
4.2.5 Generic savings and computer status ... 107
4.2.6 Generic savings and practice prescribing cost (NIC/PU) . 108 4 .2 .7 Relationships between independent variables...108
4.3 Practice characteristics and generic savings: Multiple regression model 109 4.3.1 Constructing the final regression m o d e l...113
4.4 Correlations after the removal of linear relationship between v a ria b le s ...115
4.4.1 Partial regression plots ... 115
4.4.2 Partial correlation coefficients... 119
CHAPTER 5: Discussion ...121
Summary ...122
5.1 Findings...123
5.1.1 Assessment o f new generic savings m e a s u r e...123
5.1.2 Results o f multiple regression analysis ...123
Page no
5.2 General discussion...124
5.2.1 A new way o f monitoring generics... 124
5.2.2 Accuracy and relevance o f generic measures as indicators o f prescribing performance ... 126
5.2.3 The strength o f the regression model ... 130
5.2.4 Comparing the model with r e a lity... 136
5.2.5 Mismatched generic profiles ... 138
5.2.6 Implications o f this study fo r City & East London FHSA . 142 5.2.7 Wider Im plications... 143
5.3 Strength of Raisch’s model as an exploratory tool and to inform prescribing strategies ...146
5.3.1 Suitability o f model as an exploratory t o o l... 146
5.3.2 Study findings in light o f model ...147
5.4 Conclusions and Implications for future strategies... 151
5.4.1 Matching indicators to objectives ... 151
5.4.2 Matching strategies to practices and tools to t a s k s 153 5.4.3 A future fo r g en erics...157
Appendix 1 Example of PACT Level 1 d a ta ... 160
Appendix 2 Example of PACT Level 2 d a ta ...162
Appendix 3 Example of PACT Level 3 d a ta ...166
Appendix 4 Example of PACT data from 1994 (combined Levels 1 & 2) . . . 168
Appendix 5 Example of graph generated by P A C T L IN E ...169
LIST OF TABLES Page no.
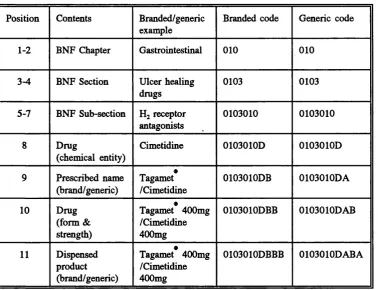
Table 3.1 Product code structure for the PPA database... 80 Table 3.2 List of products used to calculate potential practice savings from
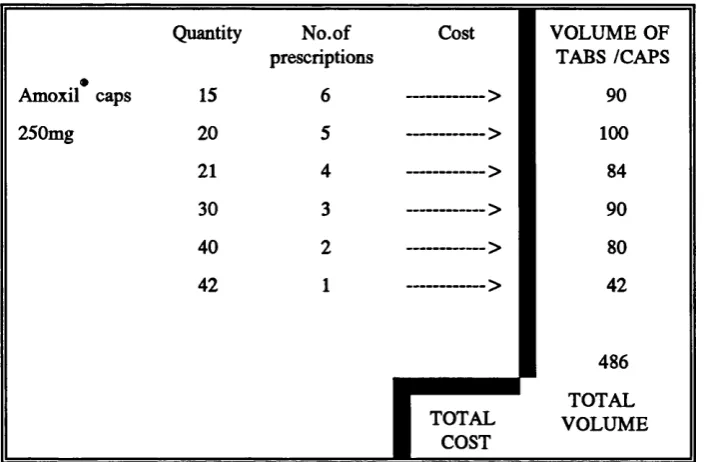
generic substitution... 84 Table 3.3 Example of extract from PACT level 3 showing cost and volume
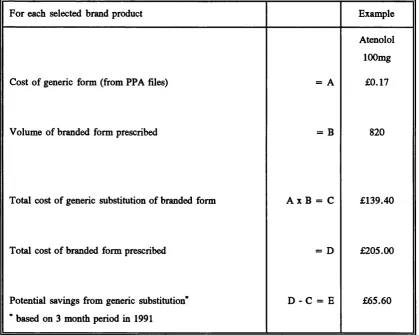
calculations that need to be performed on PPA data down l o a d ... 86 Table 3.4 Method for calculating potential generic savings... 87 Table 4.1 Summary of descriptive statistics for practice characteristics 95 Table 4.2 Pearson product-moment correlation m atrix ... 105 Table 4.3 Statistics for the final regression model... 113 Table 4.4 Partial correlation coefficient m a tr ix ... 119 Table 5.1 Characteristics of practices with above average generic rates and
generic savings potential... 139 Table 5.2 Characteristics of practices with below average generic rates and
LIST OF FIGURES Page no.
Figure 2.1 A model of methods for influencing prescribing... 49
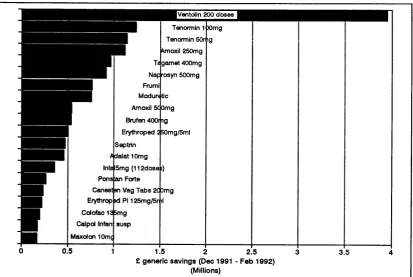
Figure 4.1 ’Top-20’ products producing the greatest savings potential from generic substitution (England only)... 97
Figure 4.2 Distribution of generic savings potential... 97
Figure 4.3 Distribution of generic prescribing rate... 98
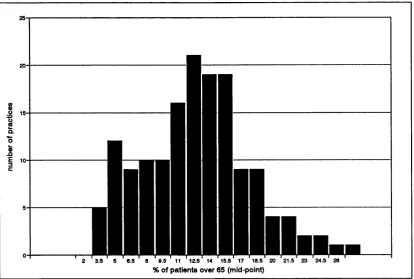
Figure 4.4 Distribution of percentage of patients over 65 years... 98
Figure 4.5 Distribution of practice average ratio of patients to doctor... 99
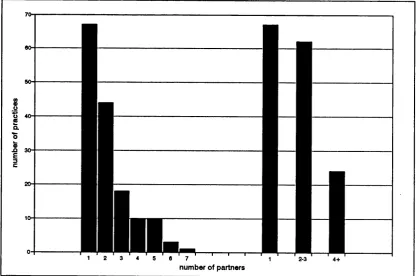
Figure 4.6 Distribution of number of partners, separately and grouped 99 Figure 4.7 Distribution of computer status and computer software type 100 Figure 4.8 Distribution of practice prescribing cost (NIC/PU)... 100
Figure 4.9 City & East London vs National figures for prescribing costs and proportions of patients over 65 years... 101
Figure 4.10 Scatterplot of generic prescribing rate and quarterly generic savings potential... 102
Figure 4.11 Scatterplot of percentage of patients over 65 years and quarterly generic savings potential... 102
Figure 4.12 Scatterplot of patients to doctor and quarterly generic savings potential...103
Figure 4.13 Scatterplot of partners and quarterly generic savings potential. . . 103
Figure 4.14 Scatterplot of computer status and quarterly generic savings potential...104
Figure 4.15 Scatterplot of prescribing costs and quarterly generic savings potential...104
Figure 4.16 Scatterplot of standardised residuals from regression of generic savings on generic rate and standardised predicted values of generic savings...110
Page no Figure 4.18 Scatterplot of standardised residuals from regression of generic
savings on practice ratio of patients to doctor and standardised predicted
values of generic savings... I l l Figure 4.19 Scatterplot of standardised residuals from regression of generic
savings on number of partners and standardised predicted values of generic savings...I l l Figure 4.20 Scatterplot of standardised residuals from regression of generic
savings on practice computer status and standardised predicted values of
generic savings...112 Figure 4.21 Scatterplot of standardised residuals from regression of generic
savings on practice prescribing costs and standardised predicted values of generic savings...112 Figure 4.22 Partial plot showing relationship between residuals for practice
generic prescribing rate and generic savings potential... 116 Figure 4.23 Partial plot showing relationship between residuals for practice
percentage of patients over 65 years and generic savings potential... 116 Figure 4.24 Partial plot showing relationship between residuals for practice
ratio of patients to doctor and generic savings potential...117 Figure 4.25 Partial plot showing relationship between residuals for number of
partners and generic savings potential...117 Figure 4.26 Partial plot showing relationship between residuals for practice
computer status and generic savings potential... 118 Figure 4.27 Partial plot showing relationship between residuals for practice
LIST OF ABBREVIATIONS
ACTAP Audit Commission Thematic Analysis of Prescribing
ASTRO-PU Age, Sex, and Temporary Resident Originated Prescribing Units BMA British Medical Association
BNF British National Formulary
DoH Department of Health
FHSA Family Health Services Authority FPC Family Practitioner Committee GSP Generic Savings Potential
GP General Practitioner
MAAG Medical Audit Advisory Group MCA Medicines Control Agency NHS National Health Service
NIC Net Ingredient Cost
PACT Prescribing and Costs Analysis
PACTLINE Prescribing and Costs Analysis on Line PPA Prescription Pricing Authority
PU Prescribing Unit
RMO Regional Medical officer SPA Scottish Prescribing Analysis
SPSS Statistical Package for the Social Sciences
SPSSPC SPSS computer software for use on personal computers
DECLARATION
The work conducted in this thesis was carried out whilst I was employed as a Pharmaceutical Adviser to City and East London Family Health Services Authority. The work was funded by the Health Authority. Data access, computer
programming support, and advice was provided by the Leeds Prescribing Research Unit. I am responsible for writing all parts of this thesis and for the conception, design, and analysis described within the body of this thesis. At all stages in the development of this work I have consulted with Dr Felicity Smith, Professor Bosanquet and David Roberts. David Clucas was responsible for developing the computer programme used to calculate generic savings. At several stages I have also consulted with Professor Conrad Harris and other members of the Leeds Prescribing Research Unit, the Prescription Pricing Authority, Ms Mary Tompkins and Brian Baker.
ACKNOWLEDGEMENTS
I would like to thank the following people for their special help in the completion of this thesis and their patience over the duration: Dr Felicity Smith, David Clucas, David Roberts, Mary Tompkins, Professor Nicholas Bosanquet and Professor Conrad Harris.
City and East London Family Health Services Authority for sponsoring me, and enabling me to use their data and Mr Alan Bennett for supporting the research element of my work for the authority.
Special thanks are also due to my partner Steven Glautier for his encouragement, support and criticisms! A mention should also go to my son Ivan who appeared in the middle of it and also to the son/daughter that is due in March - thereby adding to the urgency of completion!
Thanks are also due to all my friends and family that have continued to take an interest in my work.
OVERVIEW
This thesis is presented as five chapters. The introduction is divided into two parts. Chapter One provides an historical background to prescribing since the inception of the National Health Service in 1948. Government sponsored reviews of prescribing provide an insight into the pressures for and against generic prescribing. The substantial NHS reforms introduced in the 1990s are considered in some detail, since these have had the most dramatic impact on generic prescribing. The
introduction of performance indicators in the field of prescribing is also reviewed. Chapter Two focuses on generic prescribing, the way in which performance is currently measured, shortfalls in the generic rate as an indicator of prescribing economy, and recent prescribing trends. The literature relating to prescribing behaviour is then reviewed, and sources of influence on prescribing decisions discussed. The aims and objectives of this thesis are then presented.
Chapter Three describes the method used to develop a new measure of generic savings potential derived from prescribing data. Characteristics of the study area, sampling method and data collection are then described. Using prescribing data from City & East London Family Health Services Authority generic savings potentials for each practice are calculated. The relationship between these savings, the generic prescribing rate, and other practice characteristics identified in the literature review is then assessed by constructing a multiple regression model.
The results are presented in Chapter Four and discussed in Chapter Five in light of the literature review presented in the introduction. They are also considered in relation to recent efforts to influence generic prescribing behaviour, particularly in the study area. The use of a prescribing model as an exploratory tool is evaluated. Finally, the implications for future generic prescribing strategy is considered and some suggestions are made to match the performance indicator for generics more closely to the Government’s economic prescribing objectives.
CHAPTER 1
Summary
Since the National Health Service (NHS) was founded in 1948, the clinical freedom of General Practitioners (GPs) to prescribe any licensed drug has been the subject of many recommendations but relatively few constraints. This chapter presents a review of the history of generic prescribing in general practice spanning over four decades. Although quality and cost of prescribed drugs have been considered in successive government reviews over this period of time, with all making
recommendations in favour of generic prescribing, the only notable attempt to curb clinical freedom and generate savings through greater use of generic drugs was a scheme specifically rejected by one of the government’s own reviews in 1983. This long standing lack of government intervention may be in part due to a strong and successful lobby from the UK drug industry whose interests are served by brand name prescribing.
In 1989 the Government indicated in a White Paper its intentions to introduce the most wide ranging reforms of the NHS since its inception. It was not until these reforms that the concept of financial accountability for prescribing at practice level was introduced. In keeping with other activities, progress was to be measured using performance indicators. The new prescribing information, designed to provide GPs with feedback, was also perceived to provide a ready source of prescribing
measures and was therefore seen as a relatively accessible tool with which to undertake performance management.
In a prescribing review in 1983 concerns were raised regarding the temptation to introduce of arbitrary measures to curb prescribing behaviour. In this chapter prescribing measures relating to generic prescribing introduced as a result of the
1989 reforms are considered within the context of this earlier prescribing review.
1.1 NHS foundation and reforms
The NHS was set up in 1948 under the auspices of the Secretary of State for Labour, Aneurin Bevan. The intention was to provide comprehensive health services to all, free at the point of delivery. The proposal to introduce a national service was not without its critics, both from within the health professions and from within the Government (Webster, 1991). Within months of the launch concerns over the cost of the service were raised (Webster, 1991). In
pharmaceutical services alone the predicted spending for the first six months of £11.5 million was exceeded by £5 million leading Bevan to conclude that the costs of these services may pose a considerably greater threat to the NHS than many other areas of high growth such as dental fees (Webster, 1988).
In the first year alone, there were calls from some members of the Cabinet to introduce direct charging for selected services to avoid increasing the burden on the treasury. Suggestions for charging included dental and ophthalmic services and medicines. Bevan rejected these and instead favoured reduction or containment of expenditure through the recommendation of non-proprietary (generic) drugs where these were available (Webster, 1991). This suggestion was subsequently rejected by the British Medical Association (BMA), setting a precedent that remains to this day. Bevan also tried, unsuccessfully, to gain backing from the BMA to discipline doctors whose prescribing was considered extravagant (Webster, 1991). These two themes set the scene for others to follow over the next 40 years. Bevan resigned in
1951 over the Cabinet decision to introduce prescription charges although in the event they were not introduced within the Government’s term of office which lasted for a further 6 months and were subsequently introduced by the incoming
Conservative Government.
A number of organisational changes were made to the NHS over the next three decades, however the basic structure and ideals remained until the 1990’s. The first major legislative change in 1974 introduced management tiers into the NHS.
management of integrated hospital and community services. Local management was devolved to smaller district boundaries. Executive Councils, who contracted GPs, dentists, pharmacists and opticians to provide services, became Family Practitioner Committees (FPCs) (Leathard, 1990).
1.1.1 Small changes
In the early 1980’s a series of small bills were introduced which were instrumental in producing a profound change in NHS philosophy (Butler, 1994). Despite the limited introduction of general management in 1974, professional independence had prevailed. However, the Griffiths report (House of Commons, 1983) supported the introduction of general management at all levels of the NHS. Welcomed and acted upon by the Secretary of State, a broad management ethos was introduced
throughout the NHS, thereby threatening the traditional clinical power base (Butler, 1994).
The ’new managers’ working within the service became aware of the finite resources available for the NHS and, despite having some of the lowest costs for health care expenditure per person in Europe (Office of Health Economics, 1989) it became evident that the Government’s emphasis on securing a sound economic policy above all else, would encompass health care (Butler, 1994).
During the early 1980’s the Government introduced the concept of competitive tendering in the circular Contracting Out (Department of Health and Social Security, 1983). By the end of the decade the range of support services had been extended so that clinical services eg. pathology could be provided by private contractors. In 1989 the Department of Health (DoH) produced guidelines on the introduction of income generation schemes which led to the development of considerable commercial enterprise within NHS premises. Some hospital
pharmacies took advantage of this initiative to sell non-prescription medicines to the public. These relatively small legislative changes encouraged enterprise and
competition above collaboration and tradition and the resulting shift in values amounted to a significant cultural change within the NHS.
1.1.2 Larger changes
In 1987 renewed concerns with the cost of the NHS prompted the Conservative Prime Minister, Margaret Thatcher, to instigate a working party to review the operation of the whole service. At this time the White Paper Promoting Better
Health (Department of Health, 1987) was published, introducing the Government’s
plans to improve primary health care. Negotiations with the professions to secure their support were also announced.
Whilst the review concentrated primarily on plans to extend the GP contract and identified prescribing as the single largest element of Family Practitioner Services expenditure, plans for managing prescribing were confined to the section on
pharmaceutical services. The review stated that the introduction of the selected^ list in 1985 had saved £75 million in the first year. Whilst the Government declared that it had no plans to introduce compulsory generic prescribing or substitution, it was seeking evidence that voluntary activities would ’yield positive results’ through more economic and effective prescribing (Department of Health, 1987). The paper included the unsupported statement that ’voluntary generic prescribing is good professional practice’ and the government expressed its view that rises in the proportion of generic prescribing were expected to continue.
Promoting Better Health therefore provided clear signals of the changes envisaged
in the management of prescribing. Historically GP prescribing had been scrutinised by Regional Medical Officers answering directly to the Chief Medical Officer, but the paper described a pilot project using specially trained medical advisers to work within two health regions. As well as meeting GPs in their practices and at post
graduate centres, the officers were required to make more visits to GPs whose prescribing costs were significantly above the average. FPCs were to be given new responsibilities for encouraging cost effective prescribing with the support of the new ’independent’ medical advice.
The working party set up by Thatcher in 1987, but not announced until 1988, had started out with a brief to contain the government’s burden of the rising costs of health care provision through alternative sources of external funding. However by the end of 1988 the brief had changed considerably to encompass an NHS re organisation of unprecedented proportions but with little change to the funding base (Butler, 1994). The final recommendations emerged at the beginning of 1989 as a White Paper Working fo r Patients (Department of Health, 1989). This provided an introduction to the concept of an internal market for the NHS encompassing the purchaser/provider split, first explored by Enthoven in 1985 (Butler, 1994), but taking the concept much further. Working fo r Patients represented a consolidation of NHS philosophies encouraged and developed in the 1980s.
Following a period of consultation on the White Paper a series of eight working papers followed covering specific aspects of the service in varying amounts of detail. The main titles covered were: Self Governing Hospitals (Trusts); Funding and Contracts fo r Hospital Services; Practice Budgets fo r Ops (Fund Holders);
Indicative Prescribing Budgets fo r GPs; Capital Charges; Medical Audit; NHS
Consultants: Appointments, Contracts & Distinction Awards; and Implications fo r
Family Practitioner Committees.
Paper four gave details of the new Indicative Prescribing Scheme (IPS) of which budgets were a feature, and Paper three put this into context for GP fund holding practices. Paper eight provided the organisational reform to the FPCs thereby shifting the balance of power away from the professional committees, and the appointment of ’independent’ medical advisers to replace Regional Medical Officers. Paper six introduced the concept of Medical Audit Advisory Groups (MAAG), a title broad enough to encompass prescribing if desired. These
prescribing themes and ways in which they may relate to generic prescribing were subsequently developed in another Government Working Paper Improving
Prescribing (Department of Health, 1990). This is considered further in section
1.3.
Paper eight, Implications fo r Family Practitioner Committees, laid out the organisational changes and additional responsibilities that FPCs would need to encompass in their new role as Family Health Service Authorities (FHSAs).
FHSAs were to be accountable to the Regions instead of directly to the Department of Health. The additional responsibility regarding prescribing was accorded a special mention in the introduction. Until this time the task of monitoring prescribing and calling GPs to account rested with Regional Medical Officers answering directly to the Chief Medical Officer.
1.2 Government prescribing reviews until 1983
Three prescribing reviews, commissioned by different governments over three decades, all recommended the promotion or adoption of generic prescribing.
Commonly referred to by the name of their Chairmen, Hinchliffe (1959), Sainsbury (1967) and Greenfield (1983), the reports were all commissioned and published at a time when financial accountability for prescribing within general practice was not actively pursued, and this, together with the powerful ’brand-driven’ drug industry lobby did not create an environment receptive to their suggestions on generic prescribing.
1.2.1 Hinchliffe (1959)
In 1957 the Government commissioned a report on the cost of prescribing. At the request of the Minister for Health, the committee, lead by Sir Henry Hinchliffe, produced an interim report concentrating on general information and advice that could be provided to GPs to encourage more economical prescribing (Ministry of Health, 1958). By the time the final report was published (Ministry of Health, 1959), the majority of these interim recommendations were already being pursued and put into practice. An exception to this was the section on approved names which concerned the speed with which the names were allocated, and the ease with which they could be memorised. The committee suggested that manufacturers should request an approved name for a new product prior to its launch, so that the approved name could appear on all marketing material and drug information.
In the final report, the committee expanded on their earlier findings and
recommended that GPs should use approved names, even where they were more difficult to remember. Where GPs maintained a preference for branded products the committee recommended that they should be able to support their decision by reference to past experience or published evidence. They also recommended that the government or an alternative body should be charged with informing GPs as
soon as savings could be made by switching to the generic product i.e. when a patent has expired, and a competitor product is significantly cheaper.
The report recognised that there were misconceptions regarding the economies that could be generated from a total change to generic prescribing and that it was only prescribing of selected products (whose patent had expired) that would deliver this objective. This was perhaps the first recognition that on economic grounds alone a targeted campaign may be more appropriate. The authors also noted that although approved names were used increasingly for teaching purposes in medical schools, it did not appear that this activity was established to incur economic advantages.
The committee did not support the introduction of generic substitution by the dispenser considering it ’not a practical or desirable method of securing economies in the drugs bill’. It was thought that substitution by pharmacists would obviate the need for GPs to know and use the generic name and conflict with securing an effective long term solution by training doctors to be critical and discerning of their prescribing decisions.
The committee had access to a study undertaken by Dr J P Martin in 1951 into the prescribing behaviour of general practitioners and their environment, and also the trend analysis he provided up to 1957. In further work Martin and Williams (1959) concluded that frequency of issuing prescriptions had an important effect on total costs.
1,2.2 Sainsbury (1967)
The report of the Committee of Enquiry into the Relationship of the Pharmaceutical Industry with the National Health Service was published in 1967 (Ministry of Health, 1967). Known as the Sainsbury Report, it contained two recommendations concerning patents and brand names: The issues surrounding patents was referred to a specialist committee on the subject, the Committee’s considerations on brand names is now summarised.
Evidence presented by the medical profession supported the use of approved (generic) names. On the other hand, evidence presented by the industry supported their desire to associate the product and company. On balance, the findings of a large survey of GPs’ views on drugs and the drug industry, commissioned by the Committee, led them to conclude that the greater importance given to advertising the brand name only served to increase the industry’s defence of higher prices even when competitively priced generic equivalents were available.
The Committee therefore recommended that new products entering the market should only be licensed and marketed under their approved (generic) name. They recommended that brand name licensing should cease but that manufacturers name or trade mark could be included in subsequent marketing and in this way they envisaged that brand names would gradually disappear. In 1967 this latter concept may not have been as unrealistic as it may seem today since the promotion and marketing of brand names for medicines had only really begun in earnest in the late 1950’s following the introduction of large scale production of the sulphonamide antibiotics. Given the established drug industry in the 1990’s such a proposal would now be considered extremely radical and possibly unrealistic and in the event they were not implemented in 1967. Many of the recommendations contained within the report in a section entitled Future Pricing Arrangements and the Medicines
Commission were implemented (Ministry of Health, 1967).
1.2.3 Greenfield (1983)
The Greenfield report was the result of an informal working group reporting to the Secretary of State (Department of Health and Social Security, 1983). The terms of reference were broad; to identify ways of encouraging effective prescribing. The group looked at the prescribing information available to doctors, the support from the Regional Medical Officers, publications, hospital prescribing, limitations on prescribing (including generics, limited lists and formularies), quantities prescribed and education of doctors and patients. It was accepted that savings should be achieved where they could be justified, and that cost effectiveness was also within the remit. However, the group were concerned that there was a strong temptation in some quarters to take arbitrary measures that had no positive impact on patient outcome, and warned against taking this approach.
The Committee noted that although generic prescribing had been recommended by Hinchliffe (1960) in 1980 only 20% of prescriptions were written using the generic name. This was despite the following advantages: Indication of therapeutic
category; range of different drugs (versus different products of same drug); reduced range of stock for pharmacies; and greater economy. However, all this was subject to the resolution of GP reservations which included concerns of bio-availability, quality assurance, legal liability and product identification, and physical
appearance. The financial position of the industry was considered outside of their remit.
Overall they concluded that many GPs would not oppose the provision of generic products, particularly if this did not involve them engaging in changes in their
The Committee considered the introduction of a national limited list but felt that it could not be justified, giving the following reservations a) that it would represent an unacceptable challenge to clinical freedom on the part of the prescriber and b) that the cost of administration might out-weigh savings.
In summary, all three reports supported a move to generic prescribing. The Hinchliffe report favoured facilitative steps that would encourage GPs to be more critical of their prescribing behaviour, the Committee also set in motion
developments that would build the foundations for detailed prescribing feedback to each GP decades later. The Sainsbury report took a more centralised approach, with radical proposals to ban the patenting of brand names which were not
implemented, whilst the Greenfield proposals favoured an administrative approach that encouraged generics whilst maintaining the prescriber’s ultimate clinical freedom.
One factor that may offer some explanation for the failure to implement the more radical proposals that were put forward over the decades relates to the ’special relationship’ that exists in the United Kingdom the Government and the Drug Industry (Greenwood, 1991, personal correspondence). The large contribution of this industry to the country’s Balance of Payments and the powerful lobby
representing these commercial interests are very likely to have conspired against any serious attempts to make generic prescribing mandatory.
1.3 Government prescribing schemes
Following over three decades of ’steady-state’ on GPs clinical freedom to prescribe without constraint, the period between 1985 and 1990 saw the introduction of two pieces of legislation aimed at curbing this freedom. The first of these was the introduction of a limited list in 1985, and the second, the introduction of the Indicative Prescribing Scheme in 1990. The later would not however been possible if computerisation of prescription pricing recommended in the Tricker Report (DHSS, 1977) had not already been implemented and utilised to produce PACT data.
1.3.1 The Tricker Report
The Secretary of State for Social Services, commissioned Tricker to produce the
Report o f the Inquiry into the Prescription Pricing Authority (PPA) (DHSS, 1977).
The brief was to undertake a ’fundamental inquiry into the functions, organisation and constitution of the PPA’ and it was the identification of three substantial
benefits for those outside of the PPA that tipped the balance in favour of immediate computerisation of PPA functions; the benefits highlighted by Tricker related to the provision of information on dispensing activities, prescribing practice and drug usage. Tricker took evidence from many interested parties and as a result made some additional general observations on issues outside of his remit. Observations relating to the introduction of a limited list, the need for greater budgetary control, the provision of more timely feedback to GPs, and continuing education on drug use reflect gathering support for measures introduced many years later via the Limited List and Indicative Prescribing Scheme.
1.3.2 Limited List
of drugs was drawn up in 1985^ without formal consultation but a committee was subsequently set up to review additions and deletions and this continues to this day. This autocratic and non-voluntary control mechanism is estimated^ to have
produced savings of £100 million (Drugs and Therapeutics Bulletin, 1987a) however, the cost of list circumvention through the supplementation of more expensive non-restricted drugs, and prescribing of listed drugs by the component ingredients have never been quantified. A survey undertaken a year after the List’s introduction found that the most difficult task faced by GPs was persuading patients to accept alternative drugs in therapeutic areas where they themselves found it difficult to make a selection, and overall considerable patient resistance was noted (Drugs and Therapeutics Bulletin, 1987a).
1.3.3 The development o f PACT data
Computerisation of the PPA following the recommendations of the Tricker Report presented opportunities for utilising prescribing data for information, educational zmd audit purposes. From August 1988, information on prescribing was available for every prescriber at three, increasingly detailed, levels. The data was given the acronym PACT to denote Prescribing Analysis and Costs. Each quarter every prescriber was presented with details of their prescribing costs and volume in comparison with the FPC and the national averages (Level one). Level two provided individual product details drawn from six therapeutic groups. This was the first time that all GPs were equipped to undertake self or peer audit of their prescribing behaviour on a regular basis, although a study undertaken by Harris et al. (1984) had already shown that presentation of similar data to GPs to stimulate discussion could result in changes in prescribing frequency and cost. In 1990 a book was published and circulated to all GPs to provide ideas on, and stimulate
^ NHS (General medical and Pharmaceutical Services), Amendment to Regulations, Statutory Instrument 1985 (290).
^ Based on cost o f prescriptions in previous year for products included in limited list
interest in, prescribing audit using PACT data (Harris, Heywood and Clay den, 1990).
Although individual GPs received PACT data from 1988, aggregated data for FHSAs and Regions was not available until a year later, and details aggregated at practice level, the unit of greatest interest to prescribing advisers, was initially only made available to six FHSAs as a pilot. The pilot proved to be useful as it
highlighted the enormous volume of paperwork that advisers might expect to receive, and indicated the need to maintain some of the more traditional reporting formats (Department of Health, 1990, Improving Prescribing).
1.3.4 The Indicative Prescribing Scheme
Four Government publications between 1987 and 1990 provided the setting and details on the Indicative Prescribing Scheme (IPS). Promoting Better Health (Department of Health, 1987) and Working for Patients (Department of Health, 1989) were discussed in Section 1.2. Indicative Prescribing Budgets fo r GPs
(Department of Health, 1990) and Improving Prescribing (Department of Health, 1990) developed the prescribing themes in more detail and are now considered.
The IPS grew from the acceptance in 1987 of the need to improve prescribing practice, provide greater feedback to GPs on their prescribing patterns and encourage self-audit. However, by 1990, Working for Patients concentrated on managing the drug expenditure which was growing at about 4% above the national rate of inflation, and the budget which was the single largest element of the Family Practitioner Services Allocation. Formularies were proposed as a means of
establishing rational prescribing policies and economical prescribing was discussed in general terms, although generic prescribing was not specifically mentioned. A more detailed working paper followed.
Working Paper number four, entitled Indicative Prescribing Budgets fo r GPs
prescribing at practice level with the stated objective ’to place downward pressure on expenditure on drugs’. A pilot scheme was undertaken in 1990/91 prior to their introduction in 1991/92.
Supportive measures such as medical advice, better information and incentives were also introduced. Better prescribing information for GPs had been called for by Hinchliffe back in 1963. In 1989, a new information system assuming the
anachronism PACT - Prescribing Analysis and CosTs was introduced representing a major improvement in this respect. At the time of it’s introduction PACT was described as a tool for family doctors to use within self-audit; increasing the proportion of prescriptions written by the generic name was used as an example of such an audit (Harris, Heywood, and Clayden, 1990). PACT data is described further in Chapter Two.
Due to the wording of Working Paper four, the reader can be forgiven for concluding, erroneously, that the suggestion that GPs could increase self-audit of prescribing using new information systems, and in particular increase the
proportion of prescriptions written generically had previously been described in
Promoting Better Health. The representation therefore leads the reader to assume
that these suggestions are familiar and well accepted ideas, and by inference uncontentious.
One of the major weaknesses of the proposals was the explicit expectation that, with downward pressure, practice prescribing costs would gradually move towards the ’average’. This emphasis gave little consideration to the practice whose average costs concealed prescribing extremes that cancelled one another out. The proposed means of budget setting were crude, did not encompass quality issues and was poorly received by GPs and their representative bodies (Department of Health,
1990).
Improving Prescribing was published in 1990 after wide consultation on Working
Paper four and emphasised a quality as well as a cost effective approach to
prescribing. It described the Government’s philosophy for prescribing and
operational details of the IPS. The term ’prescribing amounts’ replaced ’prescribing budgets’ at practice level and GPs were given assurances that they would maintain their right to clinical and prescribing independence. The early emphasis on cost containment and sanctions, was balanced by much greater weight being given to quality and effectiveness, education and support. However, it was indicated that GPs would be expected to ’show proper regard’ for cost where medicines were equally effective, suggesting by default that GPs who did not prescribe generics when available might be considered wasteful. Reassurance was given of the quality standards applied by the Medicines Control Agency to generics, although a
different interpretation of their position may be formed from other summaries of their quality assurance procedures. The need to maintain branded prescribing for exceptional products was also recognised.
Generic prescribing was promoted as good professional practice and something to be promoted through educational initiatives. It was discussed within the remit of self-audit and research and the advantages recommended for promotion to GPs. It was acknowledged that the average generic prescribing rate at the national level concealed wide differences in the average between health regions, which in turn concealed even wider differences between averages measured at FHSA and practice level.
the generic rate in this way to set budgets or amounts was the first indication that it may become a prescribing performance indicator.
The provision of medical and pharmaceutical advice were dealt with separately. Amongst other things pharmaceutical advice was to be obtained and it was suggested that this might be usefully employed to reinforce confidence in generic products.
1.3.5 Performance indicators
Improving Prescribing (Department of Health, 1990) announced the formation of
the Leeds Prescribing Research Unit, whose remit would in part be to develop indicators showing the prescribing distribution that may be expected for a given therapeutic group in a defined population. In the absence of a definitive description of ’good prescribing’, medical advisers began to develop their own indicators of good practice, which they described as quality markers. Areas commonly targeted included ranges of commonly used antibiotics, musculoskeletal drugs and generics.
The Greenfield report on effective prescribing (Department of Health and Social Security, 1983) stated in it’s introduction that ’arbitrary measures’ (performance indicators) should be rejected if they were unrelated to patients needs. The generic prescribing rate reported within Prescribing Analysis and Costs data (PACT) was adopted as a performance measure within the essentially financial concept of the Indicative Prescribing Scheme. Unfortunately a weakness, inherent in the indicator, meant that the method of measuring the generic rate did not directly reflect cost savings at practice level, but prescribing behaviour. Consequently the generic rate only provides a measure of what has been described as good prescribing practice (Department of Health, 1990). Of particular concern is the fact that individual practices can increase their generic rate substantially without increasing the volume of generic products dispensed and consequently without generating any savings. This suggests that the generic indicator falls into the criteria so clearly rejected by the Greenfield Report.
From 1992/93 practice generic prescribing rates were specifically requested for inclusion on monitoring returns to the Regional Health Authorities. The Executive Letter giving guidance for the IPS for 1994/95 mentioned generic prescribing targets specifically as a key FHSA and District Health Authority objective (Department of Health, 1994).
1.3.6 Resources
Until 1989 little information was available on GP prescribing patterns. Annual prescribing statistics were produced by the Prescription Pricing Authority (PPA), and some trend analysis was published for prescribing at Family Practitioner Committee (FPC) and Regional level. Each quarter, FPCs received a summary of prescribing costs and ratios by doctor and practice. Referred to as ’PD2’ reports, this useful source of summarised information continued to be provided after the introduction of individual prescribing analysis.
Prior to 1989 the only detailed analysis of a doctors’ prescribing was undertaken by Regional Medical Officers, often in response to high expenditure patterns being detected in the PD2 report. Visits and audits were carried out, but these were few and far between. The only independent information sources on prescribing available to GPs were the Drugs and Therapeutics Bulletin (DTE), and the Prescribers’ Journal.
Prescribing Scheme and provide GP support through practice visits; and the Medical Advisors Support Centre (MASC). It was suggested that pharmaceutical advice may be obtained and that this might usefully be employed to reinforce confidence in generic products.
The concept of voluntary incentive schemes were also announced to enable non fund holding GPs to retain a proportion of any savings that they generated.
Originally a scheme was to apply to a whole FHSA, although this requirement was subsequently relaxed in favour of groups of practices. Savings had to be agreed in advance and realised from within the total indicative amounts set for participating practices. If the saving was achieved, then half would be available for expenditure on local projects agreed with the Local Medical Committee. However, the need to gain consensus across a wide practice base reduced its attraction and a number of refinements were required.
Despite significant improvements in prescribing information, this still did not facilitate easy selection of the specific information required to calculate savings derived from targeted activities. For example the volume of each drug product prescribed by the branded name, needed to determine savings from an increase in generic substitution, still had to be calculated manually for each practice or FHSA from level 3 PACT data. Since PACT level 3 lists number of prescriptions for each quantity prescribed, rather than total volume, this task was both extremely time consuming and tedious, and is further compounded by the very wide variations in quantities prescribed by different GPs. After substituting the cost of the equivalent generic to produce potential savings for one product the exercise needed to be repeated for each strength of each drug assessed. Furthermore, this daunting task was not significantly improved with computer technology, and once undertaken was rarely repeated, thereby making performance on savings targets difficult to gauge.
Increases in the generic rate, even at drug group level could only measure changes in prescribing behaviour, and could not be used to quantify savings on particular products. For example, the incentive scheme adopted in parts of North East
Thames Region for 1993/94 included a target of 5 % increase in the generic prescribing rate with a minimum of 40% for each practice by the year end. Although it is likely that such an approach would generate savings there is no indication of their potential magnitude. This is a significant weakness of hard copy PACT data, and in Chapter Two a way in which practices can reach generic targets without generating any savings is described.
The first Working Paper on prescribing budgets described the introduction of sanctions for excessive prescribing and also for GPs who exceeded their Indicative Budget (Department of Health, 1990). Improving Prescribing (Department of Health, 1990) added the requirement of FHSAs to provide ’clear evidence’ of excessive prescribing to invoke sanctions. In 1992, two and a half years after the introduction of the IPS, the NHSME published the procedure for dealing with excessive prescribing (Department of Health, 1992). The procedure applied to individual doctors and not to practices and required considerable time and effort to undertake successfully. On balance it was unlikely that sanctions would be used as a lever to increase the generic prescribing rate.
1.4 The development of generic prescribing in general practice
Prescribing by the generic or approved name is not a new phenomenon. Prior to the discovery of penicillin many medicines were identified and prescribed by their medicinal components and such products often became known by the name of their inventor. The marketing of medicines by proprietary or brand name did not become popular until after the second world war when innovation by the pharmaceutical industry and large scale manufacturing increased sharply. Brand names were seen as the key to securing prescribing loyalty.
1.4.1 Changes in generic prescribing rates
24% of prescribing costs (NIC). Ten years later, the Hinchliffe report (Ministry of Health, 1959), noted that this figure had risen to 48% of items, accounting for 70% of prescribing costs (NIC), and by 1983, the proportion of costs (NIC) for branded products had risen to 95% (Department of Health, 1994). Conversely, the proportion of prescriptions written by the generic name (class one and class two) had been declining since the formation of the NHS, and it was not until the
introduction of the Limited List in 1985 that it began to rise. Such was the effect of the Limited List that the generic rate rose by 12% in the first year (from 23% to 35%), with the proportion of class one drugs (those prescribed and dispensed as generic) rising from 18% to 26%. Since then the overall generic prescribing rate (class one and class two prescriptions) has continued to rise steadily to 47 % in 1993, whilst the proportion of class one prescriptions has only increased by 4% between 1987 and 1993 (to 38%). This smaller rise suggests that the rate of change in prescribing behaviour for class one products is reaching a plateau and that the major contribution to continued increases in the generic prescribing rate is derived from drugs which have no generic equivalent.
1.4.2 Responses to reporting the generic prescribing rate
The changes in the prescribing environment described in ’Improving Prescribing’ coincides with a national generic rate increase of 10% in less than four years. Four percent of this change occurred between March 1993 and March 1994 when the national level reached 50%. PACT data was designed to encourage comparison with others, but presented to encourage comparison with the local ’average’. It is therefore highly likely that the reporting of practice generic rates against the FHSA average was perceived by many to suggest that practices with lower than average rates should increase them. Over this same period the average generic rate for FHSAs increased at varying rates. Factors that may have contributed to this variation include local differences in baselines, priority attributed to promoting generics and resources available for prescribing intervention.
1.5 Discussion and Conclusions
The reviews and reforms outlined above illustrate a long standing awareness of the cost burden of prescribing medicines on the health service as well as a reticence to introduce restrictions on prescribing and/or clinical freedom. Although talked about for many years, the eventual introduction of a limited prescribing list in 1985 took many, including the drug industry, by surprise. The scheme demonstrated
substantial one-off savings by encouraging more generic prescribing, but may have been diluted to some extent through switches to more expensive, instead of cheaper alternatives as was intended.
The reforms introduced in 'Working fo r Patients* (Department of Health, 1989) have served to focus the activity of those concerned with prescribing on a number of key targets. As a result, the generic prescribing rate has become a targeted measure of prescribing performance and, as with most performance measures, it has its limitations in this respect.
Although some central support is provided for those charged with monitoring and influencing prescribing within FHSAs, there is a strong tendency to undertake activity in areas where performance targets have been set nationally. This sequence of events favours short term gains and has a tendency to remove the focus from systematic review of existing knowledge. However, such knowledge could inform the planning and development of long term strategies to influence prescribing behaviour and hence make more effective use of limited resources.
Weaknesses and limitations in any performance indicator are important
CHAPTER 2
MEASURES AND PATTERNS OF PRESCRIBING BEHAVIOUR
Summary
After describing the general measures that are employed in PACT data to measure prescribing activity, this chapter focuses specifically on those relating to generic prescribing activity. The derivation of the measure for generic prescribing rate is considered in detail, as are its weaknesses and limitations as an economic
performance indicator. Historical and recent generic prescribing trends in general practice as well as studies described in the literature are reviewed to provide a background to generic prescribing behaviour over the last decade, and in particular the relationship with government initiatives.
2.1 Prescribing analysis and costs - PACT data
Prescribing data is collated and published by the Prescription Pricing Authority (PPA) from the information extracted from prescriptions submitted by pharmacists for pricing and payment purposes. Using the PPA’s computerised data processing facility work began in 1987 on using the information to provide regular and comprehensive feedback to GPs on their prescribing behaviour and costs. The resulting format, known as Prescribing Analysis and CosTs or PACT data, was piloted in 1988 and released to GPs in England in 1989.
The British National Formulary (BNF) classification (e.g. BNP, March 1995) is the index used to collate PACT data. Drugs which have diverse therapeutic uses and are included in several BNF chapters are assigned to one category. This is a logical approach for a database that does not link prescription with diagnosis and patient details. Although PACT is presented in chapter order, detailed information on specific sections, sub-sections and drugs are selected on the basis of cost.
The cost used is the Net Ingredient Cost (NIC), set by the Government and published monthly in the Drug Tariff (e.g. Drug Tariff, April 1995) and excludes the costs of dispensing, which can vary slightly according to where it is dispensed. The NIC is used to compare prescribing costs between practices using a
demographically weighted representation of the practice list, the prescribing unit (see below).
Between 1990 and 1994 PACT was presented to GPs and FHSAs at three
increasingly detailed levels (appendices 1 to 3). Level one provided a summary of total practice costs and number of prescriptions (items) compared with the FHSA average, together with similar information for the six, nationally, most expensive BNF chapters. Level two provided information for all BNF chapters, and included selected products from the six chapters identified in level one. Practices or
individual GPs with total costs of over 25 % above the FHSA average or over 75 %
above the FHSA average in any one of the six chapters automatically received level
two reports, although these were also available on request. From August 1994 level one was dropped and level two redesigned so that all practices received the same basic information (appendix 4).
Level three continues to provide a summary of the cost and volume of every prescription dispensed by product, according to the BNF classification and is available on request for individual doctors, practices, and FHSAs.
PACT data provided, for the first time, an opportunity for FPCs/FHSAs to review recent prescribing activities and study differences in prescribing patterns between GPs. With a lead time of only three months, it provided relatively fast feedback to GPs on aspects of their prescribing behaviour and associated costs.
2.1.1 Prescribing Units
A number of other practice measures were incorporated into PACT data to facilitate inter-practice comparisons. The most important of these, the prescribing unit (PU), is a weighted representation of list size accounting for demographic differences between practices. A weighting of 3 was adopted within PACT for all patients over 65 years to convert to PU’s which were then used as a denominator to compare prescribing costs between practices of different sizes (NIC/PU).
from that of the practice location. This situation, known as cross boundary flow, is exacerbated further where a practice’s catchment area covers two or three FHSA areas.
2.1.2 Number o f items
The number of items prescribed is used as a practice measure to compare prescribing costs and activity in PACT data (cost per item, and items per
prescribing unit). The number of items represents the number of individual drugs prescribed and dispensed and is sensitive to the duration over which the
prescription is written. Since different GPs prescribe the same drug for different durations the measure is not directly comparable between doctors or practices. This can be demonstrated as follows: GP ’A’ writes a prescription for one month’s treatment of atenolol lOOmg tablets once a day, and this is repeated for two further months. In this case three prescriptions (items) generate 84 tablets. GP ’B’ writes one prescription for atenolol lOOmg once a day for three months. In this case one prescription (item) generates 84 tablets. So whilst both GPs have prescribed the same amount of drug, at the same net ingredient cost (NIC), PACT data will have recorded three items for GP ’A’, and one item for GP B’ and the cost per item will be three times less for GP ’A’ than for GP ’B’. The item is therefore a poor inter-practice comparator, unless differences in prescribing quantities are known, and remain stable for each prescriber over the period used for comparison.
2.1.3 The generic rate
PACT Level one originally compared the practice and FHSA generic prescribing rate. When it was discontinued, the rates were then included in the new Level two reports. Generic rates continued to be listed quarterly for all practices in the summary prescribing statistics known as PD2 reports which pre-dated PACT data. Although Level three provides a complete listing of drugs dispensed by quantity, frequency and total cost, the total volume and cost of prescriptions for individual products is not included. This presents a problem for FHSAs wishing to use the
2.2 Weaknesses of the generic rate as a performance indicator
PACT data was developed in 1988 to provide GPs with feedback on their
prescribing behaviour, but it was subsequently suggested by Harris, Heywood and Clayden (1990), that the data alone were poor indicators of prescribing
performance. Shortly after the introduction of PACT to general practitioners in England, FHSAs were required to report to the Regional Health Authority a
number of prescribing indicators from PACT data including the generic prescribing rate, despite the very limited amount known about their relationship with
prescribing outcome, and some of the limitations demonstrated in section 2.1. The generic prescribing rate recorded in PACT data until 1994 measured the percentage of items prescribed by the generic name and reflects prescribing
behaviour. This measure includes both branded products that are still under patent (but have been prescribed by their generic name), as well as products no longer under patent that may be available in generic form. Data for these two groups is also collected separately; for the purposes of Department of Health’s Prescription Cost Analysis system products prescribed and dispensed by the generic name are classified as Class One products, whilst products prescribed by the generic name but only available under patent (and therefore dispensed as branded) are classified as Class Two products (Department of Health, 1991). Whilst the respective prescribing rates for Class One and Class Two products have been available for
many years only Class One products were presented in PACT data until 1994.
Between 1991 and 1993, the proportion of generic prescriptions rose from 41% to 47%. In 1993, the proportion of class two drugs alone rose by 3% (to 9%), accounting for a rise of 8% in total NIC (to 21%). However, whilst the generic rate for the much larger proportion of class one drugs also rose by 3% (to 38%) this accounted for a reduced proportion of the total NIC than before (14% to 12%) (Department of Health, 1994). This example demonstrates that the relationship between generic rate and economic performance is not the straight forward one that is sometimes suggested and that it is in fact quite complex.
2.2.1 Behavioural measure o f generic prescribing
Although the generic rate is an accurate measure of prescribing behaviour as shown above it does not measure cost effectiveness and should not be considered as a performance indicator of the latter. The extent to which it is unsuitable in this respect is demonstrated in more detail by consideration of ways in which
prescribing behaviour can unintentionally or intentionally cause increases in generic rate without increasing the amount of generic dispensing or cost effectiveness of prescribing. Changes in prescribing patterns that produce this effect occur when there is an increase in the proportion of prescriptions are written for class two drugs using the generic name in preference to the branded name. In this way a practice could potentially have a generic rate of over 60% with only a very small proportion of prescriptions being dispensed as generic products. For example a small number of frequently prescribed patented drugs can be prescribed using the generic name in preference to the branded name and the practice generic rate will increase.
The manipulation of generic prescribing rates in this way is not easy to detect amongst practices except through the manual scrutiny of individual practice data. The potential to manipulate the rate challenges the assumption that all practices with high generic rates are cost conscious, or cost effective. The lack of a