University of Pennsylvania
ScholarlyCommons
Publicly Accessible Penn Dissertations
Spring 5-16-2011
Examining the Coupling of the Mechanical and
Chemical Functions of Myosin Family Members
Using Single Molecule and Bulk Solution
Techniques
John H. Lewis
University of Pennsylvania, [email protected]
Follow this and additional works at:http://repository.upenn.edu/edissertations Part of theBiophysics Commons
This paper is posted at ScholarlyCommons.http://repository.upenn.edu/edissertations/1548
For more information, please [email protected].
Recommended Citation
Lewis, John H., "Examining the Coupling of the Mechanical and Chemical Functions of Myosin Family Members Using Single Molecule and Bulk Solution Techniques" (2011).Publicly Accessible Penn Dissertations. 1548.
Examining the Coupling of the Mechanical and Chemical Functions of
Myosin Family Members Using Single Molecule and Bulk Solution
Techniques
Abstract
Myosins are actin-activated ATPases that convert the chemical energy stored in ATP into the mechanical swing of its lever-arm. The members of the myosin family exhibit a wide range of cellular functions. Myosin Ib (myo1b) is single-headed and may link the cell membrane to the actin network acting as a tension sensor; while myosin V (myoV) is double-headed and can act as a cargo transporter in cells. The very different functions of myo1b and myoV arise from differences in their chemical and mechanical activities. We examined the chemomechanical properties of myo1b using stopped flow and optical trap experiments, from which were determined mechanical step sizes and kinetic rates associated with the chemomechanical steps of the myo1b crossbridge cycle. Most importantly, we found that the rates are slow and the rate associated with ADP release during actin attachment is greatly decreased by force, which could allow it to act as a tension sensor. These kinetic rates and force sensitivity of myo1b are strongly regulated by the signaling molecule, calcium. MyoV steps along actin in a complex and dense cellular environment; how this is done can be understood from its intrinsic stepping behavior as measured from the changes in lever-arm conformation as it steps along actin using single molecule techniques and a novel analytic tool I developed. From this we find that myoV mainly walks straight along actin, but can take steps around the long axis of actin. The frequency of these azimuthal steps depends on the length of the myoV lever-arm.
Degree Type
Dissertation
Degree Name
Doctor of Philosophy (PhD)
Graduate Group
Cell & Molecular Biology
First Advisor
Yale E. Goldman
Second Advisor
E. Michael Ostap
Keywords
Myosin I, Myosin V, calcium regulation, structure, force dependence
Subject Categories
Biophysics
EXAMINING THE COUPLING OF THE MECHANICAL AND CHEMICAL
FUNCTIONS OF MYOSIN FAMILY MEMBERS USING SINGLE MOLECULE AND
BULK SOLUTION TECHNIQUES
John H. Lewis
A DISSERTATION
in
Cell and Molecular Biology
Presented to the Faculties of the University of Pennsylvania
in
Partial Fulfillment of the Requirements for the
Degree of Doctor of Philosophy
2011
Supervisor of Dissertation Co-Supervisor
_________________ _________________
Yale E. Goldman E. Michael Ostap
Professor of Physiology Professor of Physiology
Graduate Group Chairperson
_________________
Dan Kessler, Associate Professor of Cell and Developmental Biology
Dissertation Committee
Erika L. F. Holzbaur, Professor of Physiology
John W. Weisel, Professor of Cell and Developmental Biology Paul A. Janmey, Professor of Physiology
EXAMINING THE COUPLING OF THE MECHANICAL AND CHEMICAL
FUNCTIONS OF MYOSIN FAMILY MEMBERS USING SINGLE MOLECULE AND
BULK SOLUTION TECHNIQUES
©
2011
iii
Acknowledgements
My time as a graduate student at the University of Pennsylvania has far exceeded
my expectations, and I am deeply grateful for the opportunity to study here. I particularly
want to thank my advisors Drs. Yale E. Goldman and E. Michael Ostap for sharing their
vast knowledge and experience so as to guide me to be a better scientist. Between them
and their labs I‟ve been exposed to a large number of scientific disciplines such as
physics, chemistry, engineering, and of course cell biology. As a result, I am able to
better understand the results of my experiments by putting them into a broad,
multi-disciplinary context. The members of my thesis committee, Drs. Paul Janmey, Erika
Holzbaur, Phil Nelson and John Weisel, have given me much good advice and
encouragement over the years that helped me to better navigate the graduate process. I
want to thank Dr. Henry Shuman for his inspiration and physical insight. In my first
rotation, Dr. Steve Baylor gave me careful and patient instruction in kinetic modeling that
has been the foundation for many of my analyses and has helped me a great deal. I also
want to thank Dr. Zhe Lu, a professor in the Physiology department, for his unswerving
support throughout my scientific career. Finally, I am beholden to Dr. Roderick
MacKinnon of Rockefeller University for giving me my start in science as a technician;
he was incredibly generous with his time and experience, and the lessons I learned from
him and the members of his lab I carry with me to this day.
I have benefited greatly from the high quality and good humor of the members of
Yale‟s and Mike‟s labs. Joe Laakso is a former graduate student of Mike‟s and a deft
iv
Talks on physical principles with John Beausang and Serapion Pyrpassopoulos have
helped me immeasurably in understanding and analyzing often complicated
single-molecule experiments. Yujie Sun, a former post-doc in Yale‟s lab, helped me with my
initial experiments when I was starting in Yale‟s lab, and was a continual source of good
insights.
Members of my family have been the source of a large amount of support and
encouragement, in particular my parents Alice Muehlhof and Clifford Lewis as well as
my step-parents Robert Muehlhof and Christine Lewis. I also want to thank my brothers,
Tom Lewis, Rick Washburn and Jim Washburn and their families. Most of all, I want to
thank my wife Hyeon-Gyu (Marianne) Shin for her inspiration and love that has given me
strength throughout the graduate student process. I also want to thank Ben Price and
v ABSTRACT
EXAMINING THE COUPLING OF THE MECHANICAL AND CHEMICAL
FUNCTIONS OF MYOSIN FAMILY MEMBERS USING SINGLE MOLECULE AND
BULK SOLUTION TECHNIQUES
John H. Lewis
Supervisors: Dr. Yale E. Goldman and Dr. E. Michael Ostap
Myosins are actin-activated ATPases that convert the chemical energy stored in
ATP into the mechanical swing of its lever-arm. The members of the myosin family
exhibit a wide range of cellular functions. Myosin Ib (myo1b) is single-headed and may
link the cell membrane to the actin network acting as a tension sensor; while myosin V
(myoV) is double-headed and can act as a cargo transporter in cells. The very different
functions of myo1b and myoV arise from differences in their chemical and mechanical
activities. We examined the chemomechanical properties of myo1b using stopped flow
and optical trap experiments, from which were determined mechanical step sizes and
kinetic rates associated with the chemomechanical steps of the myo1b crossbridge cycle.
Most importantly, we found that the rates are slow and the rate associated with ADP
release during actin attachment is greatly decreased by force, which could allow it to act
as a tension sensor. These kinetic rates and force sensitivity of myo1b are strongly
vi
dense cellular environment; how this is done can be understood from its intrinsic stepping
behavior as measured from the changes in lever-arm conformation as it steps along actin
using single molecule techniques and a novel analytic tool I developed. From this we
find that myoV mainly walks straight along actin, but can take steps around the long axis
of actin. The frequency of these azimuthal steps depends on the length of the myoV
vii
Table of Contents
1 Introduction ... 1
1.1 The Myosin Family ... 1
1.2 The Crossbridge Cycle and the Structural Basis of Myosin Function ... 3
1.3 The Power stroke of Myosin (The Swinging Lever-arm Hypothesis) ... 4
1.4 Thesis Objective ... 5
1.5 Thesis Overview ... 8
2 Characterization and Regulation of the Chemomechanical Activity of Myosin Ib .. 10
2.1 Introduction ... 11
2.1.1 Temperature dependence of nucleotide association and kinetic characterization of myo1b... 11
2.1.2 Myosin I can act as a molecular force sensor ... 13
2.1.3 Dependence of effective lever-arm length on the mechanical activity of isoforms of myosin Ib ... 14
2.1.4 Calcium regulation of the chemomechanical activity of myosin Ib ... 15
2.2 MATERIALS AND METHODS ... 17
2.2.1 Reagents, Proteins, and Buffers ... 17
2.2.2 Myosin-I Expression and Purification ... 18
viii
2.2.4 Bead and Motility Chamber Preparation ... 21
2.2.5 Single Molecule Measurements ... 22
2.2.6 Event Selections ... 23
2.2.7 Distributions from Single Molecule Events Fit Using a Maximum
Likelihood Routine ... 24
2.3 RESULTS... 25
2.3.1 Temperature dependence of nucleotide association and kinetic
characterization of myo1b... 25
2.3.2 Myosin I can act as a molecular force sensor ... 38
2.3.3 Dependence of effective lever-arm length on the mechanical activity of isoforms of myosin Ib ... 40
2.3.4 Calcium Regulation of the Chemomechanical Activity of Myosin Ib ... 44
2.4 DISCUSSION ... 61
2.4.1 Temperature dependence of nucleotide association and kinetic
characterization of myo1b... 61
2.4.2 Myosin I can act as a molecular force sensor ... 66
2.4.3 Dependence of effective lever-arm length on the mechanical activity of isoforms of myosin Ib ... 68
2.4.4 Calcium regulation of the chemomechanical activity of myosin Ib ... 70
ix
3.1 Introduction ... 74
3.2 Materials and Methods ... 78
3.2.1 Preparation of Proteins ... 78
3.2.2 Buffers... 78
3.2.3 Experimental Apparatus... 79
3.2.4 Single-Molecule Motility Assay ... 81
3.2.5 Data Selection for single molecule motility assays ... 82
3.2.6 Actin Twirling Assay ... 82
3.2.7 Theory and analysis for transforming probe angles to lever angles ... 83
3.3 Results ... 96
3.3.1 Myosin V constructs myoV-6IQ and myoV-4IQ ... 96
3.3.2 3-Dimensional orientation of Myosin V during single molecule processive motility ………..96
3.3.3 βP and αP distributions for myoV-6IQ and myoV-4IQ are similar ... 99
3.3.4 2ΔαP distributions for myoV-6IQ and myoV-4IQ ... 103
3.3.5 Multiple sub-populations in the distributions of θP vs. φP for myoV-6IQ and myoV-4IQ ... 104
3.3.6 ΔαL distributions for myoV-6IQ and -4IQ ... 107
3.3.7 Twirling of Actin in Gliding Assays with Myosin V-6IQ and -4IQ... 109
x
3.4.1 MyoV-4IQ has more frequent non-zero changes in αL than myoV-6IQ . 113
3.4.2 Sub-populations in the distributions of θP vs. φP ... 115
3.4.3 Comparing θP and φP values calculated from polTIRF data and myoV molecular model... 116
3.4.4 Conclusion ... 120
4 Global Discussion ... 123
5 Appendix ... 130
5.1 Program for Optimization of a Maximum Likelihood Estimator ... 130
5.1.1 Maximum Likelihood Estimator (MLE) ... 130
5.1.2 Optimization of a MLE Model Using a Modified Nelson-Mead Downhill Simplex method ... 132
5.1.3 Confidence Intervals are Determined by Using Bootstrap Monte Carlo Simulations ... 135
5.1.4 General Simplex Fit model fitting program ... 137
5.2 Model for Myosin Detachment from Actin Through a Force-dependent or – independent Pathway ... 144
5.3 Calcium Binding Rate Equations and Derivations ... 147
5.3.1 Calcium binding to nucleotide-free myo1bIQ ... 147
5.3.2 Calcium binding to myo1bIQ undergoing phosphate release ... 150
5.3.3 Calcium-dependent steady state ATPase rate of myo1bIQ ... 152
xi
5.4 Derivations of Equations for Transforming the Orientation of the Probe to that of the Lever-arm ... 158
5.4.1 Derivation of Expression for the Orientation of the Probe Relative to Actin (αP, βP) as a Function of the Lever-arm Orientation (αL, βL) and Probe Orientation
Relative to the Lever-arm Frame (θP, φP) ... 158
5.4.2 Derivation of Expression for Lever-arm Orientation Relative to Actin (αL,
βL) as a Function of the Probe Orientation Relative to Actin (αP, βP) and Relative to
the Lever-arm (θP, φP). ... 163
5.4.3 Derivation of Expression for the Probe Orientation Relative to the Lever (θP, φP) as a Function of the Probe (αP, βP) and Lever (αL, βL) Orientations Relative
to Actin 166
5.4.4 Relationship establishing equality between 2ΔαP and 2ΔαL ... 168
5.4.5 Reconstructing the Relative αL Path Using the Identity 2ΔαP = 2ΔαL ... 172
5.4.6 Rationale for the Routine that Calculates the Orientation of the Probe Relative to the Lever-arm (θP, φP) for Individual Processive Runs ... 176
xii
List of Tables
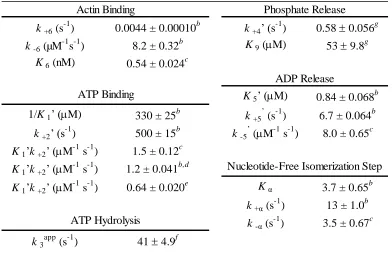
Table 2.1- Rate and Equilibrium Constants for the Myo1b ATPase Cycle at 37 °C. ... 26
Table 2.2 - Temperature Dependence of ATP Binding and ADP Release ... 31
Table 2.3 - Thermodynamic Parameters for ATP Binding, ADP Release, and k+α ... 31
Table 2.4 - Rate and Equilibrium Constants for the Myo1bIQ ATPase Cycle in the Presence and Absence of Calcium at 37°C... 46
Table 2.5 - Calcium dependence of mechanics of Myo1ba and Myo1bIQ at room
temperature ... 51
Table 2.6 - Calcium Dependence of Steps in the Myo1bIQ ATPase Cycle at 37°C. ... 53
Table 2.7 - p-values from Kolmogorov-Smirnov 2 distriubtion test, testing the hypothesis that distributions are from different parent distribution... 53
Table 3.1 - Analysis of the distributions of α and β angles for MyoV6IQ and 4IQ in the
Probe frame of reference ... 100
Table 3.2 - Analysis of the θP vs. φP distributions calculated from the processive runs of MyoV-6IQ and -4IQ ... 107
Table 3.3 - Analysis of the distributions of α and β angles for MyoV6IQ and 4IQ in the
Lever Arm frame of reference ... 108
Table 3.4 - Parameters from myosin V molecular model and myoV-6IQ polTIRF data 118
xiii
List of Figures
Figure 1.1 –General myosin structure ... 2
Figure 1.2 – Myosin crossbridge cycle ... 3
Figure 2.1 – Myosin Ib (myo1b) isoforms used in this study ... 15
Figure 2.2 - Kinetics of myo1bIQ association with actin filaments. ... 27
Figure 2.3 - Temperature dependence of ATP binding to actomyo1bIQ. ... 27
Figure 2.4 - MgATP induced population of weakly bound actomyo1bIQ states. ... 28
Figure 2.5 - Temperature dependence of ATP binding and ADP release... 30
Figure 2.6 - Rate of ATP hydrolysis by myo1bIQ as measured by mantATP fluorescence. ... 33
Figure 2.7 - Steady-state ATPase rate and phosphate release from myo1bIQ ... 35
Figure 2.8 - ADP release from actomyo1bIQ. ... 37
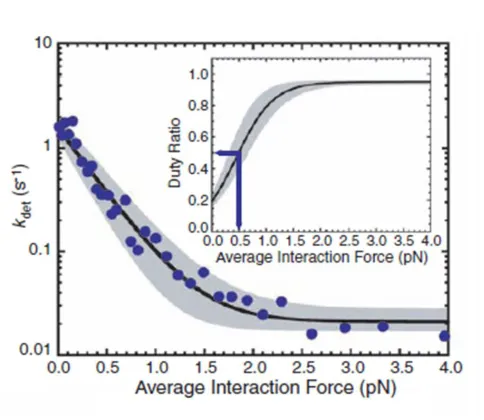
Figure 2.9 – Low levels of force lead to drastic decrease in rate of actin detachment for myo1b ... 40
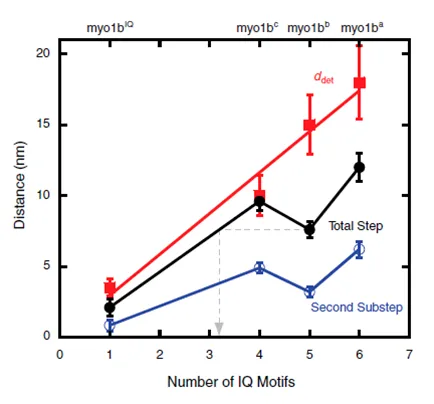
Figure 2.10 – Force dependence as measured by distance parameter (d) is directly related to the length of the lever arm of myo1b ... 42
Figure 2.11 – Isoform dependence of myo1b force sensing ... 43
Figure 2.12 - The Steady State ATPase Rates for Myosin-1b are Highly Sensitive to Calcium Concentration. ... 44
xiv
Figure 2.15 - Calcium Dependence of the Step-Sizes (center) and Lifetimes of Attachment (bottom) for Myo1bIQ (left) and Myo1ba (right)... 49
Figure 2.16 – Calcium-dependence of the durations of actin attachment for myo1bIQ (left) and myo1ba (right). ... 50
Figure 2.17 - The Motility rates for myosin-1b are highly sensitive to calcium
concentration. ... 54
Figure 2.18 – Calcium-dependence of the step-sizes for myo1bIQ (left) and myo1ba
(right). ... 55
Figure 2.19 – Calcium-dependence of the force sensitivity of Myo1ba as measured by its distance parameter, d... 57
Figure 2.20 – The calcium-dependent increase in the intrinsic tryptophan fluorescence of Myo1bIQ is rapid. ... 58
Figure 2.21 - Calcium-dependent increase in the ADP Release Rate k+5’ for myo1bIQ is rapid. ... 60
Figure 2.23 – Model of calcium binding affecting tension sensing of myo1b. ... 71
Figure 3.1 - Experimental Setup for polTIRF Microscopy. ... 79
Figure 3.2 – Myosin V Domain Map and Schematics of Relevant Frames of Reference. 84
Figure 3.3 – Rotation Scheme. ... 88
Figure 3.4 – Schematic describing two unique lever configurations related to different βL solutions. ... 93
Figure 3.5 – Principal degeneracy in lever solutions ... 95
Figure 3.6 -Representative traces from the processive runs of single motors of
xv
Figure 3.7 – Distributions for βP, βL and αP, αL for myoV-6IQ12 and -4IQ12. ... 99
Figure 3.8 – Distributions for α and β probe and lever for myoV 6IQ16 with probe solution isolated to a hemisphere of space. ... 101
Figure 3.9 – Distributions for ΔαP for myoV-6IQ12, -6IQ16 and -4IQ12. ... 102
Figure 3.10 – Distributions for 2ΔβP myoV-6IQ12, -6IQ16 and -4IQ12. ... 102
Figure 3.11 – Distributions for 2ΔαP and ΔαL for myoV-6IQ12 and -4IQ12. ... 103
Figure 3.12 – Distribution of 2ΔαP and ΔαL for myoV-6IQ16 with probe solution isolated to a hemisphere of space. ... 104
Figure 3.13 – Distributions for θP vs. φP for myoV-6IQ12 and -4IQ12. ... 105
Figure 3.14 – Plot of θP vs. φP for myoV-6IQ16. ... 106
Figure 3.15 – Experimental design for twirling experiment. ... 109
Figure 3.16 - Representative traces from rhodamine-labeled actin filaments twirling over either myoV-6IQ16 (left) or -4IQ16 (right). ... 110
Figure 3.17 – Inverse pitch (um-1) distributions for myoV-6IQ16 and -4IQ16. ... 111
Figure 3.18 – θ and φ values calculated from myoV model vs. those calculated from myoV-6IQ12 and -4IQ12. ... 117
Figure 5.1 – Program Flow Chart for Downhill Simplex/Annealing Optimization Routine ... 134
Figure 5.2 – Calculating the confidence interval ... 136
Figure 5.3 – Front panel of General Simplex Fit program ... 138
Figure 5.4 – Back panel of General Simplex Fit program ... 142
xvi
List of Main Equations Used
2.2.1 – Arrhenius Equation ... 20
2.2.2 - van„t Hoff Equation ... 20
2.3.3 – Force Dependent Rate Equation ... 38
5.1.3 - Likelihood Function ... 131
5.1.5 - Log Likelihood Function ... 131
5.2.4 – Bell Equation ... 140
5.4.10 - βp equation ... 162
5.4.12 - αP equation ... 163
5.4.18 - βL equation ... 164
5.4.22 - αL equation ... 165
5.4.26 - φP Equation ... 166
5.4.32 - θP Equation ... 168
1
1
Introduction
1.1
The Myosin Family
Members of the myosin superfamily characterized thus far have been found to be
actin-dependent ATPases that utilize the energy of hydrolysis of one ATP molecule per
catalytic cycle to generate or maintain force. This force causes the myosin to step
unidirectionally along actin where all myosins that have been tested (except myosin VI;
1) move towards the barbed-end of actin (2). Myosin II is the conventional myosin best known for the role it plays in muscle. There are, however, at least 30 other members of
the myosin superfamily referred to as unconventional myosins, which are found in most
cell types (2). These unconventional myosins differ in their structure and in the various roles they play, from cargo transport to mediation of tension (2). Elucidating further the mechanisms of the extraordinary variety of functions these myosins can perform is
currently the subject of intense research.
Myosin I (myoI) and myosin V (myoV) are unconventional myosins that, in the
different roles they are known to play, present themselves as paradigms for the functions
of many of the other unconventional myosins. For example, myosin Ic, a type of myosin
I, is believed to mediate tension during the adaptation response in the hair cells found in
the inner ear (3,4,5,6). However, the same myosin has a very different role in the adipocyte, where it is thought to transport vesicles containing GLUT4 (a glucose
2
Understanding how the structures and the underlying kinetic and mechanical activities of
different myosins, like myosin I and myosin V, are tuned to function in various cellular
processes will inform us of the general principles that govern the functions of all myosin
family members.
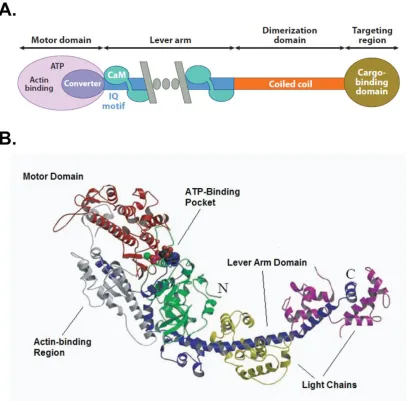
Figure 1.1 –General myosin structure
A. Generic domain map for myosin family members. Adapted from ( 11). B.
3
1.2
The Crossbridge Cycle and the Structural Basis of Myosin
Function
Given the functional diversity of myosin family members, it is remarkable how
such a wide range of functions arise from a family that, structurally, is relatively
homogenous. The sequences of every myosin family member have a well conserved
motor domain to which is attached a lever arm domain, followed by a tail region that can
vary greatly depending on the myosin (Figure 1.1A; 10, 11). The structures of myosin I and myosin V have both been confirmed to possess these general elements. The
N-terminal motor domain is the catalytic domain of myosin, with an ATP binding region,
where ATP hydrolysis occurs, as well as a region for binding actin. At the C-terminal end
of this domain is the lever arm domain, which is a long alpha helix that varies in its
length and in the nature of the light chains that bind to it, depending on the type of
myosin. The practical length of the lever arm is usually defined by the number of light
chain binding motifs, termed IQ motifs, it contains (10). After the lever arm is the C-
Figure 1.2 – Myosin crossbridge cycle
4
terminal tail region of myosin, which can possess a variety of cargo binding, and
sometimes dimerization, motifs (10). One function of this region in some myosin Is is to allow it to bind to negatively charged phospholipids such as PIP2 (12), in the plasma membrane (6).
The conformation of the structure of a myosin family member changes as it
progresses through the steps of ATP hydrolysis in a process referred to as the
crossbridge, or ATPase, cycle, as described by Lymn and Taylor (Figure 1.2) (13). The conformations of the motor and lever arm domains are most affected, where the lever arm
changes by rotating about a fulcrum believed to be located in the motor domain (14, 15). In its present form, the primary cycle begins with the myosin strongly attached to actin in
a nucleotide free state called the rigor state (Figure 1.2). Upon binding ATP, the myosin enters a weakly bound state, where it is either unbound or loosely associated with the
actin. Once dissociated, the lever arm undergoes a large swing relative to the motor
domain (~60° in myosin II) and the ATP is hydrolyzed; myosin is now in its pre-power
stroke conformation, with ADP and inorganic phosphate (Pi) bound. Myosin then weakly
binds to actin, releases the inorganic phosphate (Pi) and undergoes its power stroke.
1.3
The Power Stroke of Myosin (The Swinging Lever-arm
Hypothesis)
The power stroke has been found to occur in one or two phases, depending on the
myosin family member, and leads to net movement. In myosins with a two phase power
5
(Figure 1.2). The second phase is believed to be coupled to ADP release. In this phase, myo1c is in the rigor state and is able to bind ATP again in order to repeat the cycle. The
rate constants associated with each of these steps in the cycle can be very different
depending on the myosin type and are important in determining the lifetimes for the weak
and strong binding states (16).
The power stroke is believed to be caused by a conformational change of the
lever-arm domain relative to the motor domain, a concept known as the swinging lever
arm hypothesis (17). The degree to which the arm swing and the length of the lever-arm itself are the major determinants for the amount of movement a myosin can undergo
during the power stroke. In the cell, it is not unusual for the lever-arm to be under load
during the power stroke (as caused by dimerization, cargo binding, being part of a
filament, or any combination of these). It is therefore not surprising that the mechanics of
the power stroke of various myosin types have been found to be load-sensitive, including
myosin I and myosin V (18,19). It was recently shown through single molecule studies that load affects myosin I and myosin V by affecting their attachment lifetimes (18,19), where this lifetime is increased or decreased depending on the directionality and
magnitude of the applied force.
1.4
Thesis Objective
Myosin Is are expressed in all cell types and have been implicated in a number of
cellular processes including membrane retraction, macropinocytosis, phagocytosis,
6
(20,21,4,22,23,24,25). The proposed mechanism that could link these diverse functions together is that myosin Is act to cross-link actin with the cellular membrane. Biochemical
studies have shown that some myosin Is have an exceptionally long strong actin binding
lifetime (although it still makes up a small fraction of the very long ATPase cycle time,
see 16). This long strong actin-binding lifetime is consistent with myosin I acting as a tether between actin and the membrane. Load sensitivities as have been seen with myosin
Ib from our group (19, 26) and myosin Ic (5) suggest that myosin I acts a tension sensor in its linkage between the actin network and the cellular membrane.
Before a more detailed mechanism for its action in the cell can be determined,
there are many basic questions about myosin I that need to be addressed: (1) Basic
biochemical parameters of the myosin I ATPase cycle have never been measured at
physiological temperatures (37 °C). Are these parameters significantly different from
those measured at room temperature, and does the temperature dependence of these
parameters somehow distinguish myosin I from other myosins? (2) There have been
previous speculations about the force sensitivity of myosin I, but to what degree and to
which step in the cross-bridge cycle does it correspond? (3) Do any of myosin I‟s
structural elements, such as its lever arm, regulate this force sensitivity? (4) Do cellular
environmental elements such as calcium regulate the chemomechanical activity of
myosin I? How fast does calcium affect this regulation? What structural element on the is
the target of calcium regulation? How does calcium affect the coupling of the chemical
and mechanical activities of myosin I? These questions are addressed using single
molecule and ensemble level techniques exploring the chemomechanical activity of
7
Myosin V is a dimer whose best known cellular role is that of a cargo transporter
that can take multiple steps along actin. In this role, it is required to travel through a
cytoplasm that is densely packed (27). Understanding how myosin V can navigate such a complex environment first requires an understanding of the basic myosin V stepping
mechanism in a simpler, cell-free environment. Numerous studies have been done
examining basic myosin V stepping behavior, looking at characteristic parameters such as
average step-size and run-lengths (28,29,30,31). A hand-over-hand stepping mechanism is now largely accepted based on sophisticated fluorescence studies done on processively
stepping myosin V (32,33). More complicated behavior has been described for the overall stepping path, such as myosin V mediated actin twirling and myosin V stepping with a
left-handed pitch on actin (34,35).
A more detailed mechanism for myosin V stepping requires a number of
questions to be answered: (1) Many of the more sophisticated studies are reporting
motion of the probe attached to the lever arm of myosin V, which leaves some ambiguity
as to the nature of the myosin V stepping. How does the orientation of the probe relate to
the orientation of the lever arm? (2) How does the orientation of the lever arm of myosin
V change with each step it takes along actin? This will give detailed information of
potential steps a myosin V can take and allow models to be created that describe possible
paths along actin. These questions are addressed using single molecule techniques
8
1.5
Thesis Overview
In the research leading to this thesis, a number of experiments were performed at
the ensemble and single molecule levels in order to probe the chemomechanical functions
of two unconventional myosins, myosin I and myosin V. The goals of the myosin I
studies, presented in Chapter 2, are to (1) characterize key rates in the ATPase cycle and
determine their possible temperature dependence; (2) determine which of these chemical
steps correspond to the mechanical power stroke, and which of these, if any, are sensitive
to force and to what extent; (3) examine how the length of the lever-arm determines the
step-size and magnitude of its force sensing ability; (4) examine how calcium regulation
impacts the key steps in the ATPase cycle, the step-size and force sensitivity. The goals
of the myosin V studies, presented in Chapter 3, were to (1) examine how lever-arm
length might determine the three-dimensional path of myosin V on actin; (2) determine
the local orientation of probes labeling myosin V‟s lever arm to allow for transformation
of the probe orientation that was measured in experiments to the more functionally
relevant lever-arm orientation. Chapters 2 and 3 are each organized with an Introduction,
a Methods section, a Results section and a Discussion section. A global discussion of
both projects is offered in Chapter 4.
Chapter 5 is the appendix, detailing principles and derivations of the numerous
equations used in this thesis. Section 5.1 discusses the General Simplex Fit program I
developed and used in Chapter 2. It also describes the basic principles behind the
algorithms used in this program. Section 5.2 describes the kinetic modeling used in the
force-dependence studies. Section 5.3 describes the kinetic modeling used for the calcium
9
well as a full discussion of the analysis that uses these equations to transform the probe
orientation to the lever orientation.
In chapter two, the sections detailing the mechanical activity of myosin Ib, were
done in collaboration with Joseph Laakso, a former graduate student of Mike Ostap‟s. He
performed the optical trap experiments and did the analysis involving event selection,
10
2
Characterization and Regulation of the
Chemomechanical Activity of Myosin Ib
Author Contributions
The myo1b temperature dependence study appeared in reference ( 36). John Lewis and Michael Ostap designed research; John Lewis, David Hokanson and Michael Ostap
performed research; John Lewis, David Hokanson, Henry Tianming Lin and Michael
Ostap contributed new reagents/analytic tools; John Lewis, David Hokanson and Michael
Ostap analyzed data; John Lewis, David Hokanson and Michael Ostap wrote the paper.
The myo1b force dependence study appeared in references ( 19, 26). Joe Laakso, Henry Shuman and Michael Ostap designed research; Joe Laakso and Michael Ostap
performed research; Joe Laakso, John Lewis, Henry Shuman and Michael Ostap
contributed new reagents/analytic tools; Joe Laakso, John Lewis, Henry Shuman and
Michael Ostap analyzed data; Joe Laakso, John Lewis, Henry Shuman and Michael Ostap
wrote the paper.
The calcium regulation of the myosin Ib tension sensing section will be submitted
to Nature Structural and Molecular Biology. John Lewis, Joe Laakso, Henry Shuman and
Michael Ostap designed research; John Lewis, Joe Laakso and Michael Ostap performed
research; John Lewis, Joe Laakso, Henry Shuman and Michael Ostap contributed new
reagents/analytic tools; John Lewis, Joe Laakso, Henry Shuman and Michael Ostap
analyzed data; John Lewis, Joe Laakso, Henry Shuman and Michael Ostap wrote the
11
2.1
Introduction
2.1.1
Temperature dependence of nucleotide association and kinetic
characterization of myo1b
Myosins are molecular motors that use the energy stored in ATP to perform
mechanical work along actin filaments. Myosin-Is are the single-headed,
low-molecular-weight members of the myosin superfamily that are proposed to link cellular membranes
with the actin cytoskeleton. Myosin-I isoforms bind phosphoinositides directly (12) and function in several important cellular processes, including membrane retraction,
macropinocytosis, phagocytosis, membrane trafficking, cell-cell adhesion, and
mechanical signal transduction (20,21,4,22,23,24,25).
Scheme 1
The biochemical mechanisms of long-tail and short-tail myosin-I isoforms have
12
30-fold slower than myosin-II, (b) nucleotide-free myo1b is in equilibrium between a
state that binds nucleotide (AM‟) and a state that does not bind nucleotide (AM), (c) the
rate of transition between AM and AM‟ (k+) states is similar to the rate of ADP release
(k+5‟), and (d) ADP release is slow and is accompanied by a rotation of the lever arm.
We proposed that the strikingly slow actomyo1b ATPase rate constants are a
property of all short-tail myosin-I isoforms (38,16). However, it has been shown recently that short-tailed Dictyostelium myosin-IE (not to be confused with vertebrate long-tail
myo1e (38)) has kinetic rate constants that are substantially faster than vertebrate short-tail isoforms (39). Because of experimental convenience, nearly all kinetic
characterizations of myosin ATPase cycles have been performed at temperatures between
18 – 25 °C, which is the range in which Dictyostelium cells live. There is no complete
kinetic characterization of any vertebrate unconventional myosin at physiological
temperature (37 °C), and it is possible that myosin-I rate constants are highly temperature
sensitive. Therefore, it is important to determine the kinetic lifetimes of the myo1b
intermediates at physiological temperature. To that end, we performed experiments that
determined the rate constants that define the rat myo1b ATPase cycle at 37 °C, and we
provide the first measurement of the rates of ATP hydrolysis and phosphate release for
myo1b. Our characterization has allowed us to calculate the myo1b duty ratio at
physiological temperature and determine thermodynamic parameters of ATP binding and
13
2.1.2
Myosin I can act as a molecular force sensor
ATP-dependent conformational changes in the myosin motor domain are amplified
into a power-stroke by the light chain binding domain (LCBD) which acts as the motor‟s
lever arm and is also referred to as the regulatory domain. The power stroke of myosin
occurs during the strong actin-binding phase of its ATPase cycle, and has been shown to
occur in two steps for some myosins, including myosin I (43). The rate of ADP release is the rate limiting step for exiting the strong actin-binding state, leading to the proposal that
this step is sensitive to force (44). This was first shown to be the case for a myosin family member with myosin II and brush border myosin I, where it was found that the second
step of the power stroke was associated with ADP release and was force sensitive (43). Moreover structural studies have shown that the second step of the myosin I power stroke
is associated with a 32° rotation in its LCBD (45).
To test the proposal that myo1b is a tension sensor, a series of experiments were
performed on myo1b to characterize its mechanical activity, including any potential force
sensitivity. Optical trap experiments performed on individual myo1bs characterized the
size of its overall power stroke and identified its component substeps with steps in the
ATPase cycle. Experiments in the optical trap coupled with a force feedback system (46) were performed on myo1b in order to test the effect of isometrically applied force on the
lifetime of actin attachment for myo1b. These studies clearly demonstrate that the second
sub-step of myo1b is associated with ADP release and is highly force sensitive, causing
14
2.1.3
Dependence of effective lever-arm length on the mechanical
activity of isoforms of myosin Ib
We show in this thesis that the lifetime of actin attachment of the motor domain
of myo1b is increased by force applied along its LCBD (see Section 2.3.2; 19). The LCBD of most myosins is composed of one or more IQ motifs, which are α-helical
sequences of ~ 23 amino acids each with a core consensus sequence that binds
calmodulin and calmodulin-like proteins at low calcium concentrations. Calmodulins
bound to the LCBD are thought to increase its stiffness, thus allowing it to bear load and
act as a mechanical lever arm (47). The amount of mechanical work performed by the LCBD is related to the step-size, which in other myosins has been shown to be linearly
related to the length of their respective LCBDs (48,49).
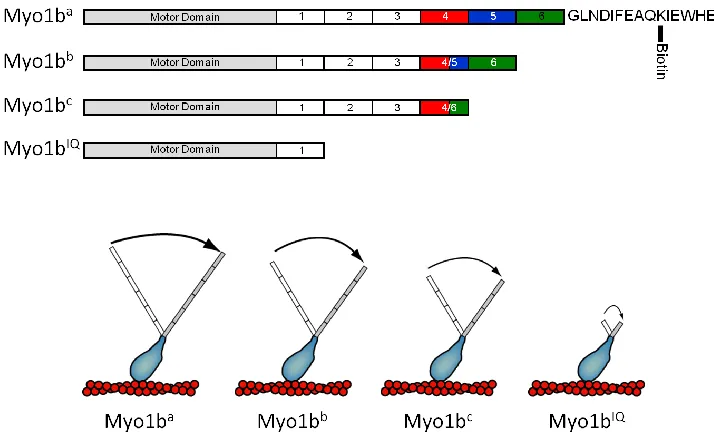
Myosin Ib has three native splice isoforms myo1ba, myo1bb, and myo1bc that result in different length LCBDs with 6, 5 and 4 IQ motifs, respectively (Figure 2.1; 20,50). Single molecule optical trap experiments were therefore performed on isoforms of myo1b to test the dependence of the lengths of their LCBDs on their respective
step-sizes. Because of the importance of the LCBD length on the amount of mechanical work
that myosin can perform, the dependence of the LCBD length on myo1b force sensing
15
2.1.4
Calcium regulation of the chemomechanical activity of myosin Ib
It has long been recognized that calcium binding to LCBD-associated calmodulins
is a potential cellular mechanism for regulating motility (51, 52, 53), especially since it was realized that calmodulin binding likely provides mechanical stiffness to the LCBD
(47). Indeed, it has been demonstrated in vitro that calcium binding weakens the affinity of calmodulin for the LCBD of some myosins resulting in the uncoupling of motile and
ATPase activities (53). Additionally, it has been shown that processive stepping of myosin-V is decreased when the free calcium concentration is increased, presumably as a
result of calcium-induced changes in LCBD mechanics (54).
Figure 2.1 – Myosin Ib (myo1b) isoforms used in this study
16
We show in this thesis that the actin-attachment kinetics of the widely expressed
myosin-I isoform, myo1b, to be highly force sensitive (see Section 2.3.2; 19), with this force sensitivity depending on LCBD length (see Section 0; 26). Isoforms with longer LCBDs are more force sensitive. The extraordinarily long attachment lifetime of myo1b
under load poses a regulatory challenge. How are force-induced attachments that last
~100 s terminated? Calcium binding to LCBD-associated calmodulins is a likely
candidate, since calcium binding to one or more of the calmodulins bound to the lever
arm could directly lead to a reduction in its stiffness or effective lever arm length. This
change in LCBD mechanics could reduce the ability of the lever arm to bear load, and
potentially release the myo1b from a prolonged, force-induced actin binding event.
In this study, we examined the effect of calcium on the kinetic and mechanical
function of myo1b through a series of ensemble-level and single molecule experiments.
Experiments were performed with the “a” splice isoform of myo1b truncated after the
17
2.2
MATERIALS AND METHODS
2.2.1
Reagents, Proteins, and Buffers
2‟-Deoxy-methyanthraniloyl-labeled ATP (mantATP) was synthesized as
described (55). ADP and ATP concentrations were determined spectrophotometrically before each experiment by absorbance at 259 nm, 259 = 15,400 M-1cm-1. MantATP
concentrations were determined by absorbance at 255 nm, 255 = 23,300 M-1cm-1 (55).
Rabbit skeletal muscle actin was prepared and gel filtered (56). Actin
concentrations were determined by absorbance at 290 nm, 290 = 26,600 M-1cm-1. Actin
for transient kinetics experiments was labeled with pyrenyl iodoacetamide (pyrene-actin)
and gel filtered (57). All actin was stabilized with a molar equivalent of phalloidin (Sigma). Calmodulin (CaM) was expressed in bacteria and purified as described (58).
Steady-state and transient experiments were performed in KMg25 buffer (10 mM
Mops, 25 mM KCl, 1 mM MgCl2, 1 mM EGTA, 1 mM DTT). The pH of the buffer was
adjusted to pH 7.0 at 25 °C, and changed by less than 0.1 pH units when the temperature
was increased to 37 °C. Free CaM (1 M) was included in all solutions that contain
18
2.2.2
Myosin-I Expression and Purification
Myo1b expression constructs were prepared as described (50). All myo1b splice isoform constructs were truncated after the final IQ motif in the light chain binding
domain (Figure 2.1). An additional non-native construct (myo1bIQ) consisting of the motor and first IQ motif was also prepared. The concentration of myo1bIQ was determined using the Coomassie Plus reagent (Pierce) using bovine serum albumin
(BSA) as a standard. Based on previous work that validates myosin active-site
concentrations (36, 37, 59, 60), BSA is an appropriate protein standard. Final stock concentrations were typically 5 – 10 mg/ml, and were stored at -20 °C in 50% glycerol.
Preparations of four liter cultures yielded 4 – 15 mg of protein. A 15-amino acid AviTag
sequence for site-specific biotinylation and a FLAG sequence for purification were
inserted at the C-termini of the four constructs (50, 61).
Myo1b constructs were expressed and purified from Sf9 cells that were
co-infected with virus containing recombinant myo1b and calmodulin as described (38). Concentrated protein was site-specifically biotinylated with 20 µg/ml biotin ligase in the
presence of 10 mM MgATP and 50 µM biotin at 30 °C for 1 h. Free biotin and ATP
were removed by MonoQ column chromatography and dialysis. Protein integrity was
19
2.2.3
Kinetic Measurements
Transient kinetic measurements were made with an Applied Photophysics
(Surrey, U.K.) SX.18MV stopped-flow. A 400 nm long-pass filter (Oriel) was used to
monitor pyrene (ex = 365 nm) and mantATP (ex = 295 nm) fluorescence. Tryptophan
fluorescence was monitored using a 320 nm band pass filter with an excitation
wavelength of 295 nm. The time courses in the figures show the average of 1 - 4
individual traces. Transients were fitted to exponential functions using the software
supplied with the stopped-flow. Unless stated otherwise, all concentrations are given as
final after mixing. Steady state actin activated ATPase and actin motility (gliding assays)
rates were measured in experiments performed as described before (50).
Solutions of actomyo1b contained apyrase (0.01 U/mL) when loaded into the
stopped flow to ensure the mixtures were free of contaminating ADP and ATP. This
apyrase concentration was high enough to remove contaminating nucleotide, but not high
enough to interfere with the kinetic measurements. Solutions used for determining the
rate of association of myo1bIQ with pyrene-actin included 0.3 U/mL apyrase.
Transient phosphate (Pi) release was measured by stopped-flow using the coupled
assay system containing the fluorescently labeled mutant of the phosphate binding
protein (PiBP) using an excitation wavelength of 425 nm and a 440 nm long-pass filter
(63,64). To remove contaminating phosphate, the instrument lines were incubated with 1 mM 7-methylguanosine and 0.2 U/mL nucleoside phosphorylase overnight.
Stopped-flow solutions contained 100 µM 7-methylguanosine and 0.004 U/mL nucleoside
20
(10 µM) was mixed with 5 µM ATP in the first mix and aged for 7 s, resulting in
concentrations of 5 µM myo1bIQ and 2.5 µM ATP. Myo1bIQ and ATP were then mixed with actin, resulting in final concentrations of 2.5 µM myo1bIQ, 1.25 µM ATP, and 0 – 80 µM actin. PiBP was included in all solutions, and was present at a final concentration of
5 µM after mixing. Errors reported are standard errors in the fits.
Kinetic modeling was performed using the reaction outlined in Scheme 1 where A
is actin and M is myosin. The temperature dependence of the rates of ATP binding and
ADP release were analyzed according to the Arrhenius relation:
2.2.1 – Arrhenius Equation
where R is the gas constant (8.31451 Jmol-1K-1), T is the temperature in Kelvin, Ea is the
activation energy, and A is the pre-exponential factor (see Section 5.4.1). The standard
enthalpy change of the isomerization of the AM to AM‟ states (Kα) was determined from
a van‟t Hoff plot:
2.2.2 - van‘t Hoff Equation
21
2.2.4
Bead and Motility Chamber Preparation
NEM-myosin II was prepared according to the method of Veigel et al. (65) and stored in 50% glycerol for up to one month at -20°C. 2 μL of polystyrene beads (1.1 μm
diameter, 10% by volume) were washed twice in 250 μL water to remove surfactant in
storage solution. The beads were re-suspended in ~15 μL dH2O by brief sonication in a
bath sonicator and ~80 μL (2.5 mg/mL) of the NEM-myosin-II stock solution was added
to the beads and incubated for two hours at 4°C. The coated beads were added to 1
mg/ml BSA in high salt buffer (500 mM KCl, 4 mM MgCl2, 1 mM EGTA, 20 mM
KH2PO4, pH 7.2) and mixed gently to depolymerize long myosin filaments on the beads.
The beads were collected by low speed centrifugation (7 minutes @ 8000 rpm on a
desktop centrifuge) and re-suspended in 1 mg/ml BSA in motility buffer. The beads were
collected by another round of low speed centrifugation and re-suspended in ~200 μL
motility buffer. Coated beads were stored at 4°C and used for up to 10 days.
Nitrocellulose-coated motility chambers containing 1.9 μm silica beads as
pedestals (Bangs Laboratories, Fishers, IN) were prepared as described (46,19).
Solutions were added sequentially to the chamber as follows: 0.1 mg/mL streptavidin in
water (3 min); 1 mg/mL bovine serum albumin in KMg25 (10 mM Mops, 25 mM KCl, 1
mM MgCl2, 1 mM EGTA, 1 mM DTT) (2 x 5 min); 1 – 5 nM biotinylated myo1b in
KMg25 + 10 μM calmodulin (5 min); 1 nM rhodamine-phalloidin labeled F-actin in
KMg25 with 10 mg/ml glucose, 1 - 50 μM ATP, 20 μM calmodulin, 192 U/ml glucose
oxidase, and 48 μg/mL catalase (Roche). Beads coated with NEM-myosin-II were added
to one side of the chamber to replace ~¼ the volume of the chamber. The chamber was
22
2.2.5
Single Molecule Measurements
Single-molecule interactions were recorded using the three-bead assay geometry
in a dual-beam optical trap system as described (19,46). Trap stiffnesses were ~0.022 pN/nm. NEM-myosin-II beads were captured in separate optical traps, and
bead-actin-bead dumbbells were assembled by contacting the trapped bead-actin-beads with single actin
filaments. Bead-actin-bead assemblies were pre-tensioned to ~2.5 pN and lowered onto
the surface of a pedestal using a piezoelectric stage controller to scan for actomyo1b
interactions. Upon observation of interactions, data were digitized with a 2 kHz sampling
rate for 6 - 10 minute intervals. All experiments were performed in KMg25 (10 mM
Mops, 25 mM KCl, 1 mM MgCl2, 1 mM EGTA, 1 mM DTT).
The force-dependence of actomyo1b attachment lifetimes was measured using a
feedback system that applies a dynamic load to the actomyo1b to keep the actin filament
near its isometric position during the myosin working stroke as described (19,46). Briefly, changes in the force on the bead attached to the pointed end of the actin filament
(transducer bead) were fed through an analog integrating feedback amplifier to an
acousto-optic deflector, which changed the position of the laser trap on the bead bound to
the barbed end of the actin filament (motor trap) until the position of the transducer bead
was restored to its original position. The response time of the feedback loop in the
absence of interactions was adjusted to 50 ms for each bead-actin-bead assembly.
To control low-frequency stage position fluctuations, an additional infrared laser
beam (λ = 830 nm, Point-Source) was installed on the same beam path as the trapping
23
objective, the laser light was directed to a separate 4-quadrant photodiode. We monitored
the position of the pedestal on which the myo1b is attached, and controlled the x-axis
(i.e., the long axis of the actin filament) of the stage position using an analog integrating
feedback amplifier. By incorporating this stage feedback system into our experiments,
we can reduce fluctuations of the stage due to drift or mechanical vibration, thus reducing
the noise in our force traces.
2.2.6
Event Selections
To determine the start and endpoints of actomyo1b attachments, we used the
covariance threshold selection method #2, as described (19). The variance of the
digitized forces on both the transducer and motor beads was calculated at each time point
of the data files over an 85 ms sliding-window and the resulting signal was smoothed
over a 50 ms sliding-window. The covariance was then calculated as described (46). In this method, the beginning of the attachment is defined as the point where the covariance
decreased below a point in which the histogram of covariances over the data set was at a
minimum. The ends of the attachments were defined as the point where the covariance
went above that same threshold. To reduce false positive events due to transient
decreases in covariance during unattached periods, we included only events longer than
100ms (twice the width of our smoothing window). Ensemble averages of interactions
that were synchronized at the times the interactions started or ended were performed as
24
2.2.7
Distributions from Single Molecule Events Fit Using a Maximum
Likelihood Routine
The best values for the parameters described in equations 2.3.3 - 2.3.5 were found
using a Maximum Likelihood routine utilizing a modified exponential decay probability
distribution function (see Section 5.1). The Log Likelihood was minimized with a
Nelson-Mead Downhill Simplex routine (see Section 5.1; 66). The function was
sufficiently complex that the minimization had to be frequently restarted in order to find
the true global minimum. The restart algorithm was based on a modified Annealing
routine sometimes used for multiple parameter fits (see Section 5.1; 66). The combination of these two algorithms allowed for a rapid convergence to the global
minimum of the Log Likelihood function. Confidence intervals for each uniquely
determined parameter were found by simulating the data with a Bootstrap routine (see
Section 5.1; 66). We generated a 1000 such data sets and independently fit them for all of the relevant parameters. In order to calculate the confidence interval of 90 % for a
given parameter, the boundaries were determined in which 45% of the simulated data
were contained on either side of the value of the parameter from the actual data. The
maximum and minimum confidence intervals were then calculated from the upper and
25
2.3
RESULTS
2.3.1
Temperature dependence of nucleotide association and kinetic
characterization of myo1b
2.3.1.1 Myo1bIQ Binding to Actin Filaments
A ~75% fluorescence quenching upon strong binding of myo1bIQ to pyrene-actin allowed us to monitor the association of myo1bIQ with actin (k-6 ; Scheme 2). Time
courses of myo1bIQ binding to actin at 37 °C follow single exponentials, and the observed rates depend linearly on the actin concentration (Figure 2.2). Data were modeled as:
Scheme 2
where A* represents the unquenched fluorescent state of pyrene-actin. A linear fit to the data yields an apparent second-order rate constant of k-6 = 8.2 ± 0.32 µM-1s-1 (Table 2.1).
The rate of dissociation of myo1bIQ from pyrene-actin (k+6 ; Scheme 2) was measured by
competition with 50-fold excess of unlabeled actin (Figure 2.2). The time course fit a single exponential function with a rate k+6 = 0.0044 ± 0.00010 s-1 (Table 2.1). The
actomyo1bIQ dissociation constant (K6) calculated from the dissociation and association
26
k+6 (s-1) 0.0044 ± 0.00010b k+4‟ (s-1) 0.58 0.056g
k-6 (µM-1s-1) 8.2 ± 0.32b K9 (M) 53 9.8g
K6 (nM) 0.54 ± 0.024c
K5‟ (M) 0.84 ± 0.068b
1/K1‟ (M) 330 ± 25b k+5‟ (s-1) 6.7 ± 0.064b
k+2‟ (s-1) 500 ± 15b k-5‟ (M-1 s-1) 8.0 ± 0.65c
K1‟k+2‟ (M-1 s-1) 1.5 ± 0.12c
K1‟k+2‟ (M-1 s-1) 1.2 ± 0.041b,d
K1‟k+2‟ (M-1 s-1) 0.64 ± 0.020e Kα 3.7 ± 0.65b
k+α (s-1) 13 ± 1.0b
k-α (s-1) 3.5 ± 0.67c
k3app (s-1) 41 4.9f
f MantATP g Phosphate-binding protein. ATP Hydrolysis a
KMg25 (10 mM MOPS (pH 7.0), 25 mM KCl, 1 mM EGTA, 1 mM DTT, 1 mM
MgCl2, 37 °C) + 1 µM CaM.
bPyrene-actin fluorescence
c
Calculated
d
Determined from a linear fit of the data at low ATP concentrations
e
Light scattering in the presence of mantATP
Nucleotide-Free Isomerization Step Actin Binding Phosphate Release
ADP Release ATP Binding
27
Figure 2.3 - Temperature dependence of ATP binding to actomyo1bIQ.
Pyrene-fluorescence transients obtained by mixing 1.0 M actomyo1bIQ with 60 M ATP at 10 – 37 °C.
Figure 2.2 - Kinetics of myo1bIQ association with actin filaments. (Top) Actin concentration dependence of the observed rate (kobs) of
28
2.3.1.2 ATP-Induced Population of the Weakly-Bound States
Pyrene-actin fluorescence was used to measure the rate of ATP binding and
population of the weakly bound states at 10 – 37 °C. Mixing actomyo1bIQ with ATP
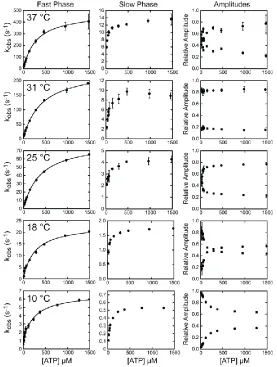
Figure 2.4 - MgATP induced population of weakly bound actomyo1bIQ states.
Pyrene-fluorescence transients obtained by mixing 1.0 M actomyo1bIQ with various ATP concentrations at 10 – 37 °C were fitted to double exponential functions (kobs= Afast(1-e-kfastt) + Aslow(1-e-kslowt)). The rates
29
resulted in a transient increase in pyrene-actin fluorescence. No lag phase was present,
and the transients were best fit to the sum of two exponential rates with positive
amplitudes (Figure 2.3). The rates of the fast phases were hyperbolically related to the ATP concentration (Figure 2.4, left column), whereas the rates of the slow phases were independent of ATP concentrations greater than 500 µM (Figure 2.4, center column).
Geeves et al (41) modeled the fast phase of the increase in pyrene-actin
fluorescence as ATP binding to the AM state and subsequent population of the AM.ATP
state (K1‟k+2‟), and proposed that the slow phase reports the transition from a
nucleotide-insensitive AM state to a AM‟ state that can bind ATP (k+) as follows:
Scheme 3
where A* represents the unquenched fluorescent state of pyrene-actin. We analyzed the ATP dependence of the fast phase as:
30
where, K1‟ is a rapid equilibrium and k+2‟ is a rate-limiting isomerization to the high
fluorescence AM.ATP state. Values for K1‟ and k+2‟ at 10 – 37 °C are given in Table 2.1.
K1‟ is relatively insensitive to temperature, while k+2‟ varies > 80-fold between 10 – 37
°C. An Arrhenius plot of K1‟k+2‟ is linear and yields an activation energy (Ea) of 111
kJ/mol (Figure 2.5; Table 2.3).
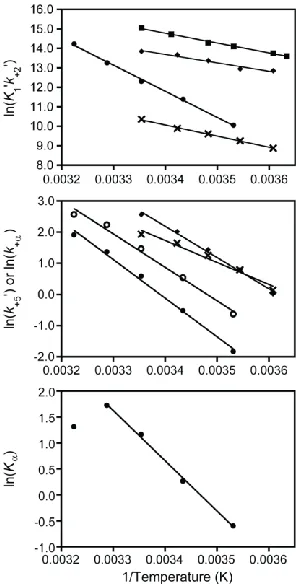
Figure 2.5 - Temperature dependence of ATP binding and ADP release. Arrhenius plots of the natural log of the rates of (top) ATP binding
(K1‟k+2‟) and (center) ADP release (k+5‟) versus inverse temperature (283 -
310 K) for () myo1bIQ, () myosin-II ( 73), () myosin-V ( 75), and () myosin-VI (30). The center plot also includes the temperature
dependence of () k+α for myo1bIQ. Solid lines are linear fits of the data
to the Arrhenius equation (equation 2.2.1) yielding Ea‟s given in Table 3.
(Bottom) van‟t Hoff plot of Kα showing non-linearity at temperatures >
31
37 °C 31 °C 25 °C 18 °C 10 °C
1/K1‟ (µM) 330 ± 25 420 ± 15 380 ± 10 260 ± 26 250 ± 53
k+2‟ (s-1) 500 ± 15 240 ± 3.7 82 ± 0.86 23 ± 0.85 5.7 ± 0.28
K1‟k+2‟ (μM-1s-1) b 1.5 ± 0.12 0.57 ± 0.022 0.22 ± 0.062 0.088 ± 0.0094 0.023 ± 0.0050
Kα 3.7 ± 0.65 5.6 ± 0.25 3.2 ± 0.077 1.3 ± .024 0.55 ± 0.092
k+α (s-1) 13 ± 1.0 9.3 ± 1.0 4.3 ± 0.35 1.7 ± 0.023 0.53 ± 0.0071
k-α (s-1)b 3.5 ± 0.67 1.7 ± 0.19 1.3 ± 0.11 1.3 ± 0.030 0.96 ± 0.16
k+5‟ (s-1) 6.7 ± 0.064 3.9 ± 0.036 1.8 ± 0.014 0.59 ± 0.0041 0.16 ± 0.0011
a
KMg25 (10 mM MOPS (pH 7.0), 25 mM KCl, 1 mM EGTA, 1 mM DTT, 1 mM MgCl2) plus 1
µM CaM.
bCalculated
Table 2.2 - Temperature Dependence of ATP Binding and ADP Release.a
Ea for k+2‟ (kJ/mol) a
Myo1bIQ 124
b Myosin-II N.D. c Myosin-V 74.9 c Myosin-VI 33.8 c
Myosin-VI (k+5‟) 58.6
a
This study.
b
Data from Millar and Geeves (73).
cData from Robblee et al (75). a
Myo1bIQ (k+ α) 89.1 a
Myo1bIQ (k+ 5‟) 103
c
Myosin-V (k+5‟) 83.3 Ea (kJ/mol) Temperature Dependence of ATP Binding
Ea for K1‟k+2‟ (kJ/mol)
111
42.4
35.8
47.5
Temperature Dependence of k+5‟ and k+α‟
32
At high ATP concentrations (> 500 µM), the rate of the slow phase reports the
isomerization of AM to AM‟ (k+), and the ratio of the amplitudes (Figure 2.4, right
column) of the fast phase to the slow phase reports the equilibrium constant between AM
and AM‟ (41). Values for K, k+, and k- at 10 – 37 °C were determined by averaging
points acquired at ATP concentrations > 1 mM at each temperature (Table 2.2). K varies ~10-fold, while k+ ranges from 0.53 s-1 at 10 °C to 13 s-1 at 37 °C (Table 2.2). An
Arrhenius plot of k+ is linear with an Ea of 89.1 kJ/mol (Figure 2.5; Table 2.3). At low
ATP concentrations, the rate of the slow phase shows an apparent ATP concentration
dependence. This dependence is due the fact that the slow rate of ATP binding at low
ATP concentrations is k+.
2.3.1.3 ATP Hydrolysis
Binding of mantATP to myo1bIQ does not result in a fluorescence change when the mant fluorophore is excited directly (40). However, we detect a fluorescence change when the mantATP is excited by energy transfer from the intrinsic tryptophans of
33
Scheme 4
where M.ADP.Pi* is the high fluorescence state.
The increase in mant fluorescence is not due to the ATP binding (K1‟k+2‟) or
actomyo1bIQ dissociation (k8) steps. We monitored the rate of mantATP-induced
actomyo1b dissociation by light scattering and found the dissociation rate to be linearly
related to all mantATP concentrations tested (Figure 2.6). A linear fit of the data yields a rate of mantATP binding (K1‟k+2‟ = 0.64 ± 0.02 μM-1s-1; Table 2.1). This
mantATP-Figure 2.6 - Rate of ATP hydrolysis by myo1bIQ as measured by mantATP fluorescence.
34
induced dissociation is ~ 2-fold slower than ATP-induced dissociation as measured by
pyrene-actin fluorescence (1.5 ± 0.081 µM-1s-1; Table 2.1).
2.3.1.4 Phosphate Release
Fluorescently-labeled phosphate-binding protein (PiBP) was used to measure
directly the rate of phosphate release (k+4‟) in sequential-mix, single-turnover,
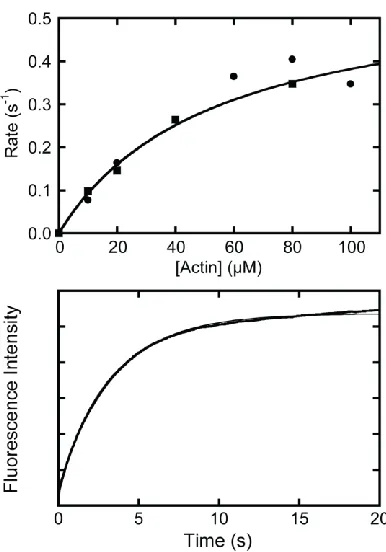
stopped-flow experiments (38,59,63,67). Myo1bIQ was mixed with ATP, aged 7 s to allow for ATP binding and hydrolysis, and mixed with actin (Figure 2.7). After the 7 s ageing time, we expect all ATP to bound to myosin and hydrolyzed, with the M.ADP.Pi state as
the predominant intermediate (Scheme 1). PiBP was included with the myo1bIQ and the actin to prevent transients due to phosphate released during the aging time or phosphate
contamination in the actin. In the absence of actin, the rate of phosphate release was too
slow to measure on the time-scale of the experiment (< 0.01 s-1). However, the time courses of phosphate release were single exponentials at all actin concentrations tested
and did not show lag or rapid-burst phases (Figure 2.7). The absence of a linear phase confirmed that the experiments report a single turnover. The actin concentration
dependence of the observed rate (kobs) was modeled as:
2.3.2
where K9 is a rapid equilibrium step and k+4‟ is irreversible in the absence of free
35
with K9 = 53 ± 9.8 µM and k+4‟ = 0.58 ± 0.056 s-1. The maximum rate of phosphate
release (k+4‟) is the same as the maximum steady-state rate of ATP turnover (Vmax = 0.6 ±
0.1 s-1), and the affinity of the M.ADP.P for actin (K9) is the same as the KATPase
Figure 2.7 - Steady-state ATPase rate and phosphate release from myo1bIQ
(Top, ) Actin dependence of the steady-state ATPase rate of myo1bIQ in KMg25 measured using the NADH-coupled assay at 37 °C. Data is from ( 50). (Top, ) Actin dependence of the rate of phosphate release (k4‟) from 2.5 µM myo1bIQ in the presence of 0 –
36
determined in steady-state experiments (50 ± 20 µM; Figure 2.7) (50). Therefore, the Pi release step is the rate-limiting step in the steady-state ATPase cycle.
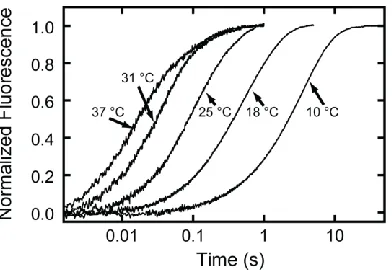
2.3.1.5 ADP Release
The rate of ADP release (k+5‟) was determined by ATP-induced dissociation of
myo1bIQ from pyrene-actin at 10 – 37 °C:
Scheme 5
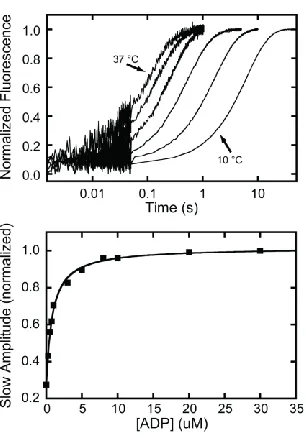
When myo1bIQ active-sites are saturated with ADP, ATP binding is rate-limited by the slow dissociation of ADP (40,59). ADP (30 µM final concentration) was incubated with 150 nM pyrene-actomyo1bIQ (final concentration) and mixed to 1 mM ATP (Figure 2.8, top). Transients were acquired on a split time-scale to ensure a fast phase was not being overlooked. Transients at 30 µM ADP were best fit by single exponential
functions and had rates that ranged from 0.16 s-1 at 10 °C to 6.7 s-1 at 37 °C (Figure 2.8;
Table 2.2). An Arrhenius plot of the data is linear and yields an Ea of 103 kJ/mol
(Figure 2.5; Table 2.3). The rates and temperature dependence of k+5‟ are similar to
those determined for k+ (Table 2.2 & Table 2.3).
37
of two exponential rates. The rate of the slow component reports the rate of ADP release
(k+5’), and the fast phase represents ATP binding to the nucleotide free sites (K1’k+2’).
The affinity of the actomyo1bIQ for ADP was determined by monitoring the change in
the relative amplitude of the slow phase (Figure 2.8, bottom; 42). A hyperbolic fit to the data yields an affinity, K5’ = 0.84 ± 0.068 µM (Table 2.1).
Figure 2.8 - ADP release from actomyo1bIQ.
(Top) Temperature dependence of the rate of the pyrene-actin fluorescence increase after mixing 1 mM ATP with 0.15 µM actomyo1bIQ equilibrated with 30 µM ADP. Transients were acquired at 10, 18, 25, 31, and 37 °C. The first 50 ms of the traces were acquired at a higher sampling rate,
resulting in larger scatter of the points. Transient acquired in the presence of 30 µM ADP were best fit by single exponential functions. (Bottom)
Normalized amplitude of the slow phase obtained by fitting pyrene transients to double exponential functions as a function of ADP