Open Access Journal of Clinical Trials
Variation in effect of intervention studies
in research on sickness absence
Hans Joergen Soegaard
Research Unit West, Centre for Psychiatric Research, Aarhus University Hospital, Risskov
Correspondence: Hans Joergen Soegaard Forskningsenhed Vest, Center for Psykiatrisk Forskning, Gl Landevej 43, 7400 Herning, Denmark
Tel +45 7847 4660 Fax +45 7847 4637
Email [email protected]
Background: Intervention studies in sickness absence research demonstrate a low effect and ambiguous results in reducing sickness absence and improving work status. The aim of this study was to determine if the effect of interventions is related to type of intervention, target population, inclusion criteria used, and impact of the scientific quality of the studies.
Methods: Based on a structured review of 57 studies, short-term, medium-term, and long-term effects were analyzed with regard to the type of intervention, target population, inclusion criteria, and scientific quality of the studies.
Results: The overall result was that the effect rate was low, ie, about 20% for short-term effect (up to 6 months) and medium-term effect (6–12 months), and 40% for long-term effect ($12 months). Interventions using stress reduction were most effective with regard to short-term and medium-short-term effects, whereas collaborative care was most effective for long-short-term effects. The effects were related to the inclusion criteria and, to a minor degree, to the scientific quality of the studies.
Conclusion: In the field of sickness absence research, more attention should be paid to the interrelationship between the types of interventions, target populations, and inclusion criteria for the studies. Larger studies of high methodological quality are needed. Steps should be taken to standardize outcome measures.
Keywords: nonparticipation, sickness absence, return to work, controlled trial, review
Background
Mental disorders impose suffering and reduce quality of life for the individuals living with these conditions. These disorders also impose an economic burden on society, primarily due to indirect costs in the form of sickness absence, early retirement, and early death.1,2 In addition, mental disorders significantly influence the outcome of
comorbid medical illnesses,3 family dysfunction, and induce a risk of mental and
physical illness among family members.4 With regard to sickness absence, the burden
is, in particular, due to common mental disorders, such as depression, anxiety, and somatoform disorders. These disorders primarily cause the burden because they occur rather frequently.1,5
The Organization for Economic Cooperation and Development reports that mental health problems now account for one third of all new disability claims on average,
and up to 40%–50% in some countries.6 The frequency of mental disorders among
incident individuals on long-term sickness absence (more than eight continuous weeks
of sickness absence) is about 50%.7 The burden imposed by common mental disorders
is increasing as documented in a Norwegian study, where evidence was found that
Dove
press
R E V i E W
open access to scientific and medical research
Open Access Full Text Article
Open Access Journal of Clinical Trials downloaded from https://www.dovepress.com/ by 118.70.13.36 on 26-Aug-2020
For personal use only.
Number of times this article has been viewed
This article was published in the following Dove Press journal: Open Access Journal of Clinical Trials
the cumulative incidence of long-term sickness absence for women with mental disorders increased from 1.7% in 1994
to 4.6% in 2000, and for men from 0.8% to 2.2%.8
This burden has motivated clinicians, rehabilitation officers, and researchers to develop interventions aimed at improving mental health and quality of life. The major-ity of studies in this area have used outcome measures for mental health and quality of life. In addition, an aim has been to reduce sickness absence and improve the fraction of positive work status. However, the studies applying outcome measures with regard to sickness absence and work status
measures are much fewer.9–16
The intervention studies have been the subject of sev-eral reviews. The reviews which have applied sickness absence and work status outcome measures indicate a large ambiguity with regard to effect on these outcome measures. This ambiguity may be caused by a variety of factors, such as the type of intervention, target population, inclusion criteria, and methodological issues. These methodological issues have been addressed by Moncrieff et al,17 who stated
that within the field of psychiatry several important issues are not well covered by the majority of published checklists and rating systems for assessment of the quality of studies. This is due to the fact that, in psychiatry, interventions take many forms. Subsequently, detailed reports of the interven-tions are necessary. In addition, some interveninterven-tions, such as psychotherapy, make it impossible to blind the intervention in regards to the patients. Psychiatric diagnoses are complex. In several studies, the diagnoses are compiled into a group of neuroses (common mental disorders). The nature of the inter-ventions makes randomization impossible. Consequently, Moncrieff et al17 developed an instrument consisting of
23 items, which is applicable to studies of nonpsychotic disorders. Evidence retrieved from studies of low quality should be assessed with caution, as documented by Moher et al,18 who showed that the overall quality of a study predicts
the obtained effect size. The issues mentioned by Moncrieff et al17 concern studies in psychiatry, but they can certainly be
applied within the field of mental disorders and psychological distress in sickness absence as well.
The aim of the study was to assess the results of inter-vention studies with attention to the outcome measures of sickness absence and work status. By means of a systematic literature review, it was investigated whether or not the effect rates of the examined studies were dependent on the following factors: type of intervention; scientific qual-ity of the study; target population and the population of eligible individuals; inclusion criteria; and fraction of
nonparticipation in the target group, the group of eligible participants, and at follow-up.
Methods
Literature review
The literature search aimed to identify intervention studies which met the following criteria:
• Studies must include outcome measures for sickness
absence or work status
• Interventions must possess the following characteristics:
○ Be primary, secondary, or tertiary interventions
○ Be aimed at reducing psychological distress and improving quality of life by one or more of the following types of interventions: organizational interventions, stress reducing interventions, feedback interventions, physical interventions, therapeutic interventions, and collaborative care. The studies were included if they involved screening for the purpose of detecting common mental disorders.
○ Participants must be healthy individuals with mental
distress or diagnosed as having a common mental dis-order such as depression, anxiety, or a somatoform disorder (primary intervention). However, this delimi-tation created ambiguity with regard to which studies to include. Studies including medically unexplained symptoms were included, whereas studies focusing on somatic conditions and those that exclusively addressed alcohol abuse or drug abuse were excluded. The ambi-guity concerning the delimitation of studies was due to the fact that many studies concerning individuals with musculoskeletal symptoms, low back pain, heart diseases, and other somatic conditions examined the effect on psychological distress and quality of life. • Be controlled studies, including a quasi-experimental
design, pre/post design, randomized controlled trials, cluster-randomized trials, and wait-list control studies. The literature search was carried out in the PubMed (Medline), Embase, PsycINFO, and Cochrane databases using the criteria shown in Figure 1. The search was supplemented with browsing. In total, the 57 studies presented in Table 1 were identified.
Concepts
Effect of a study
The outcome measures for sickness absence and work status were several, often more than one in the same study. The out-come measures were: duration of sickness absence, counted in number of days, hours, or weeks within a given period; Dovepress
Soegaard
Open Access Journal of Clinical Trials downloaded from https://www.dovepress.com/ by 118.70.13.36 on 26-Aug-2020
The PubMed search was carried out with the following MeSH words:
• Mental disorders or depression or anxiety or somatoform disorders or stress/psychological or professional burnout or mass screening
• Sick leave or absenteeism or efficiency/organizational
• Limitations: Clinical trial or controlled study or meta-analysis or review
The searches were combined by “and”.
In PsycINFO, the search terms were:
• Mental disorder or adjustment disorders or affective disorders or endogenous depression or acute stress disorder or generalized
anxiety disorder or obsessive compulsive disorder or panic disorder or phobias or social phobia or post-traumatic stress disorder or
somatization disorder or occupational stress
• Employee leave or employee absenteeism
• Limitations: Controlled study or controlled study or cluster randomized study or meta-analysis or review
The searches were combined by “and”.
In Embase, the criteria were the following keywords (exploded):
• Mental disease or depression or anxiety or somatoform disorder or job stress or burnout or mass screening • Medical leave or absenteeism or work capacity or rehabilitation or work resumption or work disability • Limitations: Controlled study or controlled study or cluster randomized study or meta-analysis or review
The searches were combined by “and”.
The Cochrane database was searched for the following reviews:
• Mental disorder or psychiatric disorder or depression or anxiety or somatoform disorder or stress or burnout or mass screening • Sickness absence or sick leave or absenteeism or return to work
The search was supplemented with browsing of the studies identified by the search mentioned above.
Figure 1 Search criteria.
rates of individuals who returned to work within a given period; and fractions of individuals having retained work within a given period. The effect was considered positive if at least one parameter indicated effect. The effect rate was defined as the fraction of interventions showing effect among the number of interventions where the effect was examined. This was done separately for short-term effect (up to 6 months after the initia-tion of the interveninitia-tion), medium-term effect (from 6 months up to one year), and long-term effect (one year and longer).
intervention group and control group
Some studies involved more interventions which were compared with the same control group. The control groups depended on the target population; in some studies, no intervention, and, in others, care as usual. Care as usual differs very much depending on the target group. It was not possible to define a control group in five studies. The stud-ies carried out by van Rhenen et al,19,20 Knekt et al,21 Krogh
et al,22 Schene et al,23 and Stenlund et al24 were included in
the review. However, when it came to analyses that compared intervention groups with control groups, these studies were excluded. Furthermore, the studies by Bakker et al25,26 and
Soegaard and Bech27 showed an effect in subgroups but not
in the total group of analyzed participants. These studies were registered as being without effect.
Types of interventions
The interventions were categorized as being organizational, or focused on stress reduction, feedback, physical, therapy, education, or collaborative care.
Organizational interventions were directed towards the organizational structure in workplaces with the aim of reduc-ing stress, but not directed towards each individual employee. However, these interventions involved the employees in identifying the stress-creating factors in the workplaces and in the development of actions to reduce these stress-creating factors.15,28–37
Stress reduction interventions were directed towards the individuals participating in a particular study employing this type of intervention. The individuals were informed about stress-creating factors and means to reduce stress in the form of posted information, information given at seminars or meetings, or at an individual level.27,30,32,33,38–55 The
stress-reducing intervention in the study by Saksvik and Nytro49
Dovepress Variation in effect of intervention studies
Open Access Journal of Clinical Trials downloaded from https://www.dovepress.com/ by 118.70.13.36 on 26-Aug-2020
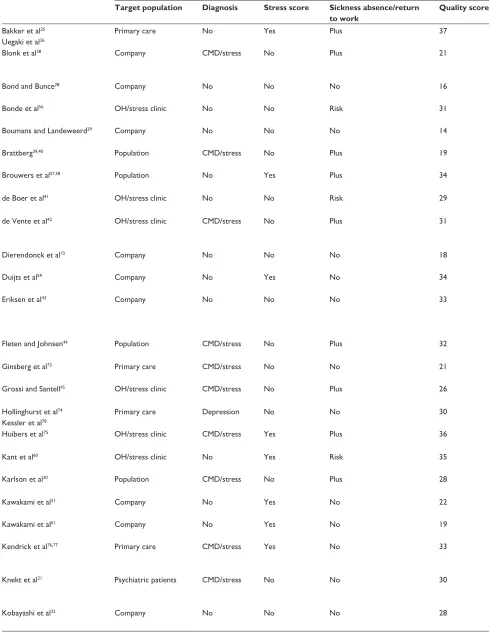
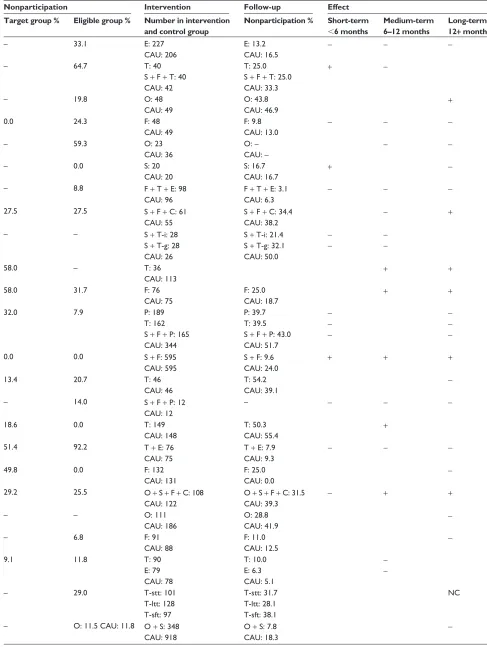
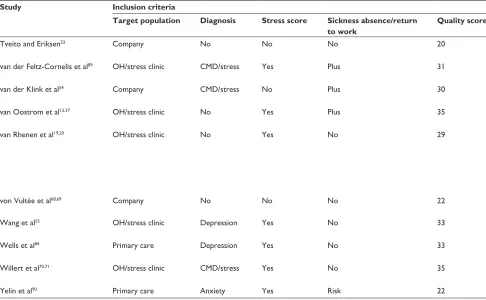
Table 1 Overview of the 57 reviewed studies
Study Inclusion criteria Nonparticipation Intervention Follow-up Effect
Target population Diagnosis Stress score Sickness absence/return to work
Quality score Target group % Eligible group % Number in intervention and control group
Nonparticipation % Short-term
,6 months
Medium-term 6–12 months
Long-term 12+ months
Bakker et al25
Uegaki et al26
Primary care No Yes Plus 37 – 33.1 E: 227
CAU: 206
E: 13.2 CAU: 16.5
- -
-Blonk et al38 Company CMD/stress No Plus 21 – 64.7 T: 40
S + F + T: 40 CAU: 42
T: 25.0 S + F + T: 25.0 CAU: 33.3
+
-Bond and Bunce28 Company No No No 16 – 19.8 O: 48
CAU: 49
O: 43.8
CAU: 46.9 +
Bonde et al56 OH/stress clinic No No Risk 31 0.0 24.3 F: 48
CAU: 49
F: 9.8 CAU: 13.0
- -
-Boumans and Landeweerd29 Company No No No 14 – 59.3 O: 23
CAU: 36
O: – CAU: –
-
-Brattberg39,40 Population CMD/stress No Plus 19 – 0.0 S: 20
CAU: 20
S: 16.7
CAU: 16.7 +
-Brouwers et al57,58 Population No Yes Plus 34 – 8.8 F + T + E: 98
CAU: 96
F + T + E: 3.1 CAU: 6.3
- -
-de Boer et al41 OH/stress clinic No No Risk 29 27.5 27.5 S + F + C: 61
CAU: 55
S + F + C: 34.4 CAU: 38.2
- +
de Vente et al42 OH/stress clinic CMD/stress No Plus 31 – – S + T-i: 28
S + T-g: 28 CAU: 26
S + T-i: 21.4 S + T-g: 32.1 CAU: 50.0
-
- -
-Dierendonck et al72 Company No No No 18 58.0 – T: 36
CAU: 113 + +
Duijts et al59 Company No Yes No 34 58.0 31.7 F: 76
CAU: 75
F: 25.0 CAU: 18.7
+ +
Eriksen et al43 Company No No No 33 32.0 7.9 P: 189
T: 162 S + F + P: 165 CAU: 344
P: 39.7 T: 39.5 S + F + P: 43.0 CAU: 51.7
- -
-- -
-Fleten and Johnsen44 Population CMD/stress No Plus 32 0.0 0.0 S + F: 595
CAU: 595
S + F: 9.6 CAU: 24.0
+ + +
Ginsberg et al73 Primary care CMD/stress No No 21 13.4 20.7 T: 46
CAU: 46
T: 54.2 CAU: 39.1
-Grossi and Santell45 OH/stress clinic CMD/stress No Plus 26 – 14.0 S + F + P: 12
CAU: 12
– - -
-Hollinghurst et al74
Kessler et al78
Primary care Depression No No 30 18.6 0.0 T: 149
CAU: 148
T: 50.3
CAU: 55.4 +
Huibers et al75 OH/stress clinic CMD/stress Yes Plus 36 51.4 92.2 T + E: 76
CAU: 75
T + E: 7.9 CAU: 9.3
- -
-Kant et al60 OH/stress clinic No Yes Risk 35 49.8 0.0 F: 132
CAU: 131
F: 25.0
CAU: 0.0
-Karlson et al30 Population CMD/stress No Plus 28 29.2 25.5 O + S + F + C: 108
CAU: 122
O + S + F + C: 31.5 CAU: 39.3
- + +
Kawakami et al31 Company No Yes No 22 – – O: 111
CAU: 186
O: 28.8 CAU: 41.9
-Kawakami et al61 Company No Yes No 19 – 6.8 F: 91
CAU: 88
F: 11.0
CAU: 12.5
-Kendrick et al76,77 Primary care CMD/stress Yes No 33 9.1 11.8 T: 90
E: 79 CAU: 78
T: 10.0 E: 6.3 CAU: 5.1
-
-Knekt et al21 Psychiatric patients CMD/stress No No 30 – 29.0 T-stt: 101
T-ltt: 128 T-sft: 97
T-stt: 31.7 T-ltt: 28.1 T-sft: 38.1
NC
Kobayashi et al32 Company No No No 28 – O: 11.5 CAU: 11.8 O + S: 348
CAU: 918
O + S: 7.8 CAU: 18.3
-(Continued)
Dovepress
Soegaard
Open Access Journal of Clinical Trials downloaded from https://www.dovepress.com/ by 118.70.13.36 on 26-Aug-2020
Table 1 Overview of the 57 reviewed studies
Study Inclusion criteria Nonparticipation Intervention Follow-up Effect
Target population Diagnosis Stress score Sickness absence/return to work
Quality score Target group % Eligible group % Number in intervention and control group
Nonparticipation % Short-term
,6 months
Medium-term 6–12 months
Long-term 12+ months
Bakker et al25
Uegaki et al26
Primary care No Yes Plus 37 – 33.1 E: 227
CAU: 206
E: 13.2 CAU: 16.5
- -
-Blonk et al38 Company CMD/stress No Plus 21 – 64.7 T: 40
S + F + T: 40 CAU: 42
T: 25.0 S + F + T: 25.0 CAU: 33.3
+
-Bond and Bunce28 Company No No No 16 – 19.8 O: 48
CAU: 49
O: 43.8
CAU: 46.9 +
Bonde et al56 OH/stress clinic No No Risk 31 0.0 24.3 F: 48
CAU: 49
F: 9.8 CAU: 13.0
- -
-Boumans and Landeweerd29 Company No No No 14 – 59.3 O: 23
CAU: 36
O: – CAU: –
-
-Brattberg39,40 Population CMD/stress No Plus 19 – 0.0 S: 20
CAU: 20
S: 16.7
CAU: 16.7 +
-Brouwers et al57,58 Population No Yes Plus 34 – 8.8 F + T + E: 98
CAU: 96
F + T + E: 3.1 CAU: 6.3
- -
-de Boer et al41 OH/stress clinic No No Risk 29 27.5 27.5 S + F + C: 61
CAU: 55
S + F + C: 34.4 CAU: 38.2
- +
de Vente et al42 OH/stress clinic CMD/stress No Plus 31 – – S + T-i: 28
S + T-g: 28 CAU: 26
S + T-i: 21.4 S + T-g: 32.1 CAU: 50.0
-
- -
-Dierendonck et al72 Company No No No 18 58.0 – T: 36
CAU: 113 + +
Duijts et al59 Company No Yes No 34 58.0 31.7 F: 76
CAU: 75
F: 25.0 CAU: 18.7
+ +
Eriksen et al43 Company No No No 33 32.0 7.9 P: 189
T: 162 S + F + P: 165 CAU: 344
P: 39.7 T: 39.5 S + F + P: 43.0 CAU: 51.7
- -
-- -
-Fleten and Johnsen44 Population CMD/stress No Plus 32 0.0 0.0 S + F: 595
CAU: 595
S + F: 9.6 CAU: 24.0
+ + +
Ginsberg et al73 Primary care CMD/stress No No 21 13.4 20.7 T: 46
CAU: 46
T: 54.2 CAU: 39.1
-Grossi and Santell45 OH/stress clinic CMD/stress No Plus 26 – 14.0 S + F + P: 12
CAU: 12
– - -
-Hollinghurst et al74
Kessler et al78
Primary care Depression No No 30 18.6 0.0 T: 149
CAU: 148
T: 50.3
CAU: 55.4 +
Huibers et al75 OH/stress clinic CMD/stress Yes Plus 36 51.4 92.2 T + E: 76
CAU: 75
T + E: 7.9 CAU: 9.3
- -
-Kant et al60 OH/stress clinic No Yes Risk 35 49.8 0.0 F: 132
CAU: 131
F: 25.0
CAU: 0.0
-Karlson et al30 Population CMD/stress No Plus 28 29.2 25.5 O + S + F + C: 108
CAU: 122
O + S + F + C: 31.5 CAU: 39.3
- + +
Kawakami et al31 Company No Yes No 22 – – O: 111
CAU: 186
O: 28.8 CAU: 41.9
-Kawakami et al61 Company No Yes No 19 – 6.8 F: 91
CAU: 88
F: 11.0
CAU: 12.5
-Kendrick et al76,77 Primary care CMD/stress Yes No 33 9.1 11.8 T: 90
E: 79 CAU: 78
T: 10.0 E: 6.3 CAU: 5.1
-
-Knekt et al21 Psychiatric patients CMD/stress No No 30 – 29.0 T-stt: 101
T-ltt: 128 T-sft: 97
T-stt: 31.7 T-ltt: 28.1 T-sft: 38.1
NC
Kobayashi et al32 Company No No No 28 – O: 11.5 CAU: 11.8 O + S: 348
CAU: 918
O + S: 7.8 CAU: 18.3
-(Continued)
Dovepress Variation in effect of intervention studies
Open Access Journal of Clinical Trials downloaded from https://www.dovepress.com/ by 118.70.13.36 on 26-Aug-2020
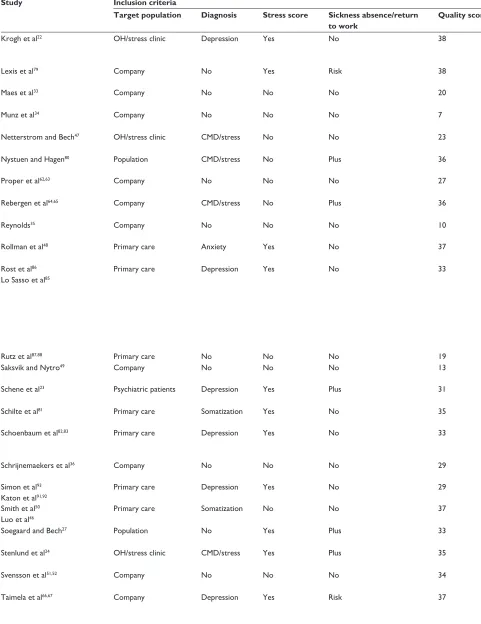
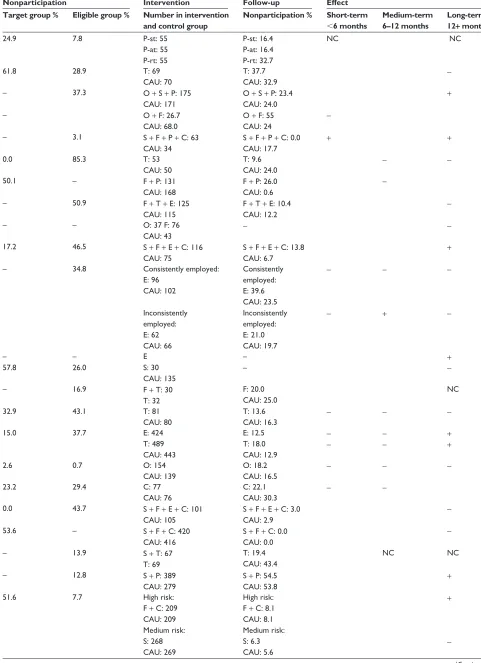
Table 1 (Continued)
Study Inclusion criteria Nonparticipation Intervention Follow-up Effect
Target population Diagnosis Stress score Sickness absence/return to work
Quality score Target group % Eligible group % Number in intervention and control group
Nonparticipation % Short-term
,6 months
Medium-term 6–12 months
Long-term 12+ months
Krogh et al22 OH/stress clinic Depression Yes No 38 24.9 7.8 P-st: 55
P-at: 55 P-rt: 55
P-st: 16.4 P-at: 16.4 P-rt: 32.7
NC NC
Lexis et al79 Company No Yes Risk 38 61.8 28.9 T: 69
CAU: 70
T: 37.7
CAU: 32.9
-Maes et al33 Company No No No 20 – 37.3 O + S + P: 175
CAU: 171
O + S + P: 23.4 CAU: 24.0
+
Munz et al34 Company No No No 7 – O + F: 26.7
CAU: 68.0
O + F: 55 CAU: 24
-Netterstrom and Bech47 OH/stress clinic CMD/stress No No 23 – 3.1 S + F + P + C: 63
CAU: 34
S + F + P + C: 0.0 CAU: 17.7
+ +
Nystuen and Hagen80 Population CMD/stress No Plus 36 0.0 85.3 T: 53
CAU: 50
T: 9.6 CAU: 24.0
-
-Proper et al62,63 Company No No No 27 50.1 – F + P: 131
CAU: 168
F + P: 26.0 CAU: 0.6
-Rebergen et al64,65 Company CMD/stress No Plus 36 – 50.9 F + T + E: 125
CAU: 115
F + T + E: 10.4 CAU: 12.2
-Reynolds35 Company No No No 10 – – O: 37 F: 76
CAU: 43
-
-Rollman et al48 Primary care Anxiety Yes No 37 17.2 46.5 S + F + E + C: 116
CAU: 75
S + F + E + C: 13.8 CAU: 6.7
+
Rost et al86
Lo Sasso et al85
Primary care Depression Yes No 33 – 34.8 Consistently employed:
E: 96 CAU: 102
inconsistently employed: E: 62 CAU: 66
Consistently employed: E: 39.6 CAU: 23.5 inconsistently employed: E: 21.0 CAU: 19.7
-
--
+
-
-Rutz et al87,88 Primary care No No No 19 – – E – +
Saksvik and Nytro49 Company No No No 13 57.8 26.0 S: 30
CAU: 135
–
-Schene et al23 Psychiatric patients Depression Yes Plus 31 – 16.9 F + T: 30
T: 32
F: 20.0 CAU: 25.0
NC
Schilte et al81 Primary care Somatization Yes No 35 32.9 43.1 T: 81
CAU: 80
T: 13.6 CAU: 16.3
- -
-Schoenbaum et al82,83 Primary care Depression Yes No 33 15.0 37.7 E: 424
T: 489 CAU: 443
E: 12.5 T: 18.0 CAU: 12.9
-
- - - ++
Schrijnemaekers et al36 Company No No No 29 2.6 0.7 O: 154
CAU: 139
O: 18.2 CAU: 16.5
- -
-Simon et al93
Katon et al91,92
Primary care Depression Yes No 29 23.2 29.4 C: 77
CAU: 76
C: 22.1
CAU: 30.3 -
-Smith et al50
Luo et al46
Primary care Somatization No No 37 0.0 43.7 S + F + E + C: 101
CAU: 105
S + F + E + C: 3.0 CAU: 2.9
-Soegaard and Bech27 Population No Yes Plus 33 53.6 – S + F + C: 420
CAU: 416
S + F + C: 0.0 CAU: 0.0
-Stenlund et al24 OH/stress clinic CMD/stress Yes Plus 35 – 13.9 S + T: 67
T: 69
T: 19.4 CAU: 43.4
NC NC
Svensson et al51,52 Company No No No 34 – 12.8 S + P: 389
CAU: 279
S + P: 54.5 CAU: 53.8
+
Taimela et al66,67 Company Depression Yes Risk 37 51.6 7.7 High risk:
F + C: 209 CAU: 209 Medium risk: S: 268 CAU: 269
High risk: F + C: 8.1 CAU: 8.1 Medium risk: S: 6.3 CAU: 5.6
+
-(Continued)
Dovepress
Soegaard
Open Access Journal of Clinical Trials downloaded from https://www.dovepress.com/ by 118.70.13.36 on 26-Aug-2020
Table 1 (Continued)
Study Inclusion criteria Nonparticipation Intervention Follow-up Effect
Target population Diagnosis Stress score Sickness absence/return to work
Quality score Target group % Eligible group % Number in intervention and control group
Nonparticipation % Short-term
,6 months
Medium-term 6–12 months
Long-term 12+ months
Krogh et al22 OH/stress clinic Depression Yes No 38 24.9 7.8 P-st: 55
P-at: 55 P-rt: 55
P-st: 16.4 P-at: 16.4 P-rt: 32.7
NC NC
Lexis et al79 Company No Yes Risk 38 61.8 28.9 T: 69
CAU: 70
T: 37.7
CAU: 32.9
-Maes et al33 Company No No No 20 – 37.3 O + S + P: 175
CAU: 171
O + S + P: 23.4 CAU: 24.0
+
Munz et al34 Company No No No 7 – O + F: 26.7
CAU: 68.0
O + F: 55 CAU: 24
-Netterstrom and Bech47 OH/stress clinic CMD/stress No No 23 – 3.1 S + F + P + C: 63
CAU: 34
S + F + P + C: 0.0 CAU: 17.7
+ +
Nystuen and Hagen80 Population CMD/stress No Plus 36 0.0 85.3 T: 53
CAU: 50
T: 9.6 CAU: 24.0
-
-Proper et al62,63 Company No No No 27 50.1 – F + P: 131
CAU: 168
F + P: 26.0 CAU: 0.6
-Rebergen et al64,65 Company CMD/stress No Plus 36 – 50.9 F + T + E: 125
CAU: 115
F + T + E: 10.4 CAU: 12.2
-Reynolds35 Company No No No 10 – – O: 37 F: 76
CAU: 43
-
-Rollman et al48 Primary care Anxiety Yes No 37 17.2 46.5 S + F + E + C: 116
CAU: 75
S + F + E + C: 13.8 CAU: 6.7
+
Rost et al86
Lo Sasso et al85
Primary care Depression Yes No 33 – 34.8 Consistently employed:
E: 96 CAU: 102
inconsistently employed: E: 62 CAU: 66
Consistently employed: E: 39.6 CAU: 23.5 inconsistently employed: E: 21.0 CAU: 19.7
-
--
+
-
-Rutz et al87,88 Primary care No No No 19 – – E – +
Saksvik and Nytro49 Company No No No 13 57.8 26.0 S: 30
CAU: 135
–
-Schene et al23 Psychiatric patients Depression Yes Plus 31 – 16.9 F + T: 30
T: 32
F: 20.0 CAU: 25.0
NC
Schilte et al81 Primary care Somatization Yes No 35 32.9 43.1 T: 81
CAU: 80
T: 13.6 CAU: 16.3
- -
-Schoenbaum et al82,83 Primary care Depression Yes No 33 15.0 37.7 E: 424
T: 489 CAU: 443
E: 12.5 T: 18.0 CAU: 12.9
-
- - - ++
Schrijnemaekers et al36 Company No No No 29 2.6 0.7 O: 154
CAU: 139
O: 18.2 CAU: 16.5
- -
-Simon et al93
Katon et al91,92
Primary care Depression Yes No 29 23.2 29.4 C: 77
CAU: 76
C: 22.1
CAU: 30.3 -
-Smith et al50
Luo et al46
Primary care Somatization No No 37 0.0 43.7 S + F + E + C: 101
CAU: 105
S + F + E + C: 3.0 CAU: 2.9
-Soegaard and Bech27 Population No Yes Plus 33 53.6 – S + F + C: 420
CAU: 416
S + F + C: 0.0 CAU: 0.0
-Stenlund et al24 OH/stress clinic CMD/stress Yes Plus 35 – 13.9 S + T: 67
T: 69
T: 19.4 CAU: 43.4
NC NC
Svensson et al51,52 Company No No No 34 – 12.8 S + P: 389
CAU: 279
S + P: 54.5 CAU: 53.8
+
Taimela et al66,67 Company Depression Yes Risk 37 51.6 7.7 High risk:
F + C: 209 CAU: 209 Medium risk: S: 268 CAU: 269
High risk: F + C: 8.1 CAU: 8.1 Medium risk: S: 6.3 CAU: 5.6
+
-(Continued)
Dovepress Variation in effect of intervention studies
Open Access Journal of Clinical Trials downloaded from https://www.dovepress.com/ by 118.70.13.36 on 26-Aug-2020
Table 1 (Continued)
Study Inclusion criteria Nonparticipation Intervention Follow-up Effect
Target population Diagnosis Stress score Sickness absence/return to work
Quality score Target group % Eligible group % Number in intervention and control group
Nonparticipation % Short-term
,6 months
Medium-term 6–12 months
Long-term 12+ months
Tveito and Eriksen53 Company No No No 20 – 29.8 S + P: 19
CAU: 21
S + P: 36.8 CAU: 19.0
-van der Feltz-Cornelis et al89 OH/stress clinic CMD/stress Yes Plus 31 33.6 0.0 E + C: 29
CAU: 31
E + C: 13.8 CAU: 22.6
+
-van der Klink et al54 Company CMD/stress No Plus 30 – 19.3 S + F + T + E: 109
CAU: 83
S + F + T + E: 39.5 CAU: 38.9
+ +
van Oostrom et al15,37 OH/stress clinic No Yes Plus 35 55.7 58.9 O + F + C: 73
CAU: 72
O + F + C: 0.0 CAU: 2.3
-
-van Rhenen et al19,20 OH/stress clinic No Yes No 29 48.8 Stressed:
P: 64.4 T: 71.2 Nonstressed P: 34.8 T: 45.4
Stressed: P: 70 T: 57 Nonstressed: P: 129 T: 108
Stressed: P: 37.1 T: 21.1 Nonstressed: P: 44.2 T: 25.0
NC NC
NC NC
von Vultée et al68,69 Company No No No 22 – – F: 52
CAU: 52
F: 19.2
CAU: 19.2 +
Wang et al55 OH/stress clinic Depression Yes No 33 19.3 – S + F + T + C: 304
CAU: 300
S + F + T + C: 14.5 CAU: 10.0
+ +
Wells et al84 Primary care Depression Yes No 33 15.0 30.2 T + E: 913
CAU: 443
T + E: 17.6 CAU: 15.6
- - +
Willert et al70,71 OH/stress clinic CMD/stress Yes No 35 9.8 12.4 F + T: 51
CAU: 51
F + T: 11.8 CAU: 25.5
+ -
-Yelin et al90 Primary care Anxiety Yes Risk 22 22.3 27.0 E
-Abbreviations: O, Organizational intervention; OH, occupational health; S, stress reduction; F, feedback; P, physical; T, therapy; E, education; C, collaborative intervention; CAU, care as usual; i, individual therapy; g, group therapy; sft, solution-focused psychotherapy; stt, short-term psychodynamic psychotherapy; ltt, long-term; at, aerobic training; st, strength training; rt, relaxation training; CMD, common mental disorders; NC, no control group.
was somewhat different from that in other studies using stress-reducing intervention because it allowed employees in the Norwegian health care sector of a municipality to take up to five days of self-approved sick leave with full financial compensation up to four times a year.
Feedback interventions involved screening of individu-als with regard to signs of distress or mental disorder, and, subsequently, individuals showing signs of distress were given individual feedback with regard to how to change their lifestyle and react to stressors in their individual lives and in workplaces.15,23 27,30,34,35,37,38,41,43–48,50,54–71
Physical interventions involved physical training, aerobics, strength training, and other physical activities with the aim of reducing psychological distress.19,20,22,33,43,45,47,51–53,62,63
Therapeutic interventions involved conventional thera-pies, such as cognitive/behavioral therapy, solution-focused therapy, psychodynamic therapy, and disclosure therapy.19–21,24,38,42,43,54,55,57,58,64,65,70–84
Educational interventions refer to interventions where caregivers such as general practitioners, nurses, and social workers were educated with regard to the identification of individuals with psychological distress and psychiatric
diagnoses. The caregivers were educated in guideline-based treatment and often in means to improve the individuals’ adherence to treatment.25,26,46,48,50,54,57,58,64,65,75–77,82–90
Collaborative care refers to interventions which involved collaboration between different caregivers. The interventions ensured that information regarding treatment and rehabilita-tion was provided to different caregivers. In some studies, the effect of the intervention was monitored for each individual. If it was considered necessary, appropriate actions were taken.15,27,30,37,41,46–48,50,55,66,67,89,91–93
Quality of a study
The scientific quality of the studies was assessed by the
instrument previously mentioned by Moncrieff et al.17 The
items of this instrument are found in Table 2. The quality in each item was rated on a three-point Likert scale, except for some measures which were rated on a two-point Likert scale, whereby 0 indicated low quality, 1 medium quality, and 2 high quality. Two of the items in this instrument were handled differently in comparison with Moncrieff et al, ie, blinding of assessor where assessments in all cases were independent of the researcher, being based on self-report Dovepress
Soegaard
Open Access Journal of Clinical Trials downloaded from https://www.dovepress.com/ by 118.70.13.36 on 26-Aug-2020
Table 1 (Continued)
Study Inclusion criteria Nonparticipation Intervention Follow-up Effect
Target population Diagnosis Stress score Sickness absence/return to work
Quality score Target group % Eligible group % Number in intervention and control group
Nonparticipation % Short-term
,6 months
Medium-term 6–12 months
Long-term 12+ months
Tveito and Eriksen53 Company No No No 20 – 29.8 S + P: 19
CAU: 21
S + P: 36.8 CAU: 19.0
-van der Feltz-Cornelis et al89 OH/stress clinic CMD/stress Yes Plus 31 33.6 0.0 E + C: 29
CAU: 31
E + C: 13.8 CAU: 22.6
+
-van der Klink et al54 Company CMD/stress No Plus 30 – 19.3 S + F + T + E: 109
CAU: 83
S + F + T + E: 39.5 CAU: 38.9
+ +
van Oostrom et al15,37 OH/stress clinic No Yes Plus 35 55.7 58.9 O + F + C: 73
CAU: 72
O + F + C: 0.0 CAU: 2.3
-
-van Rhenen et al19,20 OH/stress clinic No Yes No 29 48.8 Stressed:
P: 64.4 T: 71.2 Nonstressed P: 34.8 T: 45.4
Stressed: P: 70 T: 57 Nonstressed: P: 129 T: 108
Stressed: P: 37.1 T: 21.1 Nonstressed: P: 44.2 T: 25.0
NC NC
NC NC
von Vultée et al68,69 Company No No No 22 – – F: 52
CAU: 52
F: 19.2
CAU: 19.2 +
Wang et al55 OH/stress clinic Depression Yes No 33 19.3 – S + F + T + C: 304
CAU: 300
S + F + T + C: 14.5 CAU: 10.0
+ +
Wells et al84 Primary care Depression Yes No 33 15.0 30.2 T + E: 913
CAU: 443
T + E: 17.6 CAU: 15.6
- - +
Willert et al70,71 OH/stress clinic CMD/stress Yes No 35 9.8 12.4 F + T: 51
CAU: 51
F + T: 11.8 CAU: 25.5
+ -
-Yelin et al90 Primary care Anxiety Yes Risk 22 22.3 27.0 E
-Abbreviations: O, Organizational intervention; OH, occupational health; S, stress reduction; F, feedback; P, physical; T, therapy; E, education; C, collaborative intervention; CAU, care as usual; i, individual therapy; g, group therapy; sft, solution-focused psychotherapy; stt, short-term psychodynamic psychotherapy; ltt, long-term; at, aerobic training; st, strength training; rt, relaxation training; CMD, common mental disorders; NC, no control group.
(scored as 0) or register-based data (scored as 2), with side effects being omitted because the interventions were not of an intrusive nature and were not expected to impose side effects on the individuals. The studies were assessed by the author three times. In the first two reviews, each study was reviewed with regard to all items, and, in the third review, each item was assessed transversely for the studies.
Target population and eligible group
The target population was defined as the population from which the participants were recruited. The following groups of target populations were defined: the population was defined as the target population if the studies recruited individuals from the entire population;27,30,39,40,44,80 company
included studies where the individuals were recruited from companies/corporations;28,29,31–36,38,43,49,51–53,57–59,61–69,72,79
primary care;25,26,46,48,50,73,74,76–78,81–88,90–93 and occupational
health clinics or stress clinics refer to studies that recruited individuals who attended an occupational health clinic or stress clinic.15,19,20,22,24,37,41,42,45,47,54–56,60,70,71,75,89 Some of
the occupational health/stress clinic studies recruited participants by invitation to employees in companies;
however, the intervention was carried out in the context of an occupational health/stress clinic. Psychiatric refers to participants that were recruited among individuals referred to psychiatric facilities.21,23
Eligible groups of participants were defined by three criteria, ie, diagnostic criteria, criteria for level of distress measured by psychopathological rating scales, and criteria for sickness absence/return to work/retention of work. The diagnostic criteria differentiated between no diagnostic criteria,15,19,20,25–29,31–37,41,43,49,51–53,56–63,68,69,72,79,87,88
d e p r e s s i o n ,2 2 , 2 3 , 5 5 , 6 6 , 6 7 , 7 4 , 7 8 , 8 2 – 8 6 , 9 1 – 9 3 a n x i e t y,4 8 , 9 0
somatofor m disorder,46,50,81 and common mental
disorders.21,24,30,38–40,42,44,45,47,54,64,65,70,71,73,75–77,80,89 Common
mental disorders included single diagnostic groups, such as adjustment disorders or a mixture of c ommon mental disorders. With regard to psychological distress criteria, a differentiation was made between plus criteria for psychological distress15,19,20,22–27,31,37,48,55,57–61,66,67,70,71,75–77,79,81–86,89–93 and no criteria
for psychological distress.21,28–30,32–36,38–47,49–54,56,62–65,68,69,72–74,78,80,87,88
Criteria regarding sickness absence/return to work/retention of work were divided into no criteria for sickness absence/work status,19–22,28,29,31–36,43,46–53,55,59,61–63,68–74,76–78,81–88,90–93 s ickness
Dovepress Variation in effect of intervention studies
Open Access Journal of Clinical Trials downloaded from https://www.dovepress.com/ by 118.70.13.36 on 26-Aug-2020
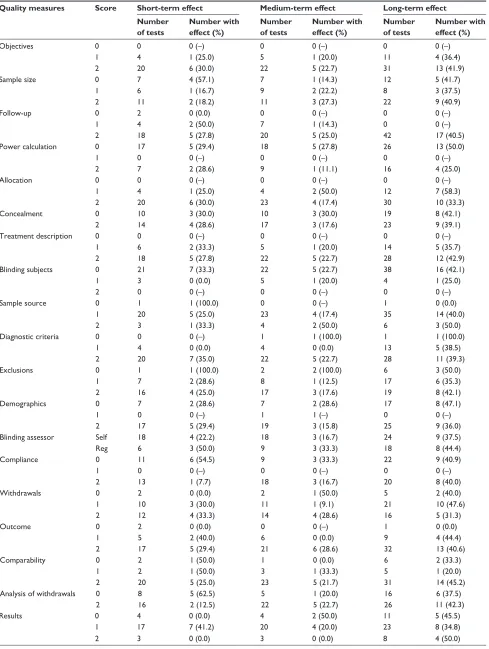
Table 2 Effect rates for short-term, medium-term, and long-term effects divided into quality parameters
Quality measures Score Short-term effect Medium-term effect Long-term effect Number
of tests
Number with effect (%)
Number of tests
Number with effect (%)
Number of tests
Number with effect (%)
Objectives 0 0 0 (–) 0 0 (–) 0 0 (–)
1 4 1 (25.0) 5 1 (20.0) 11 4 (36.4)
2 20 6 (30.0) 22 5 (22.7) 31 13 (41.9)
Sample size 0 7 4 (57.1) 7 1 (14.3) 12 5 (41.7)
1 6 1 (16.7) 9 2 (22.2) 8 3 (37.5)
2 11 2 (18.2) 11 3 (27.3) 22 9 (40.9)
Follow-up 0 2 0 (0.0) 0 0 (–) 0 0 (–)
1 4 2 (50.0) 7 1 (14.3) 0 0 (–)
2 18 5 (27.8) 20 5 (25.0) 42 17 (40.5)
Power calculation 0 17 5 (29.4) 18 5 (27.8) 26 13 (50.0)
1 0 0 (–) 0 0 (–) 0 0 (–)
2 7 2 (28.6) 9 1 (11.1) 16 4 (25.0)
Allocation 0 0 0 (–) 0 0 (–) 0 0 (–)
1 4 1 (25.0) 4 2 (50.0) 12 7 (58.3)
2 20 6 (30.0) 23 4 (17.4) 30 10 (33.3)
Concealment 0 10 3 (30.0) 10 3 (30.0) 19 8 (42.1)
2 14 4 (28.6) 17 3 (17.6) 23 9 (39.1)
Treatment description 0 0 0 (–) 0 0 (–) 0 0 (–)
1 6 2 (33.3) 5 1 (20.0) 14 5 (35.7)
2 18 5 (27.8) 22 5 (22.7) 28 12 (42.9)
Blinding subjects 0 21 7 (33.3) 22 5 (22.7) 38 16 (42.1)
1 3 0 (0.0) 5 1 (20.0) 4 1 (25.0)
2 0 0 (–) 0 0 (–) 0 0 (–)
Sample source 0 1 1 (100.0) 0 0 (–) 1 0 (0.0)
1 20 5 (25.0) 23 4 (17.4) 35 14 (40.0)
2 3 1 (33.3) 4 2 (50.0) 6 3 (50.0)
Diagnostic criteria 0 0 0 (–) 1 1 (100.0) 1 1 (100.0)
1 4 0 (0.0) 4 0 (0.0) 13 5 (38.5)
2 20 7 (35.0) 22 5 (22.7) 28 11 (39.3)
Exclusions 0 1 1 (100.0) 2 2 (100.0) 6 3 (50.0)
1 7 2 (28.6) 8 1 (12.5) 17 6 (35.3)
2 16 4 (25.0) 17 3 (17.6) 19 8 (42.1)
Demographics 0 7 2 (28.6) 7 2 (28.6) 17 8 (47.1)
1 0 0 (–) 1 1 (–) 0 0 (–)
2 17 5 (29.4) 19 3 (15.8) 25 9 (36.0)
Blinding assessor Self 18 4 (22.2) 18 3 (16.7) 24 9 (37.5)
Reg 6 3 (50.0) 9 3 (33.3) 18 8 (44.4)
Compliance 0 11 6 (54.5) 9 3 (33.3) 22 9 (40.9)
1 0 0 (–) 0 0 (–) 0 0 (–)
2 13 1 (7.7) 18 3 (16.7) 20 8 (40.0)
Withdrawals 0 2 0 (0.0) 2 1 (50.0) 5 2 (40.0)
1 10 3 (30.0) 11 1 (9.1) 21 10 (47.6)
2 12 4 (33.3) 14 4 (28.6) 16 5 (31.3)
Outcome 0 2 0 (0.0) 0 0 (–) 1 0 (0.0)
1 5 2 (40.0) 6 0 (0.0) 9 4 (44.4)
2 17 5 (29.4) 21 6 (28.6) 32 13 (40.6)
Comparability 0 2 1 (50.0) 1 0 (0.0) 6 2 (33.3)
1 2 1 (50.0) 3 1 (33.3) 5 1 (20.0)
2 20 5 (25.0) 23 5 (21.7) 31 14 (45.2)
Analysis of withdrawals 0 8 5 (62.5) 5 1 (20.0) 16 6 (37.5)
2 16 2 (12.5) 22 5 (22.7) 26 11 (42.3)
Results 0 4 0 (0.0) 4 2 (50.0) 11 5 (45.5)
1 17 7 (41.2) 20 4 (20.0) 23 8 (34.8)
2 3 0 (0.0) 3 0 (0.0) 8 4 (50.0)
(Continued)
Dovepress
Soegaard
Open Access Journal of Clinical Trials downloaded from https://www.dovepress.com/ by 118.70.13.36 on 26-Aug-2020
absence before entry,15,23–27,30,37–40,42,44,45,54,57,58,64,65,75,80,89 and
risk of sickness absence or losing contact with the labor market.41,56,60,66,67,79
Nonparticipation
Nonparticipation was examined in the target population, the eligible group, and at follow-up. A special case of nonpar-ticipation from the target population is incomplete coverage which covers the situation where individuals, who were intended to be reached by the study, were not reached at all, and where it was impossible to decide which individuals were not reached.94,95
The registration of nonparticipation from the target population and from the eligible group was restricted to individuals who refused to participate. Nonresponse from individuals who moved out of the area, died, or did not par-ticipate for other incapacitating reasons was not registered as nonparticipation.
With regard to nonparticipation at follow-up, some studies had more follow-ups, in which case the nonparticipation rate at the latest follow-up was chosen. The follow-up times varied from 3 to 36 months. The fraction of nonparticipation was registered, as well as the level of differential nonparticipation between the intervention group and the control group, and whether the differential nonparticipation was significant or not, as measured by the Chi-squared test. Some studies stated that there was no significant difference between the fraction of nonparticipation in the intervention group and in the control group. However, this could be due to the small number of par-ticipants in each group. For this reason, the 80% power limit for the intervention group was calculated as follows. The fraction of nonparticipation in the control group was kept constant, and, under this assumption, the limit of a hypothetical fraction
of nonparticipation in the intervention group was calculated at 80% test power, accepting the null hypothesis that there was no significant difference between nonparticipation in the intervention group and the control group. The power tests were carried out in STATA 10.0 using the command “sampsi onesample”.96 The limits shown indicate the lowest and highest
integer percentage of nonparticipation nearest to but below a power of 80% at the 5% significance level. However, in one case, a power of 82% was accepted because the nearest integer nonparticipation rate with a power below 80% was as low as 66%. The study data were entered into a data sheet and analyzed in STATA 10.096 and Excel. Comparisons between groups were
carried out using the Chi-squared test.
Results
Table 1 shows the 57 identified studies and illustrates the inclusion criteria, quality score, fraction of nonparticipation in the target population, the eligible group, and follow-up along with intervention type, numbers in the intervention and control groups, and effect.
Effect of interventions
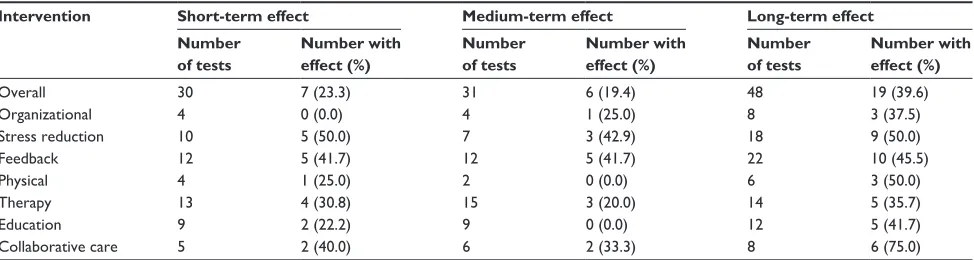
Table 3 shows the figures for each intervention according to short-term, medium-term, and long-term effect rates. Overall, 30 interventions were tested for short-term effect, with an effect rate of 23.3%. Stress reduction (50.0%) showed the highest effect rate and organizational intervention (0.0%) the lowest. Physical (25.0%) and educational interventions (22.2%) showed low effect rates.
Medium-term effect
In 31 interventions, the medium-term effect was tested with an overall effect rate of 19.4%. Stress reduction (42.9%) and
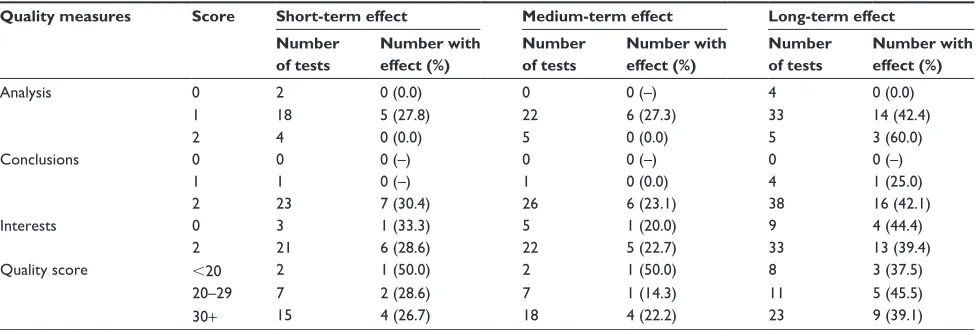
Table 2 (Continued)
Quality measures Score Short-term effect Medium-term effect Long-term effect Number
of tests
Number with effect (%)
Number of tests
Number with effect (%)
Number of tests
Number with effect (%)
Analysis 0 2 0 (0.0) 0 0 (–) 4 0 (0.0)
1 18 5 (27.8) 22 6 (27.3) 33 14 (42.4)
2 4 0 (0.0) 5 0 (0.0) 5 3 (60.0)
Conclusions 0 0 0 (–) 0 0 (–) 0 0 (–)
1 1 0 (–) 1 0 (0.0) 4 1 (25.0)
2 23 7 (30.4) 26 6 (23.1) 38 16 (42.1)
interests 0 3 1 (33.3) 5 1 (20.0) 9 4 (44.4)
2 21 6 (28.6) 22 5 (22.7) 33 13 (39.4)
Quality score ,20 2 1 (50.0) 2 1 (50.0) 8 3 (37.5)
20–29 7 2 (28.6) 7 1 (14.3) 11 5 (45.5)
30+ 15 4 (26.7) 18 4 (22.2) 23 9 (39.1)
Quality parameters with reference to Moncrieff et al.17
Dovepress Variation in effect of intervention studies
Open Access Journal of Clinical Trials downloaded from https://www.dovepress.com/ by 118.70.13.36 on 26-Aug-2020
feedback interventions (41.7%) showed the highest effect rates, whereas physical (0.0%) and educational interventions (0.0%) showed the lowest.
Long-term effect
The long-term effect was tested for 48 interventions, with an overall effect rate of 39.6%. The highest effect rate occurred for collaborative care interventions (75.0%) and the lowest effect rate occurred for therapeutic interventions (35.7%).
Studies without control group
Knekt et al21 found psychodynamic therapy superior to
solution-focused therapy in the long-term effect category. Krogh et al22 found no differences in sickness absence
between strength, aerobic, and relaxation training, nor for short-term, medium-term, or long-term effect. Schene et al23
found that the addition of occupational therapy to cognitive behavioral therapy significantly reduced sickness absence in the long-term effect category. Stenlund et al24 compared the
effect of cognitive therapy including Qigong (stress reduc-tion) with cognitive therapy alone and found no differences in medium-term and long-term effects. van Rhenen et al19,20
found no difference between cognitive behavioral therapy compared with physical exercise with regard to short-term and medium-term effect.
Effect related to scientific quality
of studies
Table 2 shows the number of studies and quality measures divided by short-term, medium-term, and long-term effect. In the interpretation of this table, it must be borne in mind that the number of tests in several cells is low. With regard to the quality of the studies, most of the studies showed a similar pattern, whether it concerned short-term, medium-term, or long-term effect. The studies showed good quality in the majority of the quality items. The exceptions were sample
source, results, and analysis, in which the majority of studies were of medium quality, and for power calculation, blinding of subjects, and blinding of subjects (self-report), the studies were of low quality. With regard to quality score, a large part of the studies had a score of $30.
Short-term effect
Two quality parameters, ie, compliance (54.5%, P= 0.012)
and analysis of withdrawals (62.5%, P = 0.011), showed significantly higher effect rates for studies of low quality compared with studies of medium or high quality. Sample size (57.1%) and blinding of subjects (33.3%) also showed rela-tively high effect rates, but nonsignificantly for studies of low quality. With regard to medium quality, follow-up (50.0%), outcome (40.0%), comparability (50.0%), results (41.2%), and analysis (27.8%) showed the highest effect rates, and for high-quality studies, the highest effect rates occurred for diagnostic criteria (35.0%) and blinding of assessor (50.0%). With regard to the quality score, the studies with the lowest quality (score ,20) had the highest effect rate (50.0%).
Medium-term effect
One test, exclusions (100.0%, P= 0.022), showed a signifi-cantly higher effect rate for low quality than for medium and high quality studies. Power calculation (27.8%), concealment (30.0%), exclusions (100.0%), demographics (28.6%), com-pliance (33.3%), withdrawals (50.0%), and results (50.0%) also showed relatively high effect rates with regard to low quality, but nonsignificantly. For medium quality, the high-est effect rates (nonsignificantly) occurred for allocation (50.0%), comparability (33.3%), and analysis (27.3%). For high quality, the highest success rates (nonsignificantly) occurred for sample source (50.0%), blinding of assessor (33.3%), outcome (28.6%), and conclusions (23.1%). With regard to quality score, studies with the lowest quality (score ,20) had the highest effect rate (50.0%).
Table 3 Effect rates for short-term, medium-term, and long-term effects divided into type of intervention
Intervention Short-term effect Medium-term effect Long-term effect Number
of tests
Number with effect (%)
Number of tests
Number with effect (%)
Number of tests
Number with effect (%)
Overall 30 7 (23.3) 31 6 (19.4) 48 19 (39.6)
Organizational 4 0 (0.0) 4 1 (25.0) 8 3 (37.5)
Stress reduction 10 5 (50.0) 7 3 (42.9) 18 9 (50.0)
Feedback 12 5 (41.7) 12 5 (41.7) 22 10 (45.5)
Physical 4 1 (25.0) 2 0 (0.0) 6 3 (50.0)
Therapy 13 4 (30.8) 15 3 (20.0) 14 5 (35.7)
Education 9 2 (22.2) 9 0 (0.0) 12 5 (41.7)
Collaborative care 5 2 (40.0) 6 2 (33.3) 8 6 (75.0)
Dovepress
Soegaard
Open Access Journal of Clinical Trials downloaded from https://www.dovepress.com/ by 118.70.13.36 on 26-Aug-2020
Long-term effect
There were no significant differences for the long-term effect category. Power calculation (50.0%) and blinding of subjects (42.1%) showed, nonsignificantly, higher effect rates for low quality compared with medium and high quality. For allocation (58.3%) and withdrawals (47.6%), the highest success rates were seen for medium quality and for high quality of sample source (50.0%), analysis (60.0%), and conclusions (42.1%). There were no differences with regard to the quality score.
Effect related to inclusion criteria
Table 4 shows the number of studies and inclusion criteria divided by short-term, medium-term, and long-term effect.
Short-term effect
An inclusion diagnosis of common mental disorders (63.6%,
P = 0.001) had a significantly higher effect rate than no diagnosis or other inclusion diagnoses. Population (66.7%) plus criteria for psychological distress (41.7%) and sickness absence before entry (41.7%) showed relatively high effect rates, but not significantly so.
Medium-term effect
There were no significant differences for medium-term effect. Population (66.7%), depression (33.3%), no criteria for psychological distress (30.8%), and no criteria for sick-ness absence/work status (28.6%) showed relatively high but nonsignificant effect rates.
Long-term effect
There were no significant differences. The highest, but non-significant, effect rates occurred for primary care (44.4%), occupational health/stress clinic (44.4%), depression (80.0%), no criteria for psychological distress (44.0%), and no criteria for sickness absence/work status (46.2%).
Effect related to nonparticipation
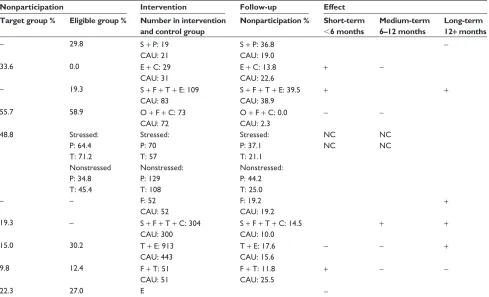
Table 5 shows the number of studies and nonparticipa-tion parameters divided by short-term, medium-term, and long-term effect. It was possible that incomplete cover-age occurred in 25 (44%) of the studies, because the size of the target population could not be estimated. The total nonparticipation rate for the target population was more than 30% in 15 (26%) studies. The nonparticipation rate for eligible participants was unknown in eight (14%) of the studies, and the nonparticipation rate was more than 30% in 17 (30%) of the studies. At follow-up, it was possible to estimate the nonparticipation rate in 63 intervention groups, in which the nonparticipation rate was higher than 30% in 14 (22%) studies and in 47 control groups. Of the 47 control groups, the nonparticipation rate was higher than 30% in 10 (21%) studies. Measures for differential nonparticipation at follow-up could be tested in 59 tests. Differential nonpar-ticipation was below 10% in 40 (68%) tests, 10%–20% in 16 (27%) tests, and 20% or higher in three (5%) tests. The hypothetical level of nonparticipation at 80% power limit
Table 4 Effect rates for short-term, medium-term, and long-term effects divided by inclusion criteria
Inclusion criteria Short-term effect Medium-term effect Long-term effect Number
of tests
Number with effect (%)
Number of tests
Number with effect (%)
Number of tests
Number with effect (%) Target population
Population 3 2 (66.7) 3 2 (66.7) 5 2 (40.0)
Company 5 1 (20.0) 7 2 (28.6) 19 7 (36.8)
Primary care 7 0 (0.0) 8 1 (12.5) 9 4 (44.4)
Occupation health/stress clinic 9 4 (44.4) 9 1 (11.1) 8 4 (44.4)
Inclusion diagnosis
No diagnosis 7 0 (0.0) 10 2 (20.0) 23 8 (34.8)
Depression 4 0 (0.0) 6 2 (33.3) 5 4 (80.0)
Anxiety 1 0 (0.0) 0 0 (–) 1 1 (100.0)
Somatoform disorder 1 0 (0.0) 1 0 (0.0) 2 0 (0.0)
Common mental disorders 11 7 (63.6) 10 2 (20.0) 11 4 (36.4)
Psychopathological score
No 12 5 (41.7) 13 4 (30.8) 25 11 (44.0)
Yes 12 2 (16.7) 14 2 (14.3) 17 6 (35.3)
Sickness absence/work status
No criteria 11 2 (18.2) 14 4 (28.6) 26 12 (46.2)
Plus sickness absence 12 5 (41.7) 11 2 (18.2) 11 3 (27.3)
Risk of sickness absence/return to/retention of work
1 0 (0.0) 2 0 (0.0) 5 2 (40.0)
Dovepress Variation in effect of intervention studies
Open Access Journal of Clinical Trials downloaded from https://www.dovepress.com/ by 118.70.13.36 on 26-Aug-2020
was below 10% in 25 (42%) tests, 10%–20% in 26 (44%) tests, and 20% or more in eight (14%) tests. Differential nonparticipation was significant in 10 (17%) tests.
Short-term effect
The highest, nonsignificant, effect rates occurred for nonparticipation in the target population of 0%–50%
(25.0%), for nonparticipation in the eligible group of 0%–25% (50.0%), number in inclusion group of 0–50 participants (57.1%), number in control group of 0–50 participants (57.1%), nonparticipation in control group at follow-up 20% or higher of 44.4%, 80% power limit, 20% or more of 66.7%, and no significance in differential nonparticipation (33.3%).
Table 5 Effect rates for short-term, medium-term, and long-term effects divided by nonparticipation parameters
Intervention Short-term effect Medium-term effect Long-term effect Number
of tests
Number with effect (%)
Number of tests
Number with effect (%)
Number of tests
Number with effect (%) Nonparticipation in target group %
Missing 10 4 (10.0) 7 0 (0.0) 19 7 (36.8)
,25 8 2 (25.0) 11 3 (27.3) 11 5 (45.5)
25–50 4 1 (25.0) 4 1 (25.0) 5 2 (40.0)
50+ 2 0 (0.0) 5 2 (40.0) 7 3 (42.9)
Nonparticipation in eligible group %
Missing 0 0 (–) 3 2 (66.7) 6 4 (66.7)
,25 12 6 (50.0) 10 2 (20.0) 19 6 (31.6)
25–50 8 0 (0.0) 9 2 (22.2) 13 7 (53.8)
50+ 4 1 (25.0) 5 0 (0.0) 4 0 (0.0)
Number in inclusion group
Missing 1 0 (0.0) 0 0 (–) 1 1 (100.0)
,50 7 4 (57.1) 8 1 (12.5) 9 2 (22.2)
50 , 100 12 2 (16.7) 15 2 (13.3) 16 5 (31.3)
100+ 10 2 (20.0) 9 3(33.3) 22 11(50.0)
Follow-up: nonparticipation in inclusion group (%)
Missing 3 0 (0.0) 3 1 (33.3) 6 2 (33.3)
,10 6 2 (33.3) 7 1 (14.3) 13 5 (38.5)
10–20 10 3 (30.0) 11 2 (18.2) 14 7 (50.0)
20+ 11 3 (27.3) 11 1 (9.1) 14 5 (35.7)
Number in control group (%)
Missing 1 0 (0.0) 1 0 (0.0) 1 1 (100.0)
,50 7 4 (57.1) 5 0 (0.0) 8 2 (25.0)
50–100 9 2 (22.2) 12 1 (8.3) 14 5 (35.7)
100+ 8 1 (12.5) 11 5 (45.5) 21 10 (47.6)
Follow-up: nonparticipation in control group (%)
Missing 3 0 (0.0) 3 1 (33.3) 6 2 (33.3)
,10 4 1 (25.0) 6 1 (16.7) 10 3 (30.0)
10–20 9 2 (22.2) 9 2 (22.2) 17 7 (41.2)
20+ 9 4 (44.4) 10 2 (20.0) 11 5 (45.5)
Difference in nonparticipation between inclusion and control group (%)
Missing 3 0 (0.0) 3 1 (33.3) 6 2 (33.3)
,10 19 6 (31.6) 22 4 (18.2) 29 15 (51.7)
10–20 7 2 (28.6) 5 1 (20.0) 11 2 (18.2)
20+ 1 0 (0.0) 2 0 (0.0) 1 0 (0.0)
80% power limits in difference in nonparticipation between inclusion and control group (%)
Missing 3 0 (0.0) 3 1 (33.3) 6 2 (33.3)
,10 10 1 (10.0) 13 2 (15.4) 21 10 (47.6)
10–20 11 3 (27.3) 11 3 (27.2) 18 7 (38.9)
20+ 6 4 (66.7) 5 0 (0.0) 2 0 (0.0)
Significance in differential nonparticipation between intervention and control group (%)
Missing 3 0 (0.0) 3 1 (33.3) 6 2 (33.3)
Yes 6 1 (16.7) 4 1 (25.0) 8 3 (37.5)
No 21 7 (33.3) 25 4 (16.0) 33 14 (42.4)
Dovepress
Soegaard
Open Access Journal of Clinical Trials downloaded from https://www.dovepress.com/ by 118.70.13.36 on 26-Aug-2020