O R I G I N A L R E S E A R C H
The Relationship Between Anthropometric Variables
and Race Performance
This article was published in the following Dove Press journal: Open Access Journal of Sports Medicine
Getachew Wassihun Dessalew Dawit Habte Woldeyes Belta Asnakew Abegaz
Anatomy Unit, Department of Biomedical Sciences, College of Medicine and Health Sciences, Bahir Dar University, Bahir Dar, Ethiopia
Introduction:The key elements of success in a given sports competition have become an
area of interest for researchers. The reason for the success of Ethiopian runners was not proved scientifically. This study aimed at documenting the anthropometric parameters of 10,000 meter runners and to find out the association between such parameters and performances.
Methods:A descriptivefield study was conducted. 32 elite 10,000 meter runners participated.
The data were collected while the athletics team was preparing for the world athletics champion-ship. The procedure was repeated three times for each individual. Statistical analysis was performed using SPSS version 18. All the data were presented as mean ± S.D. The Pearson product-moment test was used to determine the correlation between the variables andfinishing time. The level of significance for all statistical tests was set at p < 0.05.
Results: The experience of male and female athletes showed a negative association with
finishing time. However, there was no statistically significant correlation between the age and running time in both sexes. A significant positive association of body weight to running time was observed in both sexes. Body height correlates positively to running time in males (p<0.05), but not in females. The length of the arm, the forearm, the leg in both sexes and length of the thigh in women had no significant association withfinishing time. A smaller arm and calf circumferences have a positive effect on the performance of both sexes. Smaller thigh circumference showed a positive association with the performance of men.
Conclusion: The age of the runners did not correlate with their performance. The
anthro-pometric variables displayed significantly higher values in men than in women. Experienced athletes performed better in both sexes. Anthropometric parameters may be useful for selection, prediction, improving running performance besides for preventing injuries and health risk assessment.
Keywords:anthropometry, experience, limb circumference limb length, running time
Introduction
In the highly dynamic era of sports competitions, looking for the key elements of success in a given sport has become a major area of interest. Many speculations
have been said about the American dominance of basketball,1 the Northern
European dominance of skiing and the East African dominance of middle and
long-distance running.2,3
Studies have tried to find out the possible factors that could clarify the success
and dominance of East Africa’s long-distance athletes.4Most of them are mainly
attributed to factors such as social, psychological, genetic, environmental, structural
and physiological adaptations.5The case of East African domination in middle and
long-distance athletic running has paid more attention than any other group, and
Correspondence: Dawit Habte Woldeyes Tel +251 913214906
Fax +251 582202025 Email [email protected]
Open Access Journal of Sports Medicine
Dove
press
open access to scientific and medical research
Open Access Full Text Article
Open Access Journal of Sports Medicine downloaded from https://www.dovepress.com/ by 118.70.13.36 on 26-Aug-2020
their overwhelming success in such distances has kept
warm debates, for example, Scott et al4states that genetic
endowments, and physiological characteristics, play a role in the determination of athletic success. In addition, attri-butes such as environmental conditions, exposure to run-ning a long way to school each day, potentially give
psychological advantages for the athletes.5–7
There are different suggested factors that explain the
success and dominance of East Africa’s long-distance
ath-letes. Thefirst is their social situation.3Scholars argued that
the East African youngsters’, due to their economic,
cul-tural, demographic and political situations, they undertake aerobic activities daily, in their way to and from school as well as in other day-to-day routines during early ages could
bring higher physiological advantages in running.4,8
Another factor for the East African long-distance
run-ners’domination w believed to be a positive“mindset”of
East African athletes using the opportunity to get them-selves and their families out from poverty might drive them to put their utmost effort and perform their best. This
also motivates them and their juniors to become better.9,10
On the other hand, it has widely been believed that birth and living at high altitude can potentially produce great
athletes.8However, a great range of athletic potentials has
been observed between areas of similar altitude.5The most
controversial and widely speculated factor assumed to determine the success of East African long-distance runners is the anatomical and physiological adaptation which in turn
is determined by a gene-environment combination.11
Anthropometric characteristics play a crucial role in
the performance of runners.12 Some of the variables that
can commonly affect performance are body weight, body
height, limb length, and circumference of limbs.2,5,12
Although some, not all, physical characteristics seemed to favor athletes of East African long-distance runners, the
best successful athletes are limited to specific ethnic and
regional origins,3,4for example, The Kalenjin tribes from
Kenyans hold 40% of the top honors for distance running.3
The Arsi and Shewa regions in Ethiopia hold 73% of marathon runners and 43% of 5000 meters & 10,000
meter runners of the country.4
The reason for the success of east Africans, especially the
success of Ethiopian athletes was not proved scientifically.
Therefore, researchers in this area are shouldfind out the real
contributing factors for the success of Ethiopian athletes. Therefore, it motivated the researchers to conduct this study. Studies indicated that anthropometric variables have a crucial effect on running performance as investigated in
different research centers and tournaments of different
countries.12,13However, there is no scientifically established
anthropometric profile of Ethiopian runners in relation to
their performance in various running categories. This study aimed at documenting the anthropometric parameters of
Ethiopian world-class 10,000 meter runners and finding
out the association between these parameters and their
per-formance therebyfilling a gap to the previous studies.
Materials and Methods
Prior to the actual data collection process, two data col-lectors took training and practiced each measurement pro-cedure for ten days on the available runners at Ethiopian national stadium. The training and the practice were sup-ported by the national team physician and the coach. Pilot measurements were taken before the main measurements. The data were collected while the Ethiopian athletics team was preparing for 16th IAAF (International Association of Athletics Federation) world athletics championship, which was held in August 2017, in London.
After the researchers obtained written informed consent
from each participant, a descriptivefield study was conducted
at Ethiopian National Stadium, the trainingfield. There were
45 runners who had qualified the minimum performance based
on a standard time set by IAAF, they were training every day, once a day. From these runners, we took 32 runners of 10,000 meters (16 males & 16 females). The participants were those who were voluntary to participate, those who have evidence of
the bestfinishing time (minima) based on the IAAF standard,
which was 28:12:00/min: sec. for men and 32:20:00 min: sec. for women. Participants who were injured at the time of data collection and those who were not willing to participate were excluded from the study.
Before conducting the study, ethical clearance for the study was obtained from Addis Ababa University Medical Faculty Institutional Review Board. Information about socio-demographic characteristics such as age, sex, run-ning experience, was obtained from the participants using questionnaires. Anthropometric characteristics that were measured include body weight, body height, limb length, the circumference of limbs. Anthropometrics of symme-trical structures were taken on the right side of the body.
The data obtained were checked for clarity, consistency, and completeness. Statistical analysis was performed using SPSS version 18. All the data were presented as mean ± S.D. The Pearson product-moment test was used to determine the
correlation between the variables andfinishing time. In
addi-tion, partial correlation test was also used to determine the
Open Access Journal of Sports Medicine downloaded from https://www.dovepress.com/ by 118.70.13.36 on 26-Aug-2020
partial effect of the associated variables on thefinishing time by controlling their covariant(s). Then, a stepwise multiple linear regression analysis was applied to identify perfor-mance predictor variables from the set of already associated variables obtained from the correlation results. The level of
significance for all statistical tests was set at p < 0.05.
Except for the finishing time, every measurement was
taken; the descriptions of procedures were adapted from
Nhanes III: National health survey; Anthropometry.14The
procedure was repeated three times for each individual and the average was taken as a value for the measurement. The procedure which was employed is given as follows:
(A) The time tofinish the distance was taken, using the
stopwatch when the athletes arrived at thefinishing
line (min: sec.). The stopwatch was calibrated every day before taking the measurements. (B) The weight of the athlete is measured barefooted
using a standardized scale, and the measurement was taken and recorded to the nearest 0.1 kg. (C) The body height was measured using a stadiometer
(height board), and the value was taken to the nearest 0.1 cm.
(D) Length and circumference of limbs were recorded using a calibrated measuring tape.
Length and Circumference of the Upper
Limbs
The length of the arm was taken from the uppermost edge of the posterior border of the acromion process to the oleocranon process. Then, the measurement was taken and recorded to the nearest 0.1 cm. The Circumference of the arm was measured from the halfway distance of the arm of the above procedure with the right arm hanging freely to the side using a measuring tape. The measure-ment was taken to the nearest 0.1 cm.
The forearm (antebrachial) length was taken after arm length from the oleocranon process of the ulna to the line
joining the styloid process of radius & ulna in a flexed
position. Then, the measurement was taken and recorded to the nearest 0.1 cm.
Length and Circumference of the Lower
Limbs
Thigh-length was taken from the upper border of the greater trochanter to the level of the lateral meniscus of
the knee. Then, the measurement was taken and recorded to the nearest 0.1 cm.
The length of the leg was taken from the proximal end of the medial border of the tibia to the lower border of the medial malleolus of the leg. The measurement was taken to the nearest 0.1 cm. Circumferences of the thigh and calf were measured at the midpoints of the thigh and leg length measurements. The measurements were taken to the near-est 0.1cm.
Results
Socio-Demographic Characteristics
The distribution of sex, age, finishing time, and running
experience of runners are presented inTable 1below. The
mean time to finish the 10,000-meter distance was 27:11
±0:62/min: sec. for men and 31:07 ±1:07/min: sec. for women. The mean years of running experience for male and female athletes were found to be 5.0 ± 2.42/years and 4.44±1.9/years respectively, and their corresponding mean age was also found to be 24.1 ± 2.22/years for men and 22.37±2.24/years for women, respectively.
Anthropometric Pro
fi
les
Length and Circumferences of the Limbs
The mean arm, forearm, thigh, and leg lengths were 29.0 ±3.53/cm, 27.6±4.3/cm, 46.8±4.58/cm, 38.6±1.28/cm for men, and 22.9±3.2/cm, 26.3±2.58/cm, 37.9±1.62/cm, 36.2 ±2.30/cm for women, respectively. Whereas, the mean arm, thigh and calf circumference of male runners were 28.95 ±3.54/cm 46.8±4.58/cm and 31.97±4.36/cm, respectively. Correspondingly, for women, the measurements were 22.9
±3.25/cm, 36.9±4.12/cm and 23.3±6.45/cm (Table 2).
Correlation Between Finishing Time and Anthropometric Variables of the Runners
A significant positive correlation was observed between arm
and calf circumference of men and women with the running
time (p>0.05;Table 3). However, thigh circumference was
Table 1Socio-Demographic Characteristic of Male and Female
Athletes
Variables Results
Sex Male (n=16) Female (n=16)
Age (years) 24.1±2.22 22.37±2.24
Finishing time/min: sec 27:11±0:62 31:07±1:07
Training experience (years) 5.0±2.42 4.44±1.9
Note:Results are expressed as mean ± standard deviation
Open Access Journal of Sports Medicine downloaded from https://www.dovepress.com/ by 118.70.13.36 on 26-Aug-2020
positively correlated with thefinishing time of male runners only (p<0.05).
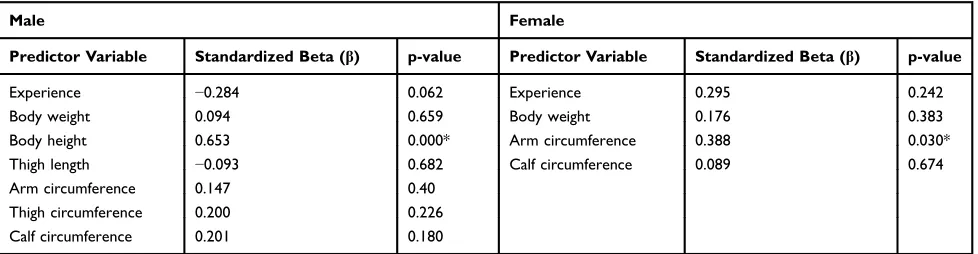
Regression Analysis of the Predictor Variables on the Finishing Time
Multicollinearity tests were done between each predictor variable for the presence of correlations between them
using variance inflation factor (VIF). The results confirmed
that VIF output is less than 5, which is in line with the
recommended cut off points for correlation between
inde-pendent factors.15The influence/strength of the association
between anthropometric variables and thefinishing time of
athletes was clarified using multiple regression analysis. In
doing so, variables such as running experience, body weight, body height, thigh length, arm circumference, thigh circum-ference, and calf circumference were taken as predictor vari-ables in the regression model. However, the body height of
male athletes appeared to have a significant positive
predic-tion effect on finishing time (negative to performance
(p<0.05; Table 3). The scatter diagram with a regression
line and prediction interval shown inFigure 1indicates that
an increase in body height of male runners has an effect on running time.
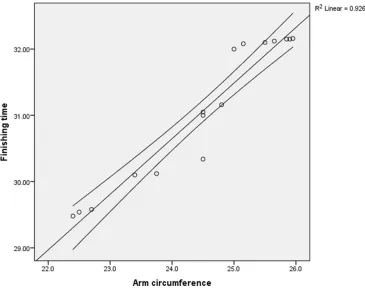
A scatter diagram with a regression line and prediction
interval inFigure 2shows that an increase in arm
circum-ference positively associated with the running time of female athletes respectively.
Discussion
For this study, the subjects were world-class runners
ful-filling the requirements of 28:12.00/min: sec set by IAAF
for men and 32:20.00 min: sec for women. The biological differences between men and women refer that men are stronger, faster and hence more dominant in sports
includ-ing 10,000 meters runninclud-ing discipline.16,17However; other
studies18,19have suggested that sex differences in records
and performances of runners may disappear when differ-ences are going to be diminished in the future.
In the present study, the running experience of male and female athletes showed a negative association with
finishing time (p<0.05; Table 3); the less experience an
athlete had, the longer time he/she took to finish the
10,000-meter distance. In addition, a significant partial
correlation was seen between experience and finishing
time of both sexes when the effect of age was controlled
as a covariant (Table 4, p < 0.05).
However, there was no statistically significant
correla-tion observed between the age and finishing time of
run-ners in both male and female athletes (p > 0.05;Table 3).
The association between experience and better perfor-mance may be linked to better adjustment of runners that could improve the economy of movement. Another effect of experience associated with ease of psychological factors that act upon athletes. This might be due to the familiar-ization of athletes to running related extrinsic as well as intrinsic factors that may determine the economy of run-ning and a reaction to any stimulus. This agrees with the
Table 2Anthropometric Profiles of Male and Female Athletes
Variables Results
Male Female
Body weight/kg 57.4±3.94 47.27±3.47
Body height/cm 172.7±3.9 163.19±3.23
Limb Length/cm
Arm 29.0±3.53 24.5±1.22
Forearm 27.6±4.3 26.3±2.58
Thigh 40.8±0.9 37.9±1.62
Leg 38.6±1.28 36.2±2.30
Limb Circumference/cm
Arm 28.95±3.54 22.9±3.25
Thigh 46.9±4.58 36.9±4.12
Calf 31.97±4.36 23.3±6.45
Note:Results are expressed as mean ± standard deviation.
Table 3Correlation Between Finishing Time and Anthropometric
Variables of Athletes
Variable Results
Male (n=16) Female (n=16)
r p-value r p-value
Experience −0.602 0.014* −0.519 0.039*
Age 0.042 0.877 −0.117 0.665
Body weight, kg 0.585 0.017* 0.517 0.040*
Body height, cm 0.729 0.002* 0.208 0.439
Length, cm
Arm 0.366 0.163 0.451 0.080
Forearm 0.364 0.166 0.462 0.072
Thigh 0.584 0.018* −0.03 0.921
Leg 0.270 0.312 −0.27 0.304
Circumference, cm
Arm 0.590 0.016* 0.539 0.031*
Thigh 0.620 0.010* 0.234 0.383
Calf 0.498 0.050* 0.506 0.046*
Note:p<0.05 was considered significant (*); r = correlation coefficient
Open Access Journal of Sports Medicine downloaded from https://www.dovepress.com/ by 118.70.13.36 on 26-Aug-2020
Figure 1Scatter diagram offinishing time and body height of male runners showing the linear regression line and prediction interval.
Figure 2Scatter diagram offinishing time and arm circumference of female runners showing the linear regression line and the prediction interval.
Open Access Journal of Sports Medicine downloaded from https://www.dovepress.com/ by 118.70.13.36 on 26-Aug-2020
report of a study by Conley et al, Charkoudian and
Joyner20,21 who found out that highly experienced and
trained distance runners perform better than inexperienced runners did.
A number of studies have drawn attention to age-related changes in the musculoskeletal system and other organ systems that lead to a decline in performance with
age.22,23 The age of runners in the present study did not
correlate with their performance (p>0.05; Table 3). The
absence of a significant age-performance association may
suggest that a narrow range of age in athletes of the present study could not allow the effect of age to be seen on performance.
A significant positive association of body weight to
finishing time was observed in both male and female
athletes (p<0.05; Table 3). However, the partial effect of
body weight onfinishing time by controlling its covariants
was found insignificant (p>0.05) in both men and women
(Table 4).
Male runners’body height correlated positively to
run-ning time (p<0.05). In contrast, female runners did not
show a significant correlation between body height and
finishing time (p>0.05) (Table 3). However, the body
height of male runners, despite its bivariant effect on
finishing time, did not show a significant association with
finishing time when the effect of its covariants such as
body weight, thigh length, and leg length was controlled
(p>0.05;Table 4). This shows that being heavier, taller and
larger had a negative effect on better performance for men
as well as women. Thisfinding agrees with that of Cureton
et al,24that stated,“Being larger and heavier is like being
caught by a heavy backpack which engages the individual to work harder. Therefore, this may favor runners of rela-tively lighter, shorter/average and smaller to perform
bet-ter (to finish earlier). However, despite the significant
effect of body weight and body height along with their
covariants, none of them shows a significant effect on
performance when each of them is checked by controlling the corresponding covariant (s). This is true for both men and women runners.
This implies that the effect of body weight, body height
and body mass index on performance is significant only in
the presence of their corresponding covariants’effect.
Thefindings of the present study also indicate that the
length of arm, forearm, leg in both sexes and length of the
thigh in women had no significant association with
run-ning time (p>0.05; Table 3). The longer the length of the
thigh, the lower the performance becomes. Men’s thigh
length showed a significant positive association with
run-ning time (p<0.05;Table 3). However, thigh length did not
show an apparent effect on performance when its
covar-iants were controlled. This implies that the significant
correlation between thigh length and performance is a combined effect of thigh length and its covariants. This
is in agreement with a study by Lucia et al,25who
inves-tigated the relationship between anthropometric character-istics and performance in Eritrean and Spanish runners. They noted a better performance of the Eritreans who were characterized by shorter thigh length than the Spaniards on condition that the Eritreans are lighter, shorter and smaller than the Spaniards. On the contrary, a study by Knechtle
et al,26 on the association between performance and
anthropometric variables of male Caucasian endurance runners, found out a positive correlation between longer lengths of the leg (total lower limb, in their context) and time performance.
In the present study, a relatively smaller arm and calf circumferences have a positive effect on the better
perfor-mance of both men and women (p<0.05; Table 3). On the
other hand, smaller thigh circumference showed a positive
Table 4Multiple Linear Regression Analysis Results of Predictor Variables in Men and in Women
Male Female
Predictor Variable Standardized Beta (β) p-value Predictor Variable Standardized Beta (β) p-value
Experience −0.284 0.062 Experience 0.295 0.242
Body weight 0.094 0.659 Body weight 0.176 0.383
Body height 0.653 0.000* Arm circumference 0.388 0.030*
Thigh length −0.093 0.682 Calf circumference 0.089 0.674
Arm circumference 0.147 0.40
Thigh circumference 0.200 0.226
Calf circumference 0.201 0.180
Notes:For men (Adjusted R-square = 0.742; F2, 13 =22.55), and for women (Adjusted R square = 0.643; F2, 13 =14.492, p<0.05). p<0.05 was considered significant (*);β= regression coefficient. Dependent variable - running time.
Open Access Journal of Sports Medicine downloaded from https://www.dovepress.com/ by 118.70.13.36 on 26-Aug-2020
association only to better performance of men (p<0.05). This
finding agrees with thefindings of Tanaka and Matsura27
who reported that smaller thigh circumference is related to better performance runners over 5000 meters. Similarly,
Rahmani et al,28in their report of comparative study between
Senegalese and Italian runners, and Lucia et al,25 in their
comparative study between Eritreans and Spaniards, found out that African runners have lighter thigh and legs. On the
other hand, Knechtle et al,26found out a negative association
of arm circumference with the performance of endurance
runners. However, the latter study did not find a significant
correlation between performance and circumferences of the thigh and calf.
Conclusion
In the present study, the age of the runners did not correlate with their performance. In both sexes, experienced athletes performed better in 10,000 meters distance. Anthropometric
variables displayed significantly higher values in men than in
women. For both male and female athletes, those who had lighter body weight, shorter/average body height, and smaller body size, shorter thigh, smaller circumferences (arm, thigh, and calf) performed better. No single anthropometric variable showed a partial correlation with running time in the absence of its corresponding covariant(s) with that of running time. The results of this study showed that morphological
charac-teristics of runners have a significant impact on race
perfor-mance and achievement of better results. Anthropometric parameters may be useful for selection, prediction and improving running performance as well as for preventing injuries and health risk assessment.
Data Sharing Statement
The data sets analyzed during this study are available from the corresponding author on reasonable request.
Disclosure
The authors declare no conflicts of interest.
References
1. Jaime S, Lago C, Drinkwater EJ. Explanations for the United States of America’s dominance in basketball at the Beijing Olympic Games (2008). J Sports Sci. 2010;28(2):147–152. doi:10.1080/02640410 903380486
2. Claude B, Malina RM, Pérusse L. Genetics of Fitness and Physical Performance. Human Kinetics.1997.
3. Onywera VO, Scott RA, Boit MK, Pitsiladis YP. Demographic char-acteristics of elite Kenyan endurance runners.J Sports Sci.2006;24 (4):415–422. doi:10.1080/02640410500189033
4. Scott RA, Georgiades E, Wilson RH, Goodwin WH, Wolde B, Pitsiladis YP. Demographic characteristics of elite Ethiopian endur-ance runners. Med Sci Sports Exerc. 2003;35(10):1727–1732. (). doi:10.1249/01.MSS.0000089335.85254.89
5. Bale J, Sang J.Kenyan Running: Movement Culture, Geography, and Global Change. Vol. 19. Routledge; East African Geographical Review;2013:1.
6. Hamilton B. East African running dominance: what is behind it?Br J Sports Med.2000;34(5):391–394. doi:10.1136/bjsm.34.5.391 7. Saltin B. Exercise and the environment: focus on altitude. Res
Q Exerc Sport.1996;67(sup3):S1–S10. doi:10.1080/02701367.1996. 10608849
8. Saltin B, Larsen H, Terrados N, et al. Aerobic exercise capacity at sea level and at altitude in Kenyan boys, junior and senior runners compared with Scandinavian runners. Scand J Med Sci Sports. 1995;5(4):209–221. doi:10.1111/j.1600-0838.1995.tb00037.x 9. Entine J.Taboo: Why Black Athletes Dominate Sports and Why We
are Afraid to Talk About It. New York: Public Affairs;2008. 10. Baker J, Horton S. East African running dominance revisited: a role
for stereotype threat? Br J Sports Med. 2003;37(6):553–555. doi:10.1136/bjsm.37.6.553
11. Entine J The Story Behind the Amazing Success of Black Athletes. 12. Arazi H, Mirzaei B, Nobari H. Anthropometric profile, body
compo-sition and somatotyping of national Iranian cross-country runners. Turk J Sport Exercise.2015;17(2):35–41. doi:10.15314/tjse.49873 13. Stuelcken M, Pyne D, Sinclair P. Anthropometric characteristics of
elite cricket fast bowlers. J Sports Sci. 2007;25(14):1587–1597. doi:10.1080/02640410701275185
14. Westat I. National Health and Nutrition Examination Survey III: Body Measurements (Anthropometry). Rockville, MD: Westat, Inc; 1988.
15. Akinwande MO, Dikko HG, Samson A. Variance inflation factor: as a condition for the inclusion of suppressor variable(s) in regression analysis.Open J Stat.2015;5:754–767. doi:10.4236/ojs.2015.57075 16. Deaner RO. More males run relatively fast in US road races: further
evidence of a sex difference in competitiveness.Evol Psychol.2006;4 (1). doi:10.1177/147470490600400126
17. Sparling PB, Cureton KJ. Biological determinants of the sex differ-ence in 12-min run performance. Med Sci Sports Exerc. 1983;15 (3):218–223. doi:10.1249/00005768-198315030-00007
18. Beneke R, Leithäuser RM, Doppelmayr M. Women will do it in the long run.Br J Sports Med.2005;39(7):410. doi:10.1136/bjsm.2004.017574 19. Zingg MA, Karner-Rezek K, Rosemann T, Knechtle B, Lepers R,
Rüst CA. Will women outrun men in ultra-marathon road races from 50 km to 1000 km?Springer Plus.2014;3(1):97. doi:10.1186/2193-1801-3-97
20. Conley DL, Krahenbuhl GS. Running economy and distance running performance of highly trained athletes. Med Sci Sports Exerc. 1980;12(5):357–360. doi:10.1249/00005768-198025000-00010 21. Charkoudian N, Joyner MJ. Physiologic considerations for exercise
performance in women. Clin Chest Med. 2004;25(2):247–255. doi:10.1016/j.ccm.2004.01.001
22. Dietzel R, Gast U, Heine T, Felsenberg D, Armbrecht G. Cross-sectional assessment of neuromuscular function using mechanogra-phy in women and men aged 20–85 years.J Musculoskelet Neuronal Interact.2013;13(3):312–319.
23. Lara B, Salinero JJ, Del Coso J. The relationship between age and running time in elite marathoners is U-shaped. Age. 2014;36 (2):1003–1008. doi:10.1007/s11357-013-9614-z
24. Cureton K, Bishop P, Hutchinson P, Newland H, Vickery S, Zwiren L. Sex difference in maximal oxygen uptake.Eur J Appl Physiol Occup Physiol. 1986;54(6):656–660. doi:10.1007/ BF00943356
25. Lucia A, Esteve-Lanao J, Oliván J, et al. Physiological characteristics of the best Eritrean runners’ exceptional running economy. Appl Physiol Nutr Metab.2006;31(5):530–540. doi:10.1139/h06-029
Open Access Journal of Sports Medicine downloaded from https://www.dovepress.com/ by 118.70.13.36 on 26-Aug-2020
26. Knechtle B, Duff B, Welzel U, Kohler G. Body mass and circumference of the upper arm are associated with race performance in ultra-endurance runners in a multistage race-the Isarrun 2006.Res Q Exerc Sport.2009;80 (2):262–268. doi:10.1080/02701367.2009.10599561
27. Tanaka K, Matsuura Y. A multivariate analysis of the role of certain anthropometric and physiological attributes in distance running.Ann Hum Biol.1982;9(5):473–482. doi:10.1080/03014468200006001
28. Rahmani A, Locatelli E, Lacour JR. Differences in morphology and force/velocity relationship between Senegalese and Italian sprinters. Eur J Appl Physiol.2004;91(4):399–405.
Open Access Journal of Sports Medicine
Dove
press
Publish your work in this journal
Open Access Journal of Sports Medicine is an international, peer-reviewed, open access journal publishing original research, reports, reviews and commentaries on all areas of sports medicine. The
manuscript management system is completely online and includes a very quick and fair peer-review system. Visit http://www.dovepress. com/testimonials.php to read real quotes from published authors.
Submit your manuscript here:http://www.dovepress.com/open-access-journal-of-sports-medicine-journal
Open Access Journal of Sports Medicine downloaded from https://www.dovepress.com/ by 118.70.13.36 on 26-Aug-2020